
A BTC 4th Quarter Scenario
Dear Readers,

While the previous two articles over the past month were focused on the consolidation in Bitcoin price, that looks to have run its course, this article will look to sketch out the possible coming move up that has been expected for sometime. It will also explore whether or not that move must be restricted to the 4th quarter or not, whether it may also stretch into next year. Of course, these speculations, never a certainty, are based both on a multi-year bull market and where price is currently located in the model of logarithmic growth curve. Though speculative in nature, there is also some rationality to them resulting in a confident hold based on the technicals as opposed to a blind gamble. And so to the chart.
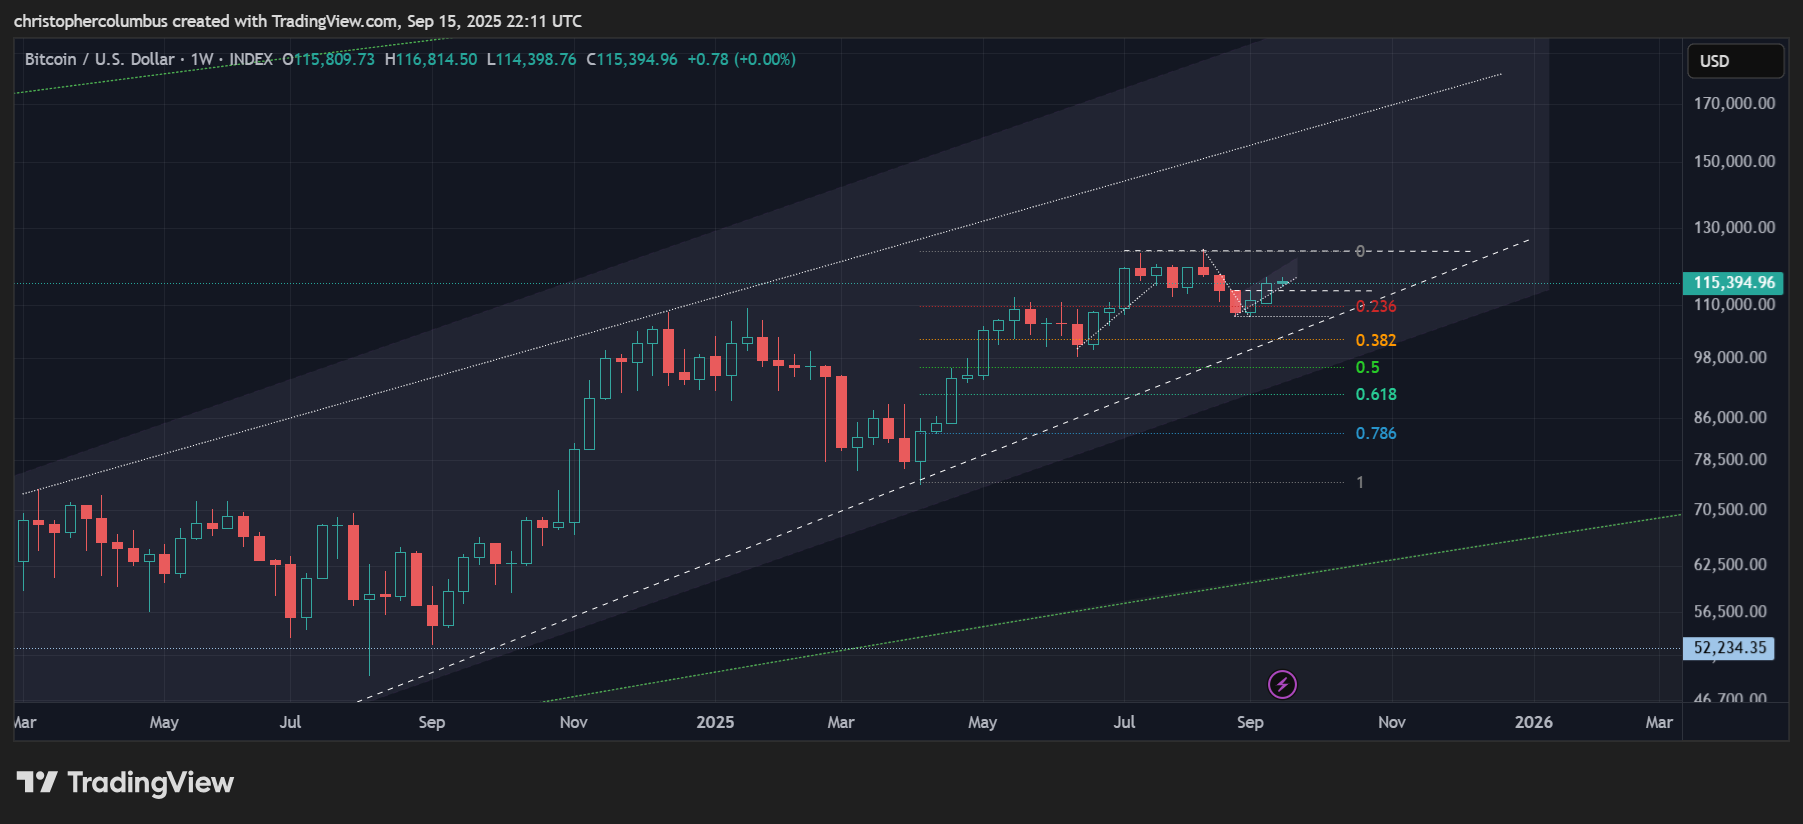
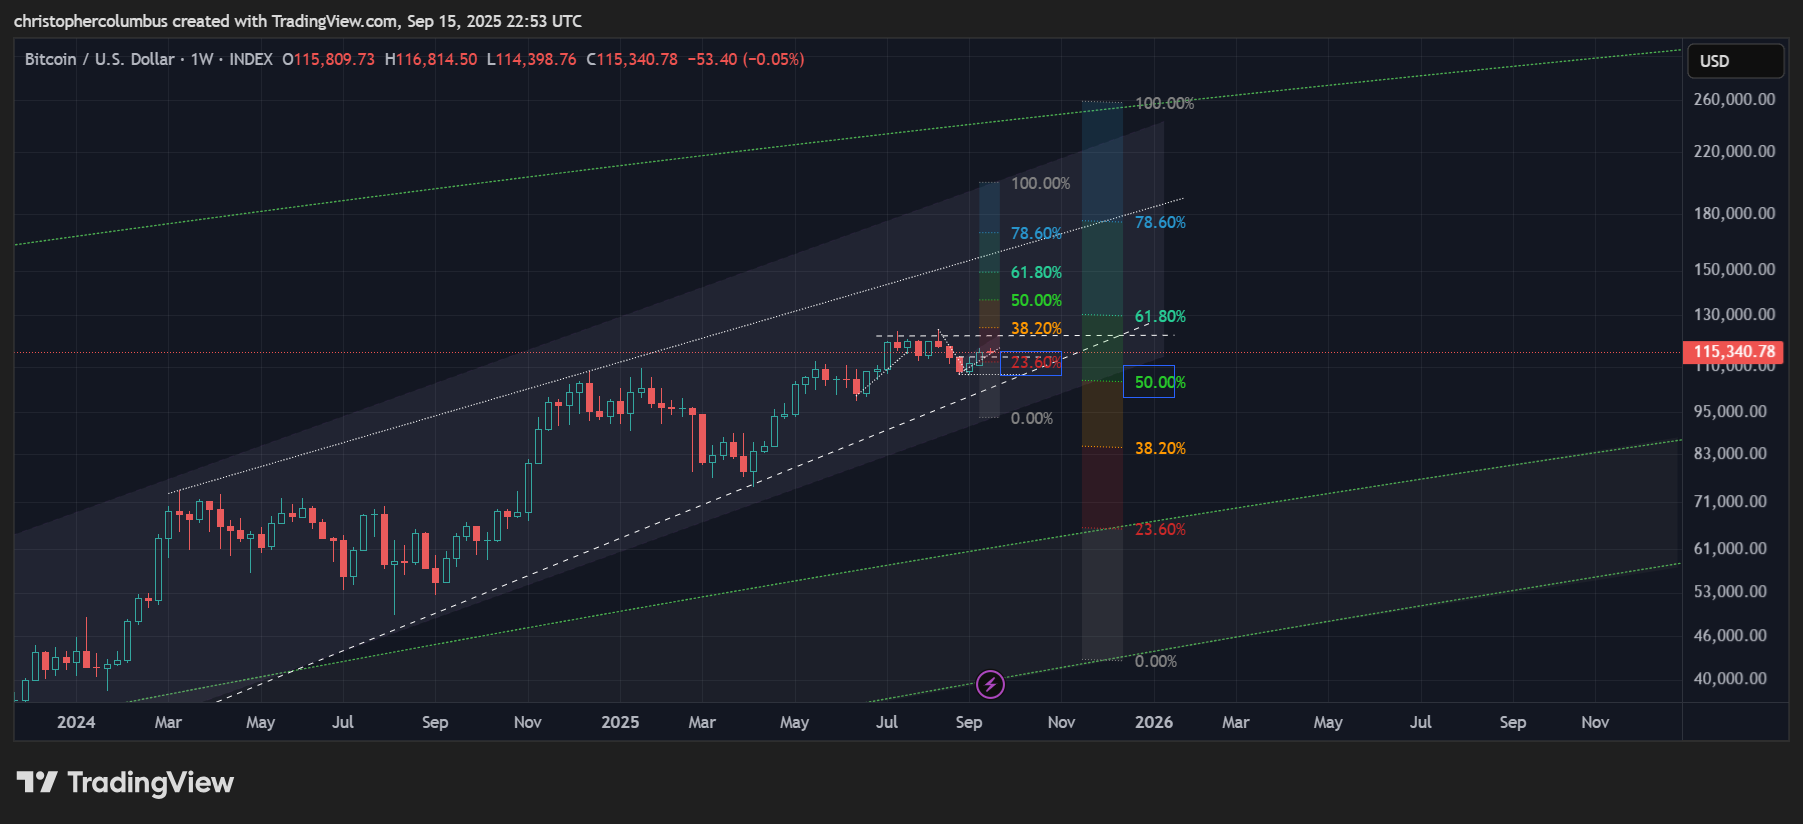
On the weekly chart we see renewed strength after a recent consolidation. Though price declined 18K from the top, this was only to the first fib level, 23% of the recent move up in real terms as measured by that fib. A break of short-term diagonal resistance, followed on by a break of short-term horizontal resistance, sees price developing in an upper range… within striking distance of all-time-highs.
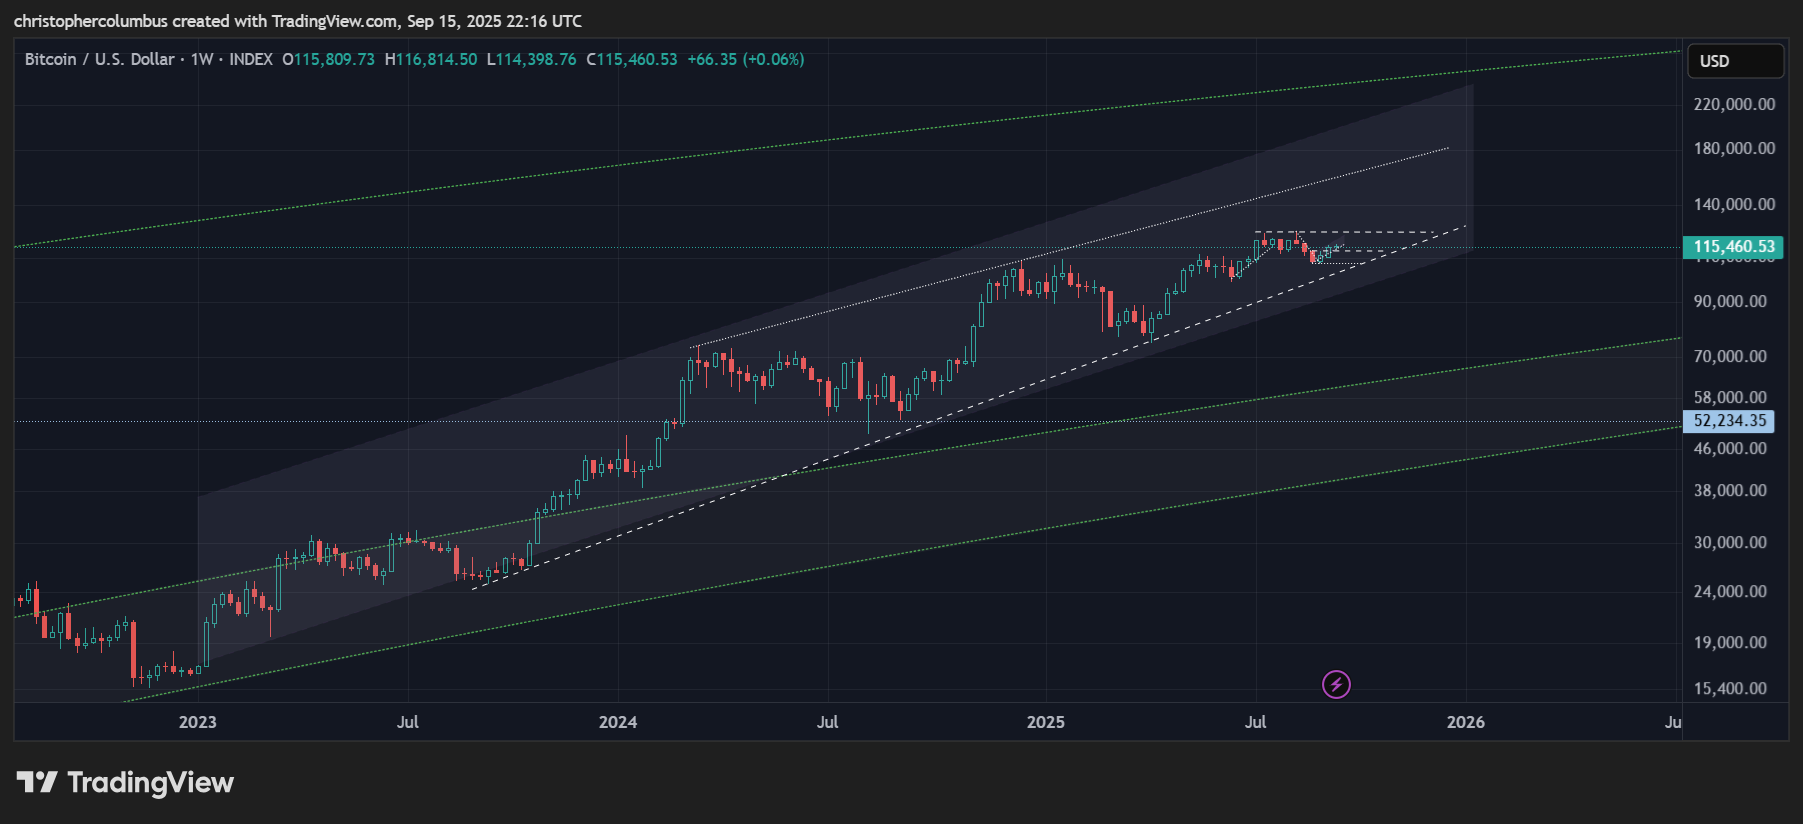
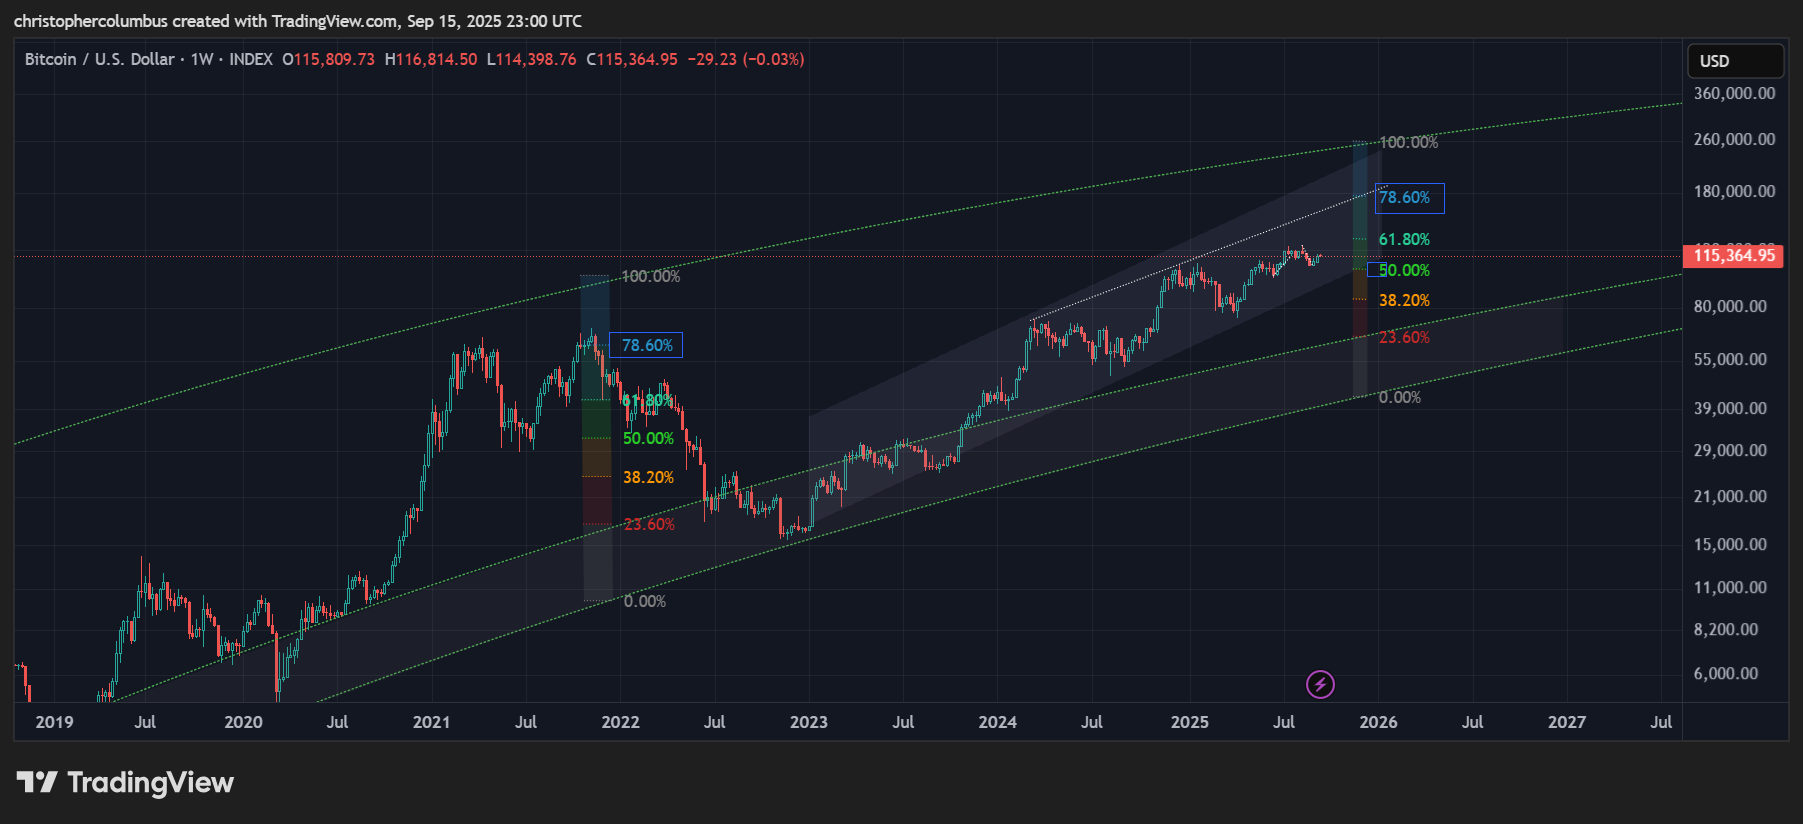
On zooming out a little, we can see that price continues to remain remarkably technical…. as if the market were maturing from one that was typified by extreme volatility, parabolic moves, and subsequent collapses, to one more stable and technical. And this was always to be expected, was indeed predicted in the notion of a maturing market well before this price action has served to validate that thesis.
Of significance here is the steady rise in the technical multi-year channel, and where price is currently low in that channel. Price has never got over-extended while at the same time is has steadily got higher. It seems reasonable to think that there is a move or two within this cycle yet. Before going on to a discussion or review of the ‘multi-year cycle’, in the light of a maturing market, I’ll here focus on a possible scenario developing over the course of the 4th quarter that would be consistent with both the technical channel and the LGC [logarithmic growth curve] channel/ model.
4th Quarter Scenario
To begin with, it would only take a 50% move from previous highs to see 180k reached making that target technically feasible… the number gets big fast. Given that such a move happened relatively recently, it would not even require a parabolic move… though no doubt there would be some excitement in the market given the large number.
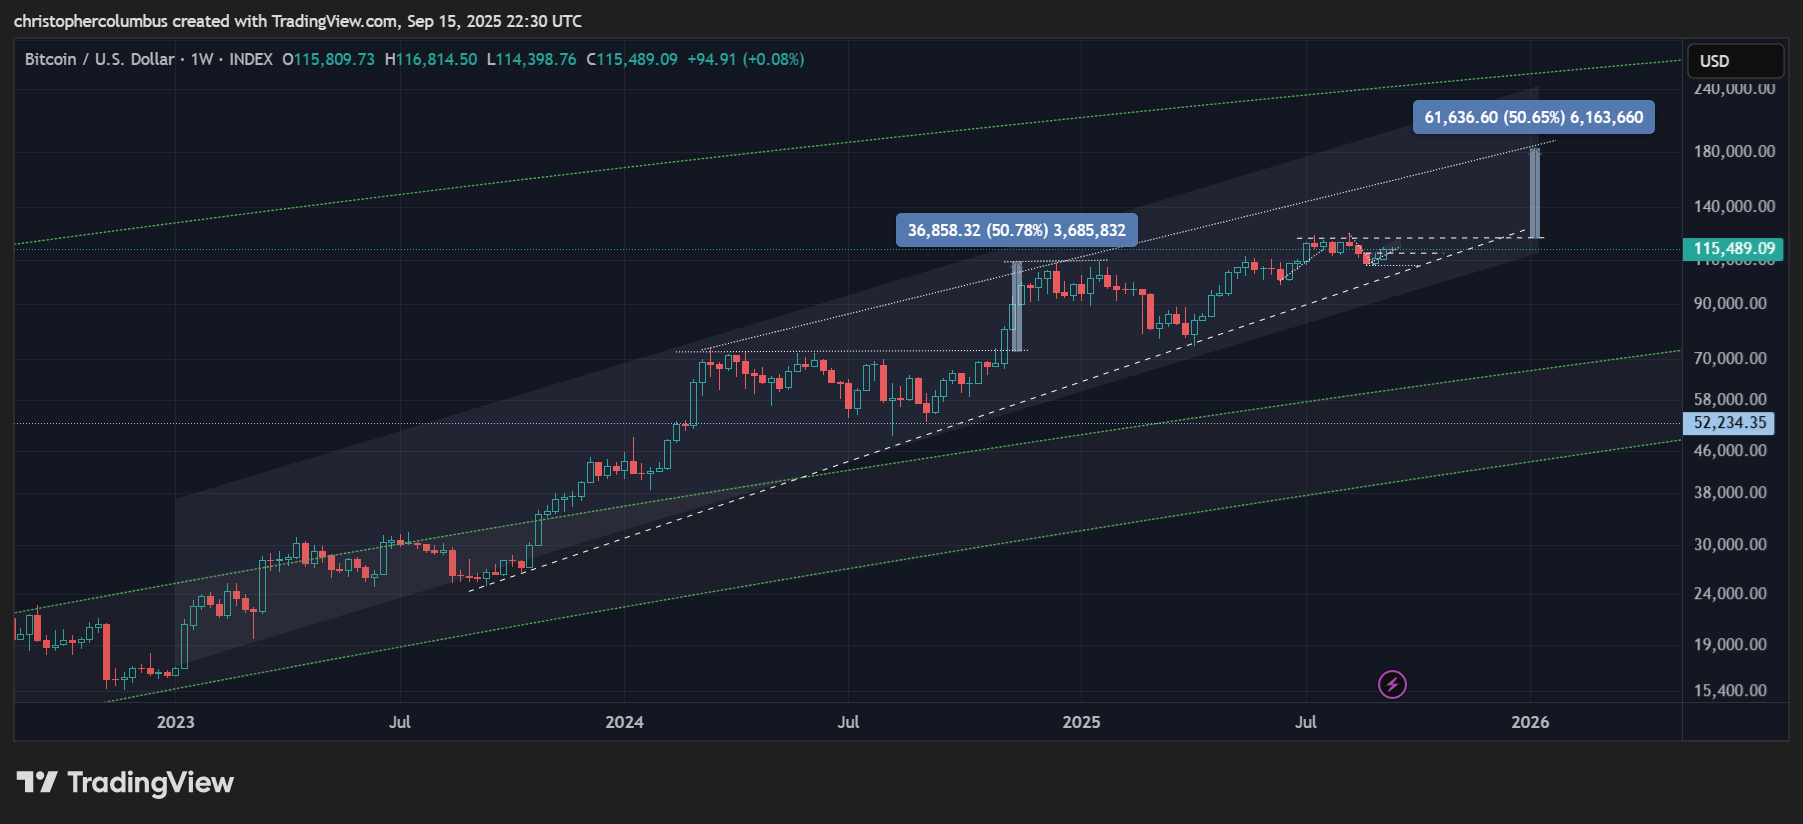
This price target is also supported/ corroborated by overlaying a fib extension comparison onto the chart [below], where the extension to the upside matches the lower range beforehand. Once again, nothing too surprising from the technical perspective about that target. Remember, BTC has always surprised the market along the way with the numbers it reaches when it goes on a run. And while we get used to the high numbers when price consolidates [such as here], we do not have time to get accustomed at all to new prices on a breakout which can clock up quickly.
Some may wonder whether the above two charts are really saying the same thing - that a 50% move up is going to be the same as a 0.5 fib extension [50%]. And this is where it gets interesting. The percentage move up is on the linear scale, measuring price/ the number; the fib extension is on the logarithmic scale that measures the real move, in log/ spatial terms. Where usually on exponentially moving charts, these two scales do not correspond, here they effectively overlap [the fib extension is slightly higher]. Why, because the market has matured, i.e; has become less exponential/ more stable and so these two scales are coming close together.
Lastly, price is currently low in the multi-year upward technical channel and midway in the larger LGC channel - 23% in the technical channel, and just over half way in the channel of the LGC model. this leaves quite some room to run based on these factors.
Review of the ‘Multi-Year Cycle’, in the Light of a Maturing Market
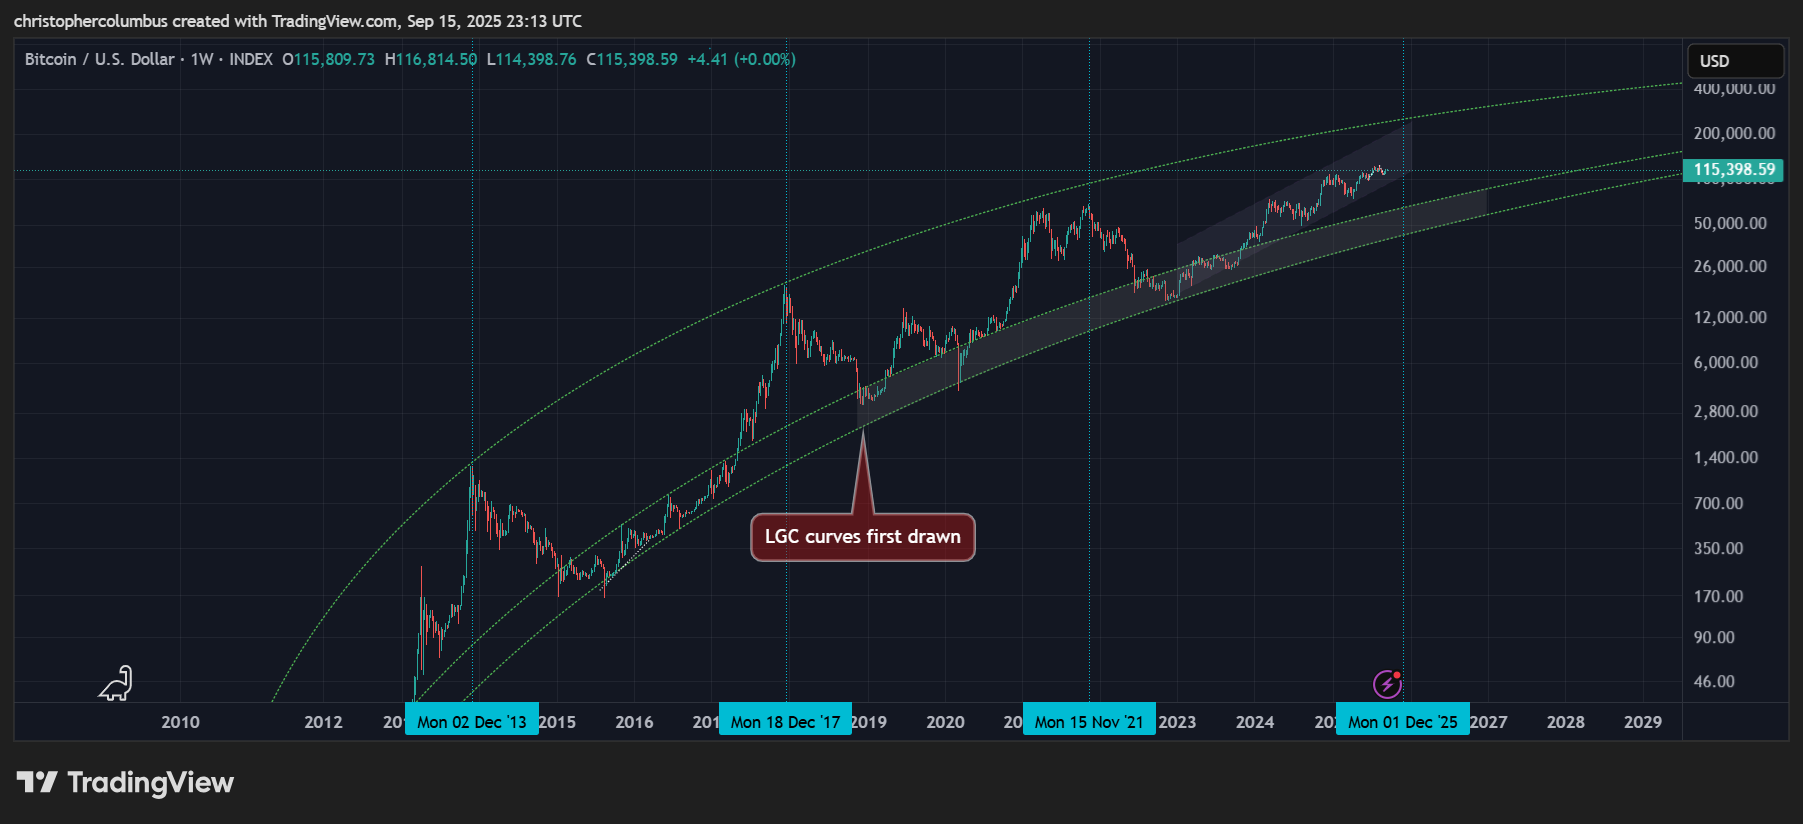
Having already touched briefly on the LGC channel along with the multi-year channel, it might pay here to do a review of these more macro elements.
To begin with, what has to be the most striking feature on first view is the radical/ qualitative difference in the structure between this rise and previous ones - as mentioned this is explicable in my opinion in terms of a maturing market. Keep in mind that over multiple decades price is moving toward price discovery along the lines of a logarithmic growth curve. This involves a rapid rise at the beginning and an increasing plateau of price toward the end of the process - the capitalization of the alternative currency of digital gold.
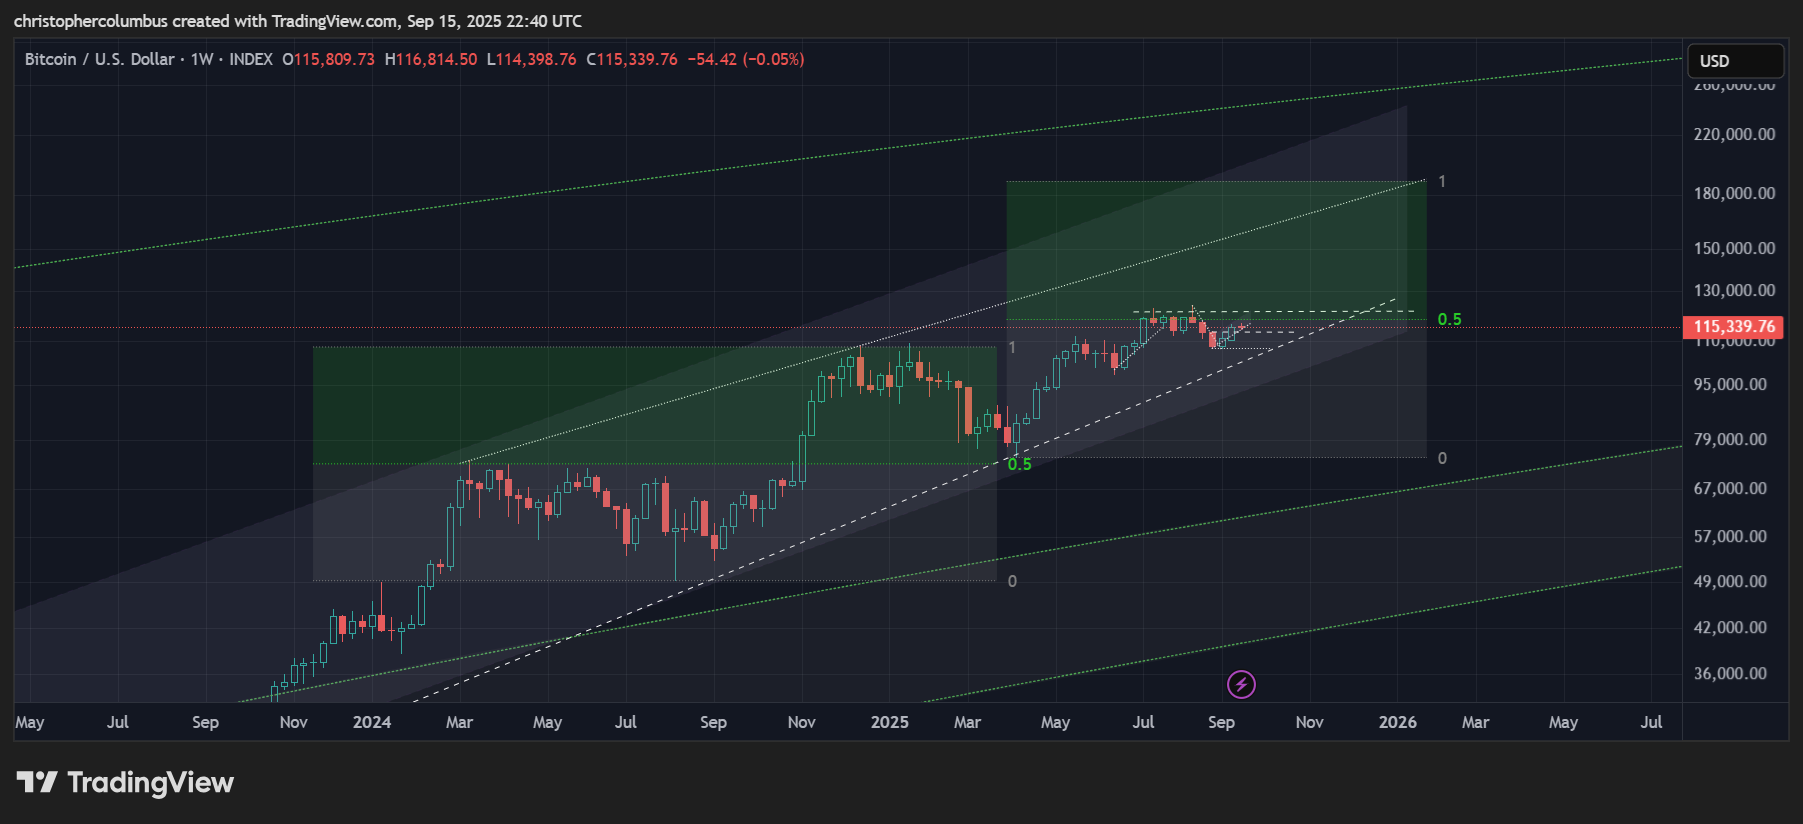
The next thing noticeable on the chart is that large 180k target is still off the top of the channel… reaching 78% as per the previous move [that disappointed many at the time but not those following the LGC]. This makes what could otherwise appear as too high a target a perfectly feasible one within the terms of the LGC model.
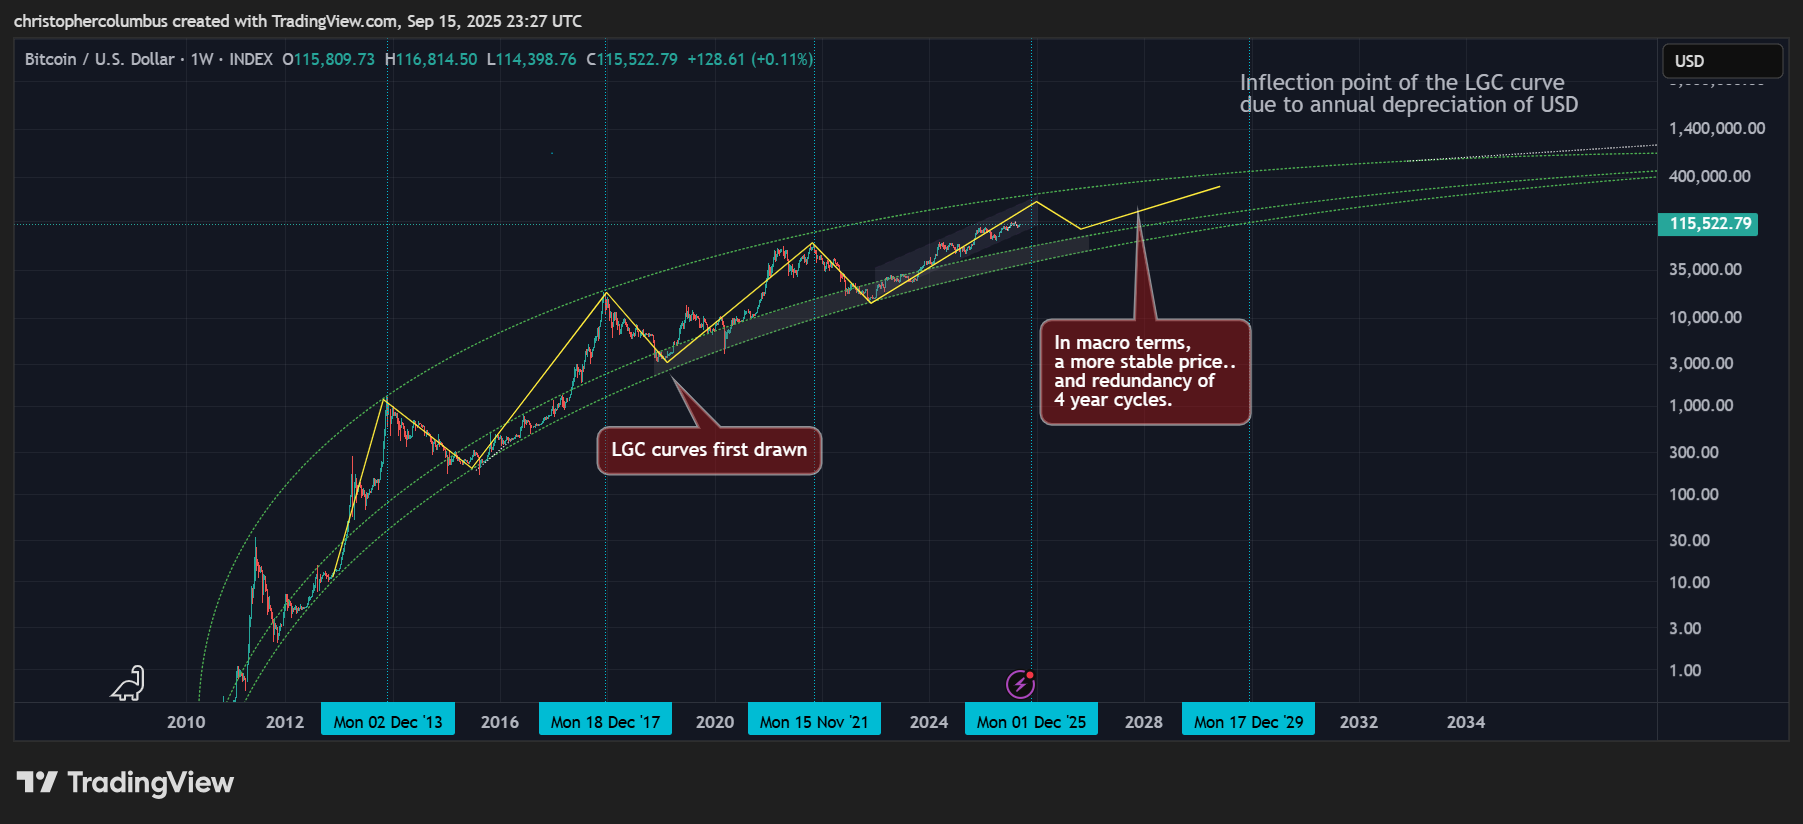
And finally to the time aspect of multi year cycles, something that is subordinate to the LGC channel/ model itself. The multi-year cycle, specifically the 4 year cycle, can become redundant and a thing of the past without that affecting the LGC. Indeed, the idea of a maturing market suggests and predicts that at some point it will become redundant…. part and parcel of Bitcoin price becoming more stable. That said, we may still be in a transitional phase. And so to a review of the 4 year cycle [that coincides with the technical multi-year upward channel], with which it is still reasonable to be working with at the moment.
As far as a 4 year cycle goes, there is life yet in the cycle while price is very much at the business end of it - this 4th quarter. As far as the 4 year cycle goes, there should be a further peak and then a prolonged correction.
The ‘bias’ here should remain with a further move up as the invalidation of that ‘bias’ or theory did not eventuate as per the DEFCON system put in place in the previous articles [put in place to manage/ control the bearish psychology that was developing… bull markets climb a wall of worry].
While the current technical channel continues to look solid, there are two ways in which the 4 year cycle could, strictly speaking, be invalidated - a rolling over of price before another peak [less likely] and a continuation of price higher [remaining elevated in LGC terms] early next year [more likely]. Either way, the LGC would remain and should remain going forward when 4 year cycles become a thing of the past.
Price may well remain relatively elevated as this last macro chart shows, something that comes with maturation, marketplace familiarity, mainstream acceptance, institutional investment etc. Here it would come into its own as digital gold, and like gold, a good means in which to store a part of one’s liquid wealth in order to preserve its purchasing power at a later date.
Until next time,
Stay [relatively] safe out there,
Dave the Wave.