
Alt Spring
Dear Readers,

It’s been a long time coming, but I think it fair to say that we are finally seeing an alt spring. Why the optimism you ask after seeing green shoots before only to be disappointed? My outlook here is based on the following:
- a series of higher highs and higher lows
- the break of longer-term resistances
- the lapse of time
Keep in mind that the natural partner for alt trades is USD, which takes advantage of maximum volatility to take off-setting/ hedging profits in USD. Accordingly, I’ll be looking at a wide cross-section of alt/ USD charts that will serve as examples of the above points. I’ll finish by looking at the BTC dom chart, and the alt market cap.
A Series of Higher Highs and Higher Lows
Classically, this is always what confirms the change in the longer-term trend. Where in the shorter-term, volatility can give the appearance and hope of a change in direction, the longer-term chart provides further confirmation. Those that bought the initial dips, with more risk/ reward, are rewarded with having established more lucrative positions [should the trend persist]. Those that wait for confirmation of higher highs and lows on the chart in turn have a lower risk/ reward buy… yet the buy should still be rewarding enough should the trend persist [purge your mind of the desire for certainty]. And so to a few charts looking at higher highs and lows.
LINK/ USD

CHZ/ USD

ADA/ USD

Break of Longer-Term Resistances
Here the focus is on price breaking through first longer-term diagonal resistances followed on by the break of horizontal resistances, which have to be of primary significance for any renewal in the alt market.
ETH/ USD

ENJ/ USD
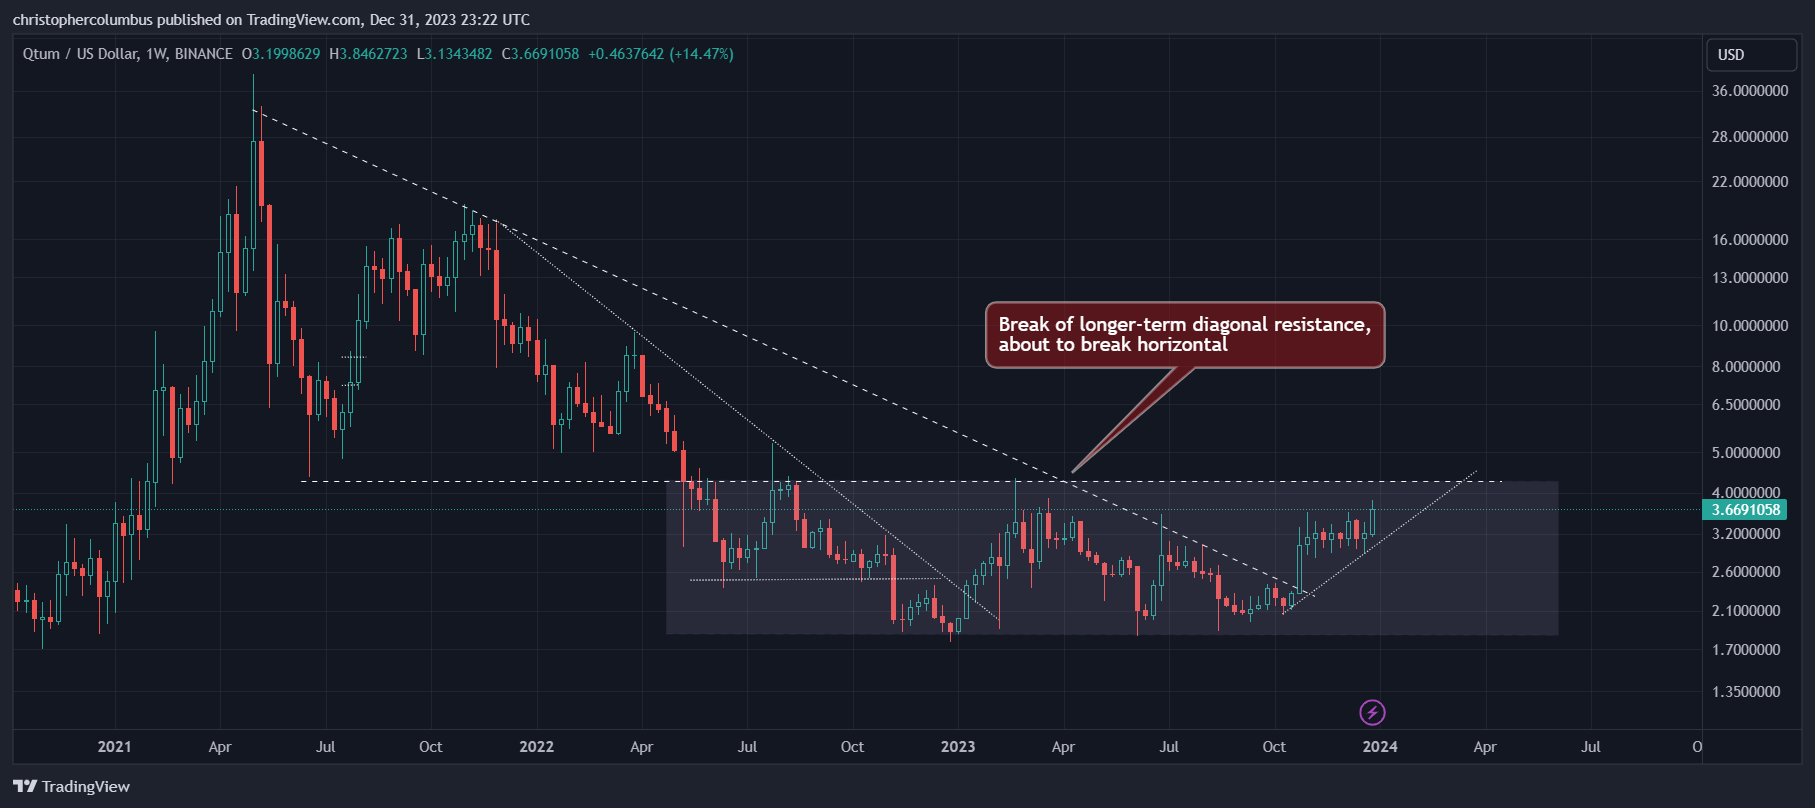
VET/ USD

TIME
Besides the vertical axis of price, the horizontal axis of time provides that complementary metric for recovery of prior price levels.
ONE/ USD

ADA/ USD
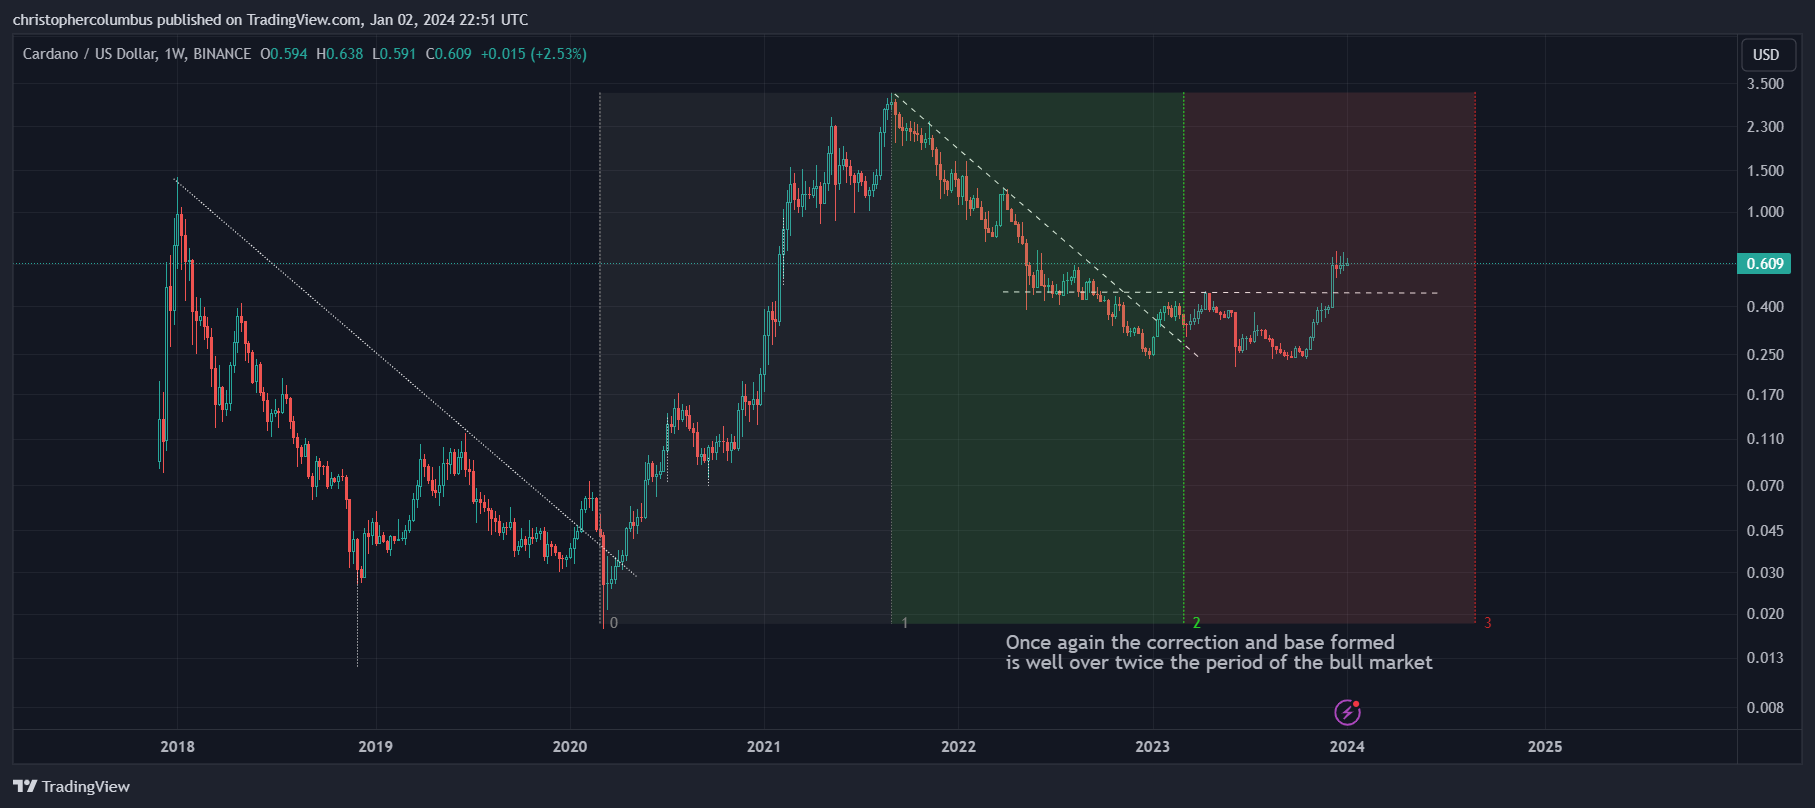
MATIC/ USD

The correction and base formed in MATIC/ USD is twice as long as the previous massive run up. This chart is something of an anomaly as compared to most charts. In real terms/ values, that measures the logarithmic exponential previous increase, only 20% odd off its highs.
BTC dom and Alt Market Cap
BTC Dominance

Though I don’t focus on the BTC dom chart much due to being more picky about the alts I buy [no-one buys an ‘index’ of alts for which this chart would carry more weight], yet I still find it useful. The recent uptrend is starting to break. Not far above this level is both long-term diagonal and horizontal resistances, which I think will hold. This is both consistent with a maturing market, and a renewed bull market in alts. Is this speculative? Sure, and it is in the speculation that we hope to take profits on the extra volatility while remaining long a core position in BTC.
Alt Market Cap

The alt market cap corrected 38% [in real log and proportionate terms], with the cap currently only 20% off its previous highs. The base found support at the 2018 peak, while the market cap has broken both the longer-term diagonal and horizontal resistances, with that cap near doubling off the bottom.
Summary
Though there is never a certainty in the world of speculation, fortune favors the brave [neither the reckless nor the timid]. Add to the burgeoning confidence we can have in the market, given the recent development in price action, keep in mind that in a maturing market diminishing returns is to be expected. This means that your entry levels could end up being crucial in regard to potential returns. For more detailed charts with further technical analysis and entry and exit levels, make sure to check out my website as referenced below.
Until next time,
Stay, relatively, safe out there,
Dave the Wave.