
An Extended Technical Argument for Higher Prices This Year
Dear Readers,
Where last fortnight’s article was more of a theoretical exercise [a maturing market on the macro], time now to swing back to the technicals of this current market. I’ll here be focusing on Fibonacci measurements, and how they apply to both the horizontal and vertical axes of the chart, to both price and time.
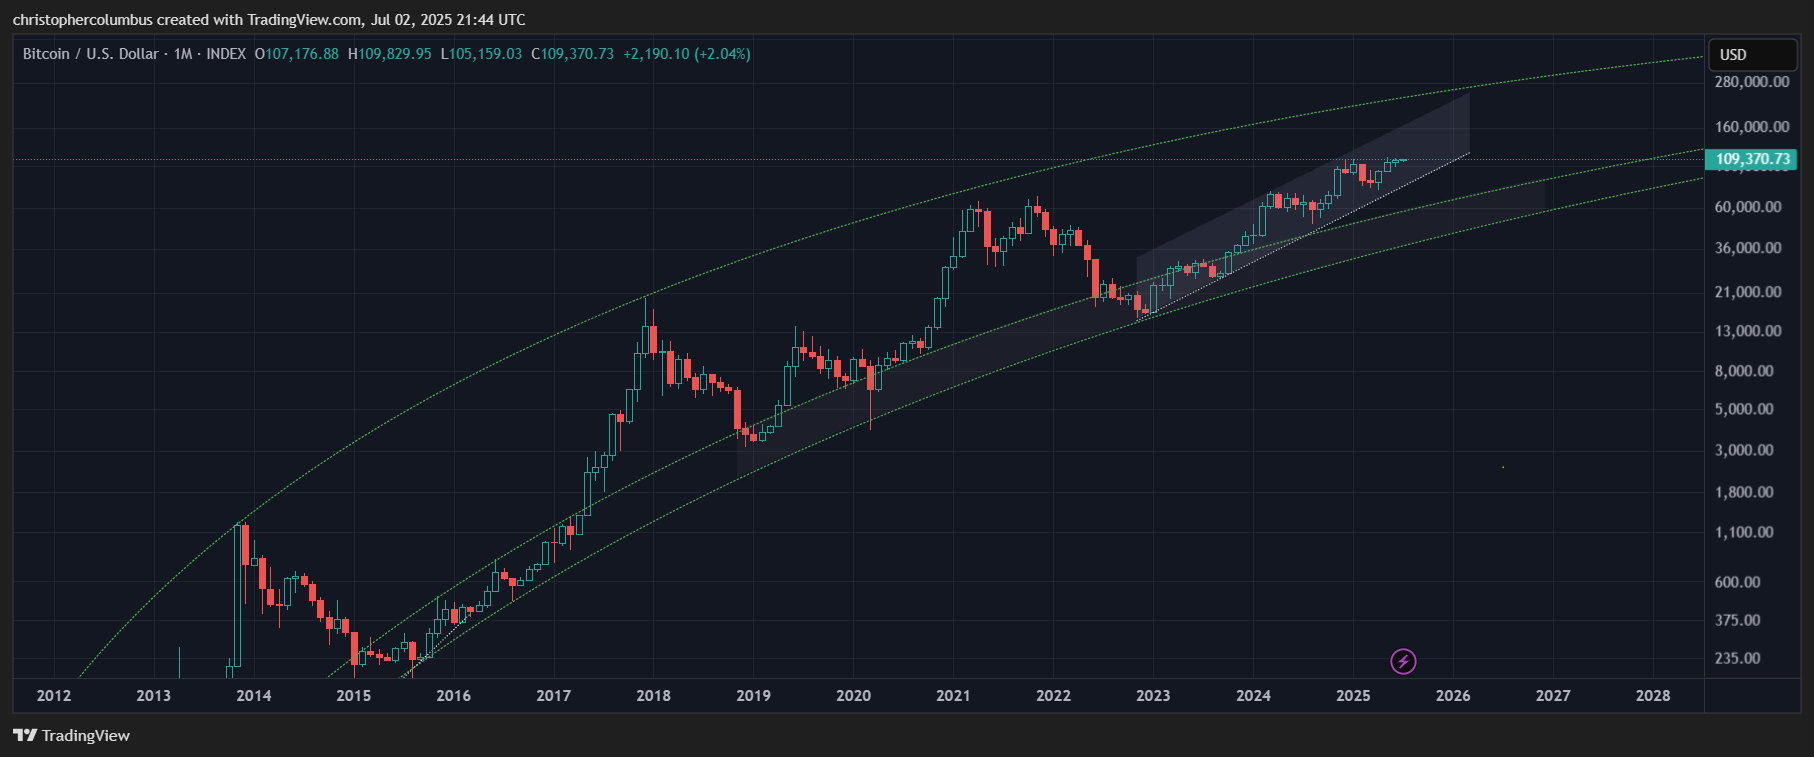
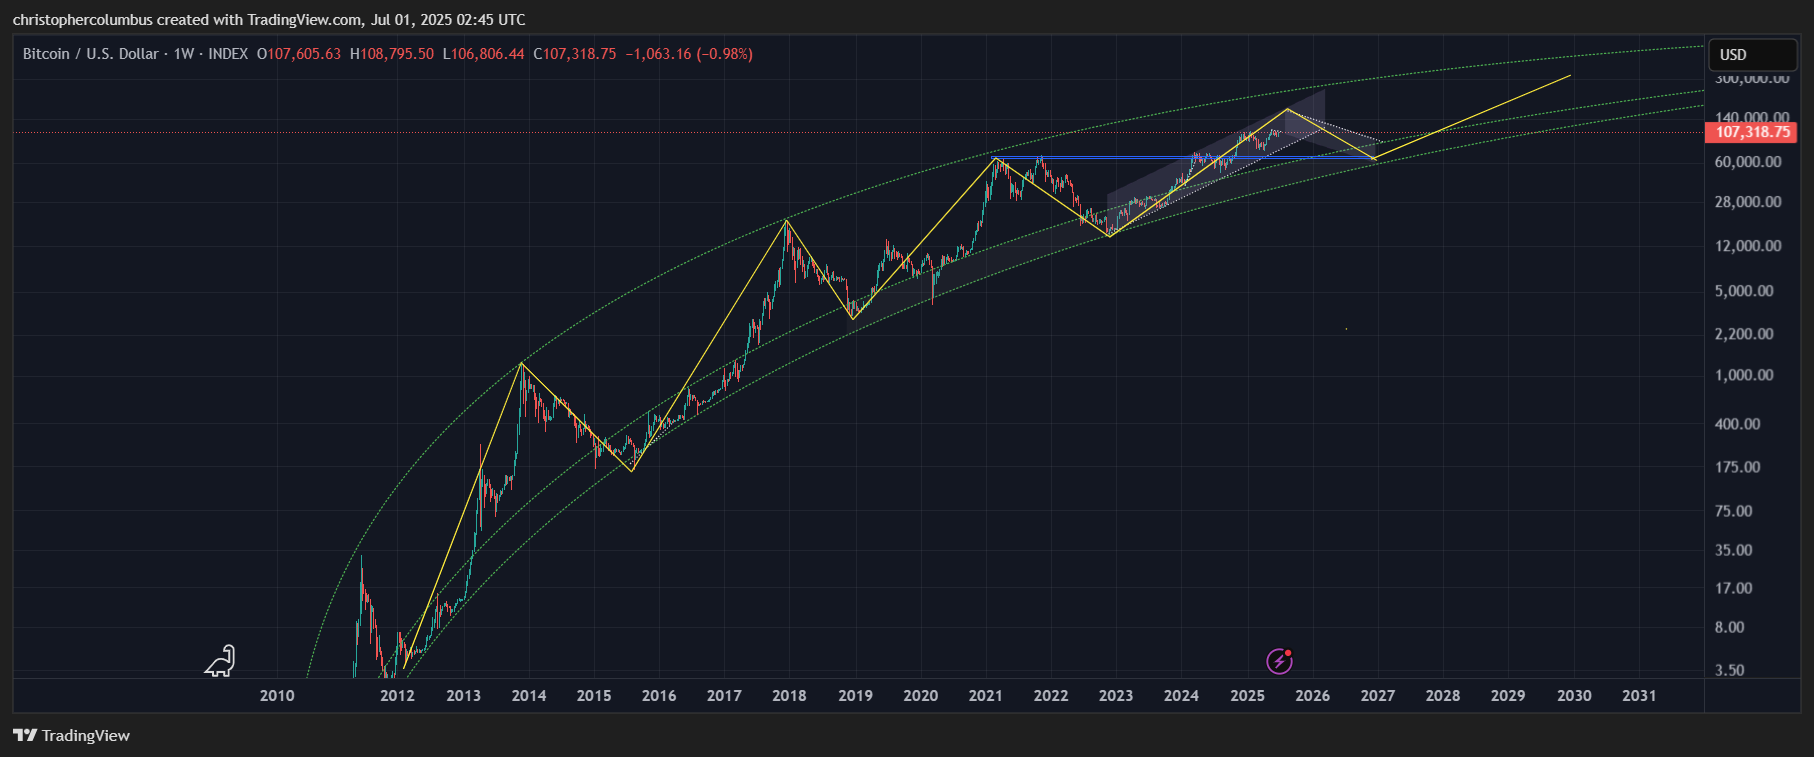
First of, the multi-year technical channel upward that we’re all familiar with:

The remarkable series of the moves up in price [only remarkable as compared to the parabolic moves of yester-year… while explicable in terms of a maturing market] and the subsequent consolidations has led to a situation that ever higher prices are supported by the market. Price look to be more sustainable over an extended period of time at these elevated levels as compared to earlier markets where the making of all time highs consisted in temporary spikes.
Time Fibs on the X Axis
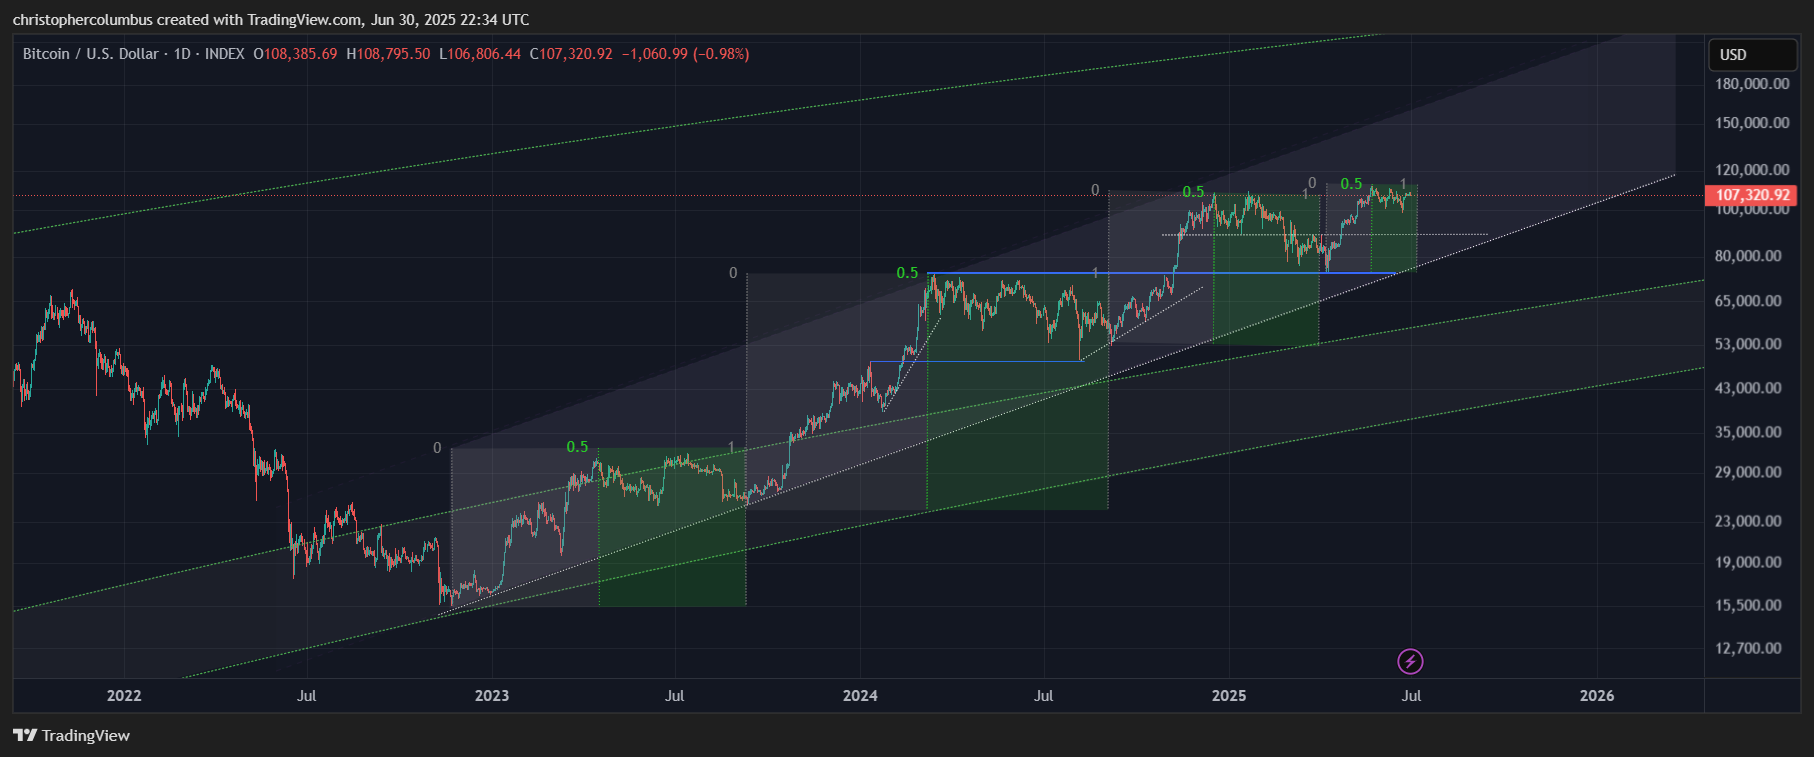
In looking at the series of time fibs overlaid onto the price action of the multi-year channel, we can see that the consolidations have matched the moves up. Also of interest is the contraction of the time involved in the sequence of those consolidations. In contrast to previous cycles, the higher price has gone, the more stable it has become - suggestive of a maturing market. Also of significance is that price is currently located only midway in that multi-year upward channel [not to mention only midway through the wider LGC channel itself, i.e.; you wouldn’t want to be betting on a serious correction in price here].
Having looked at the time fibs on the x axis, time now to look at the fib consolidations within that channel on the y axis.
Price Fibs on the Y Axis
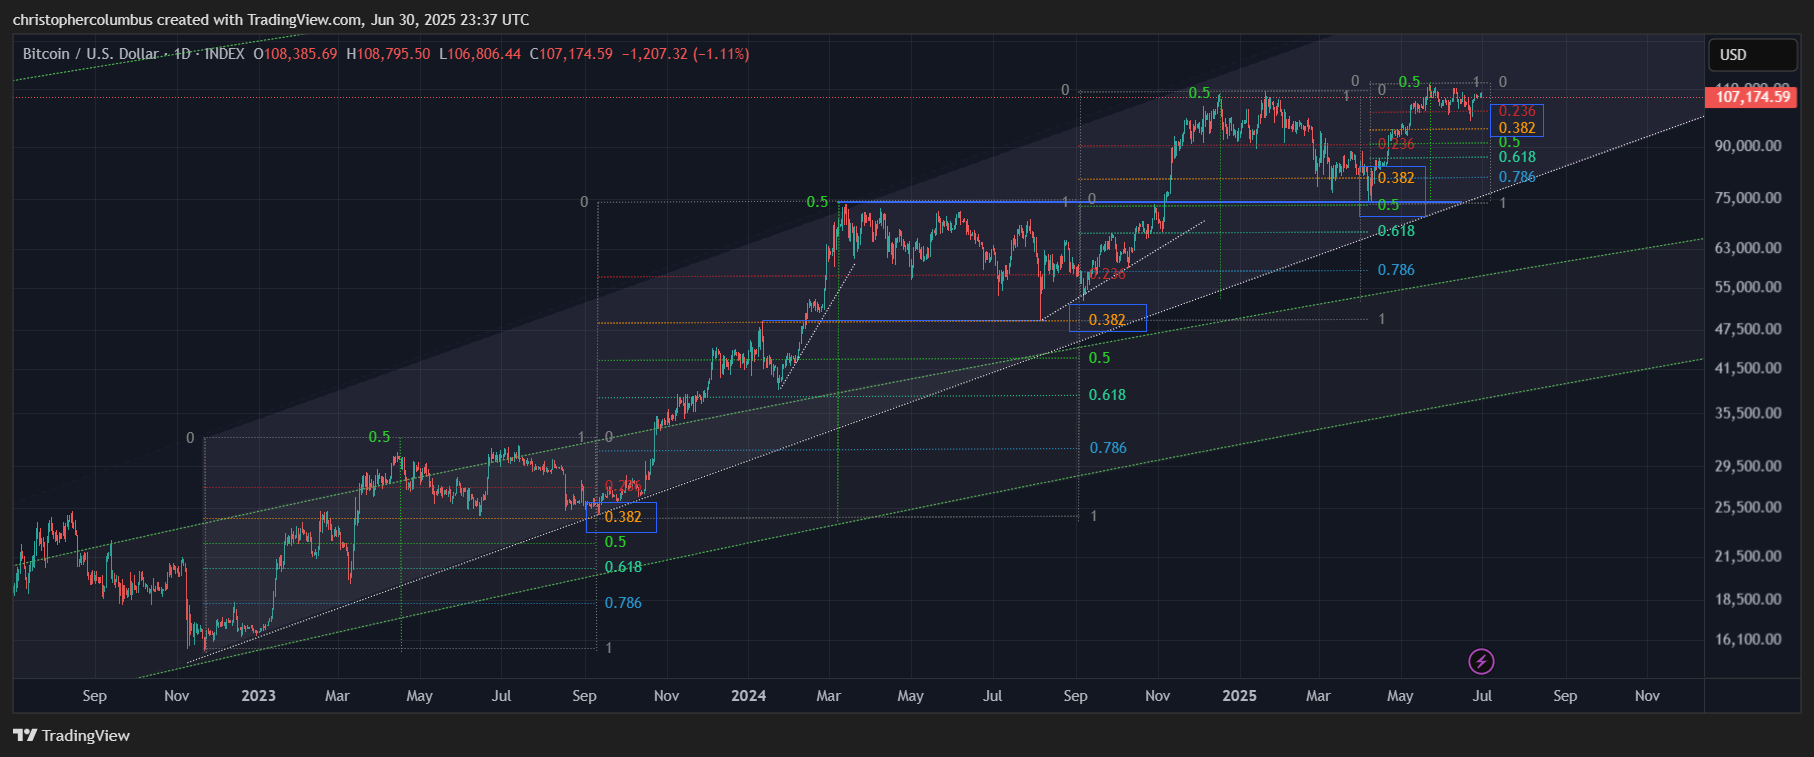
38% real price corrections on the first two, solid 50% real correction on the previous, and recently between a 23 and 38% real correction on this most recent.
I count this last move of shorter duration as a fib sequence due to the consolidation being now as lengthy of the move up. In my opinion, this is suggestive of a completed consolidation. Were price shortly to in turn move higher, the fib sequence would come to be extended to resemble something like the previous move such as, for example, as follows:

Such a move may well mark the top with price nearing the upper range of both the technical channel and the LGC model channel. Of course, I’m on speculative grounds here [when are we not], but there is some technical and model basis to these speculations. Also strengthening that possible 160k target is the following price fib extension target which matches the previous move as follows:

Such a possible move would slightly front run the 4 year cycle… as measured from peak to peak.
Of course, if such is the peak [and admittedly that is a big IF…. given the nature of the TA beast], naturally the reader is going to be curious as to what a subsequent cyclical correction would look like.
A Correction of a Technical as opposed to a Parabolic Top
If the whole move up were technical in nature, in the context of a maturing market, it seems to reasonable to me to suppose the correction also would be of a technical nature, i.e.; just as the peak was not so dramatic, neither should the correction be. Indeed, it may well take on the proportions more of a consolidation than a correction proper as we’ve seen in previous cycles. For the investor, this has to be a positive with the macro volatility in price reducing.
Something like the following could well play out:

Just as the cyclical rise was a lot less steep, so too should the correction be far less precipitous. While the time sequence may remain similar [a year long consolidation], the macro volatility is flattened as compared to previous cycle [this is also predicted on the model of the LGC channel where that channel is converging]. Such a macro move would also have price finding support at the previous top, which would be a significant technical development.
Of course, if price were to continue flattening, on its path toward capitalization and price discovery, the cycles themselves would have to break up to become eventually unrecognizable. Such would be the process of a maturing market.
Just to note in closing. Though some might think the price prediction here is a bit bleak - to 160k odd that back to below 100k, keep in mind a couple of things:
1] The LGC model is the most conservative one out there. It is essentially risk management [to both sides] while also long-term bullish. It can also be considered a stress test - would you be fine with price action developing this or that way. It is also ‘disinterested’ TA that looks to chart the market as opposed to marketing the chart.
2] On the time-frame of a few years out from now, it is also looking at Bitcoin prices pushing 300k… and even higher prices further out. It’s all about the timing, which suits longer-term investing just fine.
Until next time,
Stay [relatively] safe out there,
Dave the Wave.