Bitcoin and Longer-Term MACDs
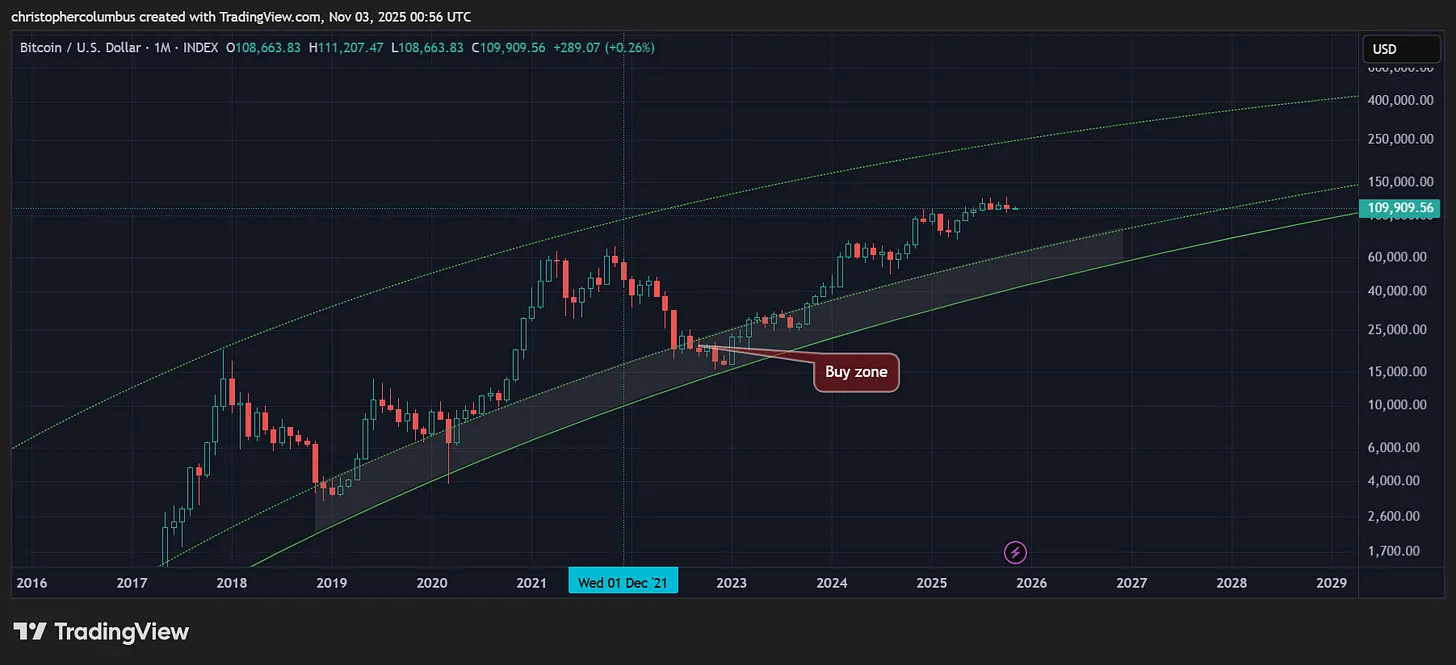
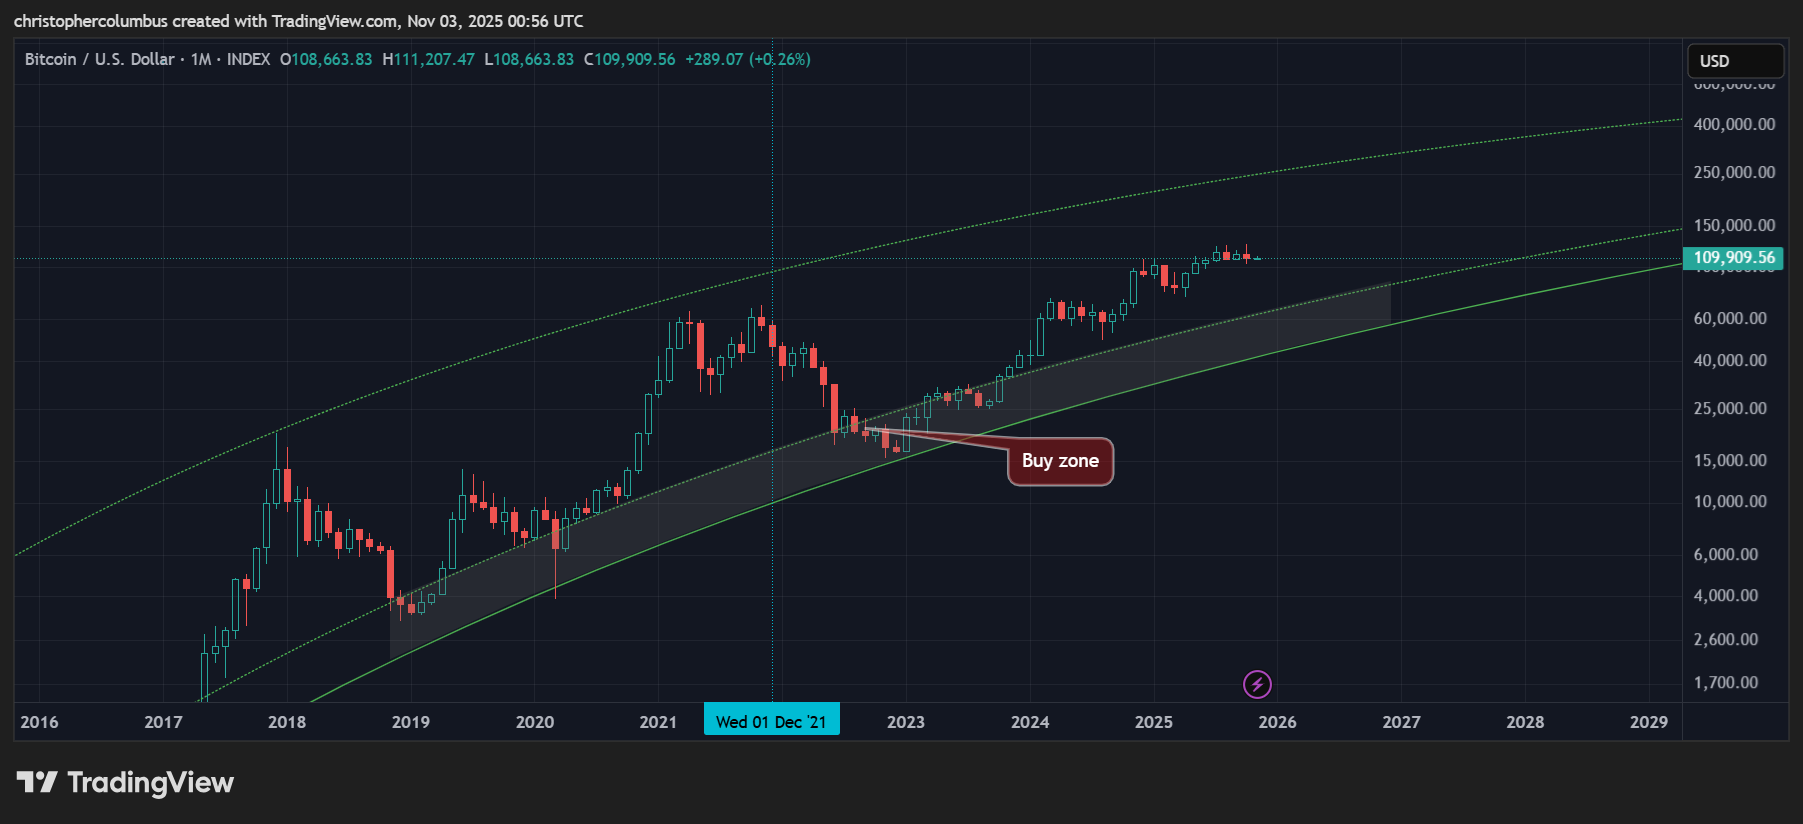
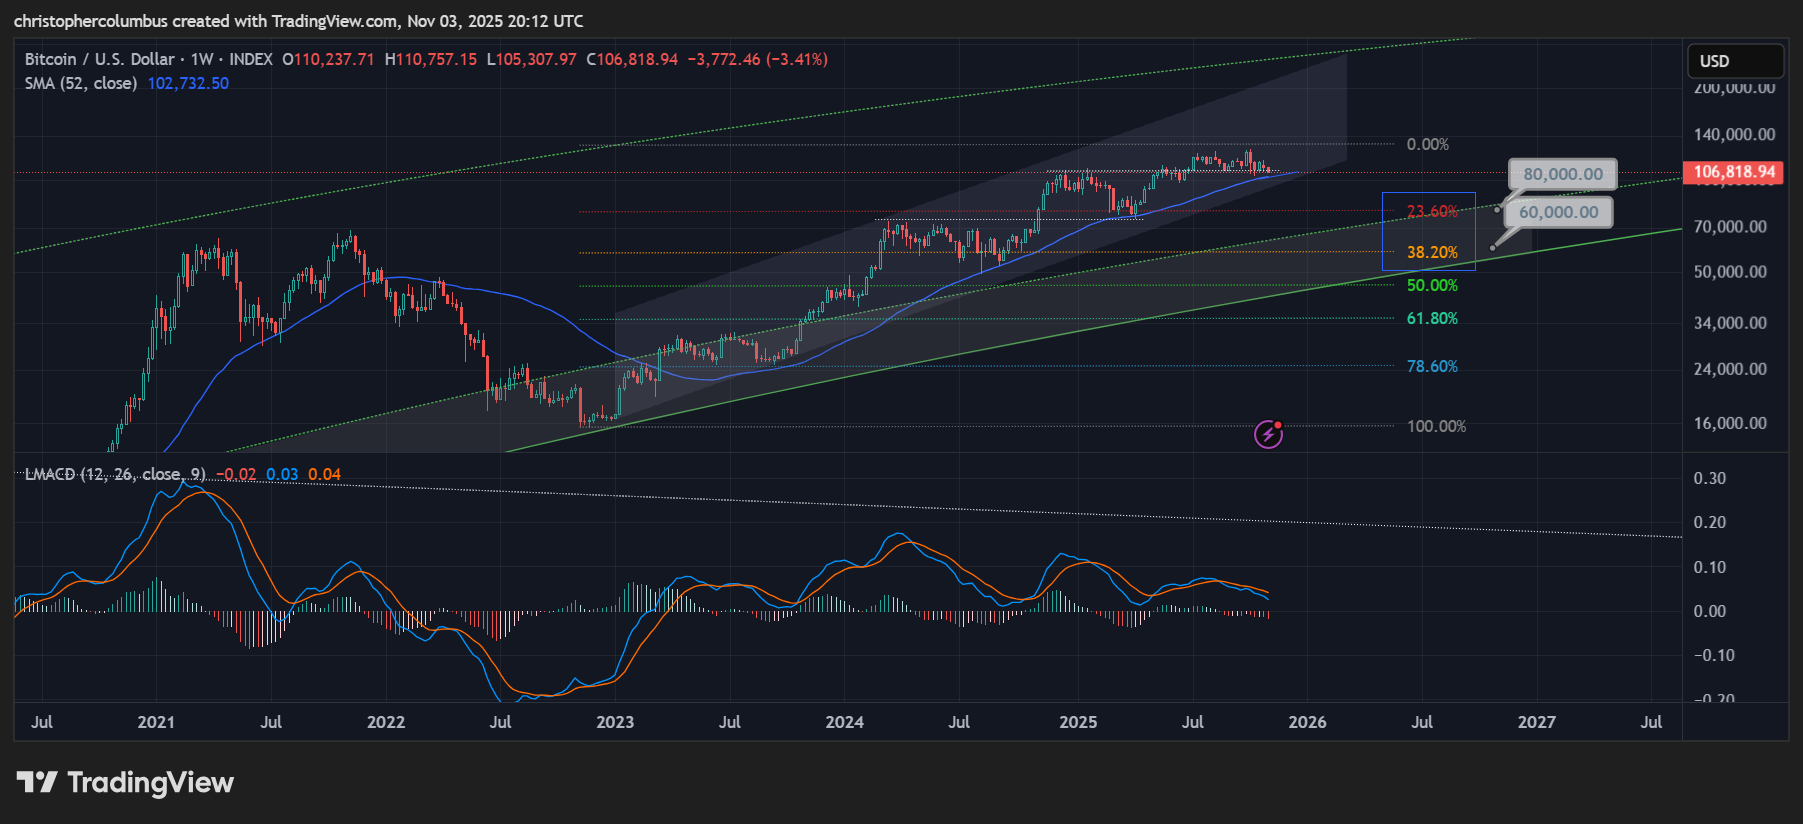
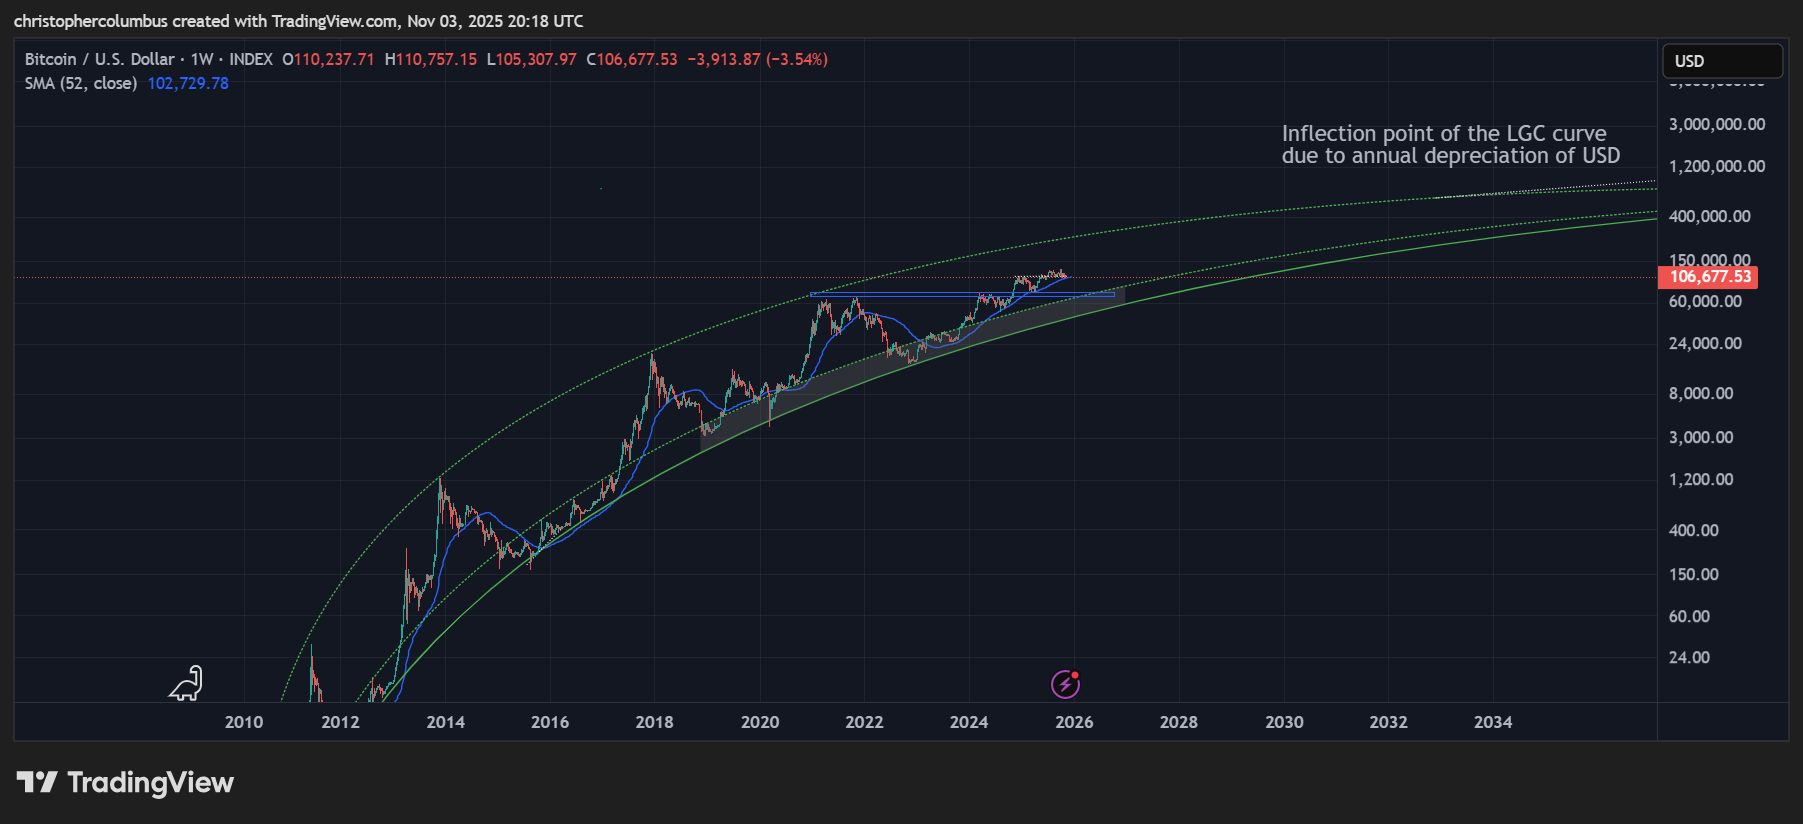
Over a coffee this morning, my niece asked me about Bitcoin. A few years back at a Christmas party, at the peak prices of 2021, her and her partner had naturally also asked about Bitcoin. My advice back then was to wait and buy the buyzone [suggesting 20K USD]… explaining the below logarithmic growth curve channel. This they did… though they decided to buy Ethereum instead [not too bad, still up 3x].
Fast forward 4 years, and now a question prompted by fear as opposed to FOMO - would Bitcoin face a year long crash in price? This article will expand on the response I gave her to that question. But first that response in a nutshell:
“The current concern is undoubtedly tied to the notion [indeed bias] that retail and social media has for the 4-year cycle - the cycle is long in the tooth, price is wavering and seeming to run out of momentum… could it stall and a free-fall in prices ensue for a year? While this obviously could happen, while the 4-year cycle may play out yet again, it can not be assumed. Also, the nature of this market is not parabolic any longer but more mature and technical in nature. With price midway in the channel, it would be better for the Bitcoin longer-term investor to hold… and if price did fall, say back to the buyzone, that would be an opportunity to buy”.
So much for that conversation. Now to a more technical conversation that can flesh this out somewhat by reviewing those longer-term MACDs.
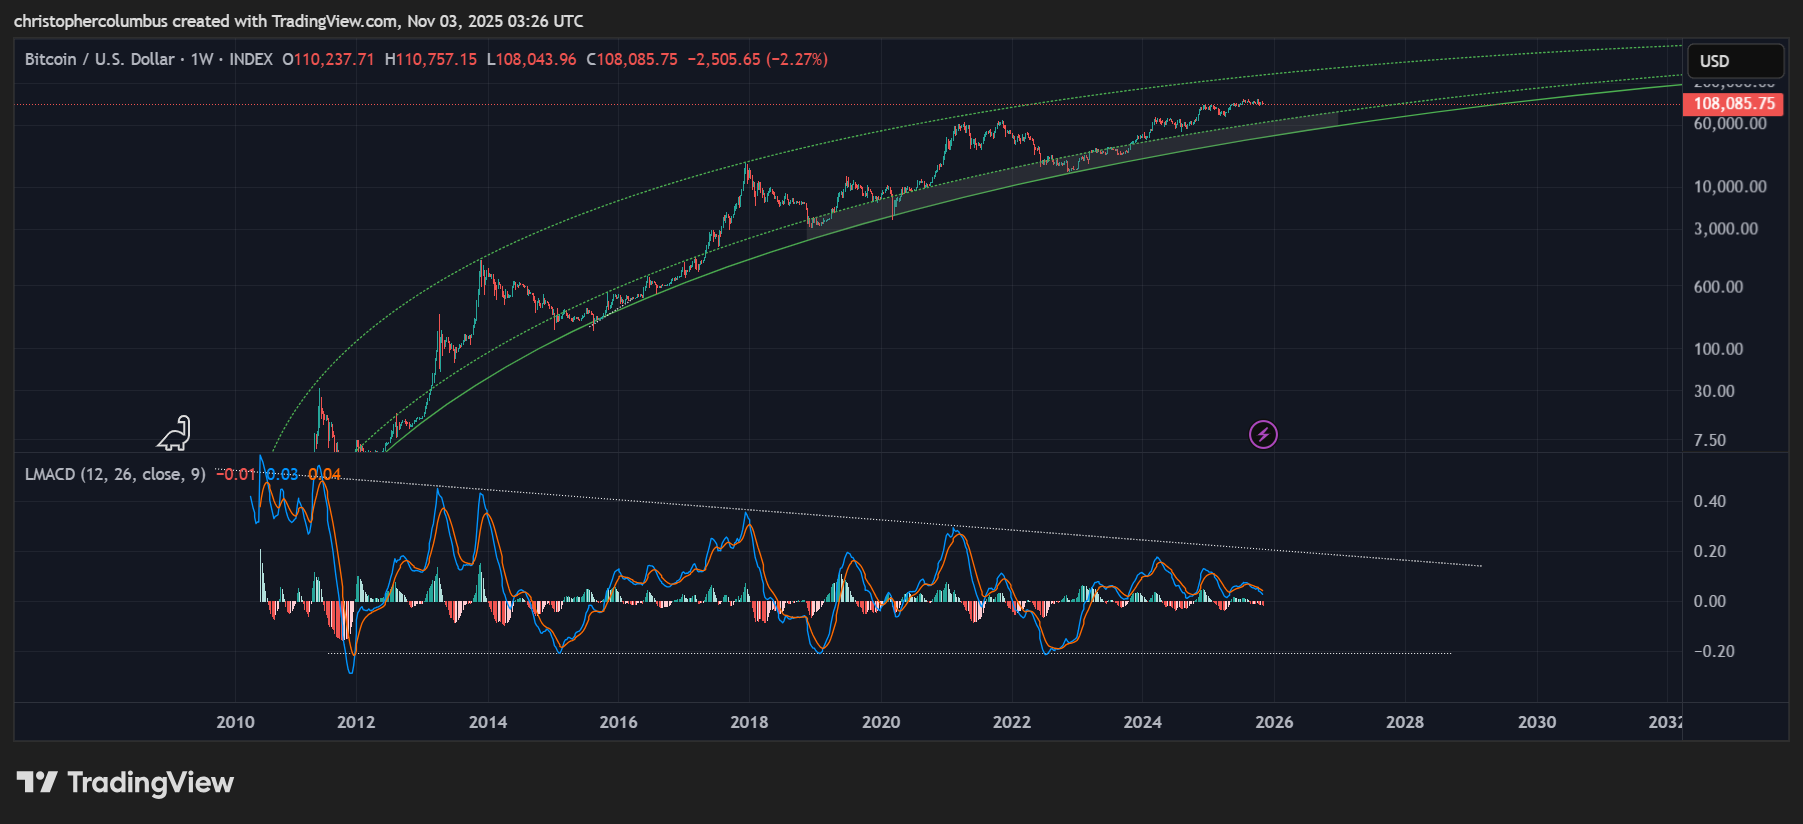
Monthly MACD
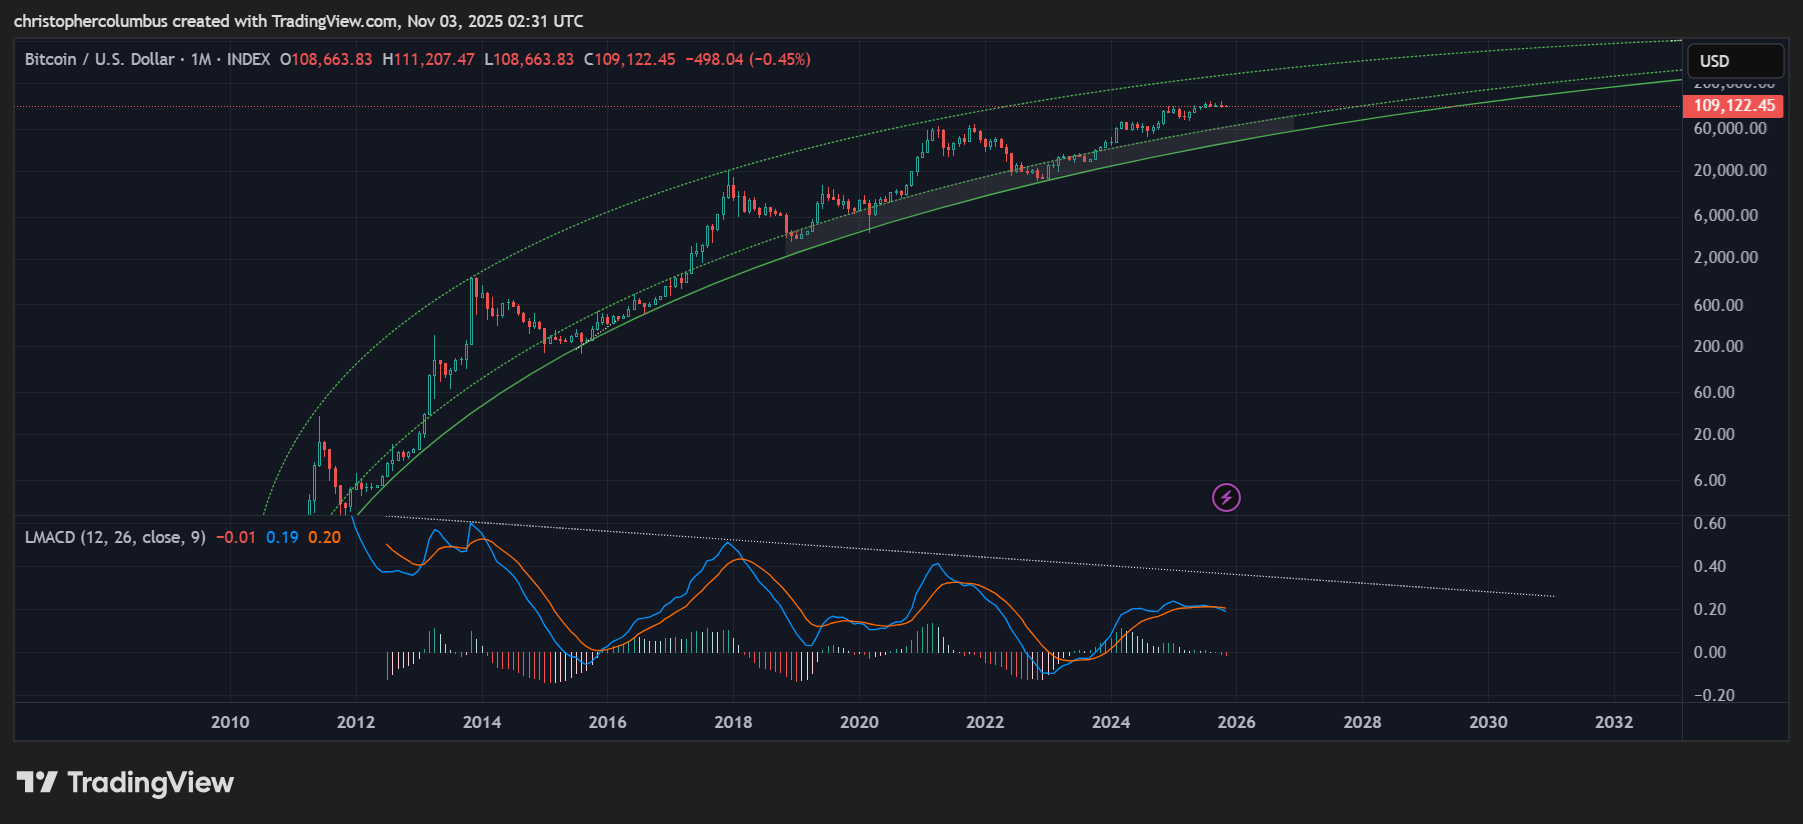
Yes, on the face of it, with the monthly MACD now crossed, it has to be of some concern given that previous crosses, with prices at the top of the channel, have led to extended downturns. The real question though is what should our degree of concern be given:
1] Prices midway in the LGC channel
2] MACD itself midway in its channel
3] A resemblance to 2020
4] Flat/ non-extended histograms
5] Maturing market/ increasing stability of price
The difficulty in using this long-term metric over multiple cycles is quite clearly seen here. It should be a given by now that diminishing returns are a real thing and that the BTC market is maturing [leading to eventual price discovery]. This will affect the price dynamic as seen for example not only in price action within the LGC channel, but so too in the monthly MACD within its own downward stabilizing trend [showing the market shift from a parabolic one to a technical one].
In my opinion, the chart above is signaling relative price stability [compared to other cycles]. It is also signaling price rolling over with a change in momentum while the MACD remains in bull territory [above the zero-line]. I think the closest MACD comparison to make here would be with 2020, where price rolls over without much extension in the histograms [and where price is midway in the channel] that come with the parabolic rise and the subsequent precipitous decline.
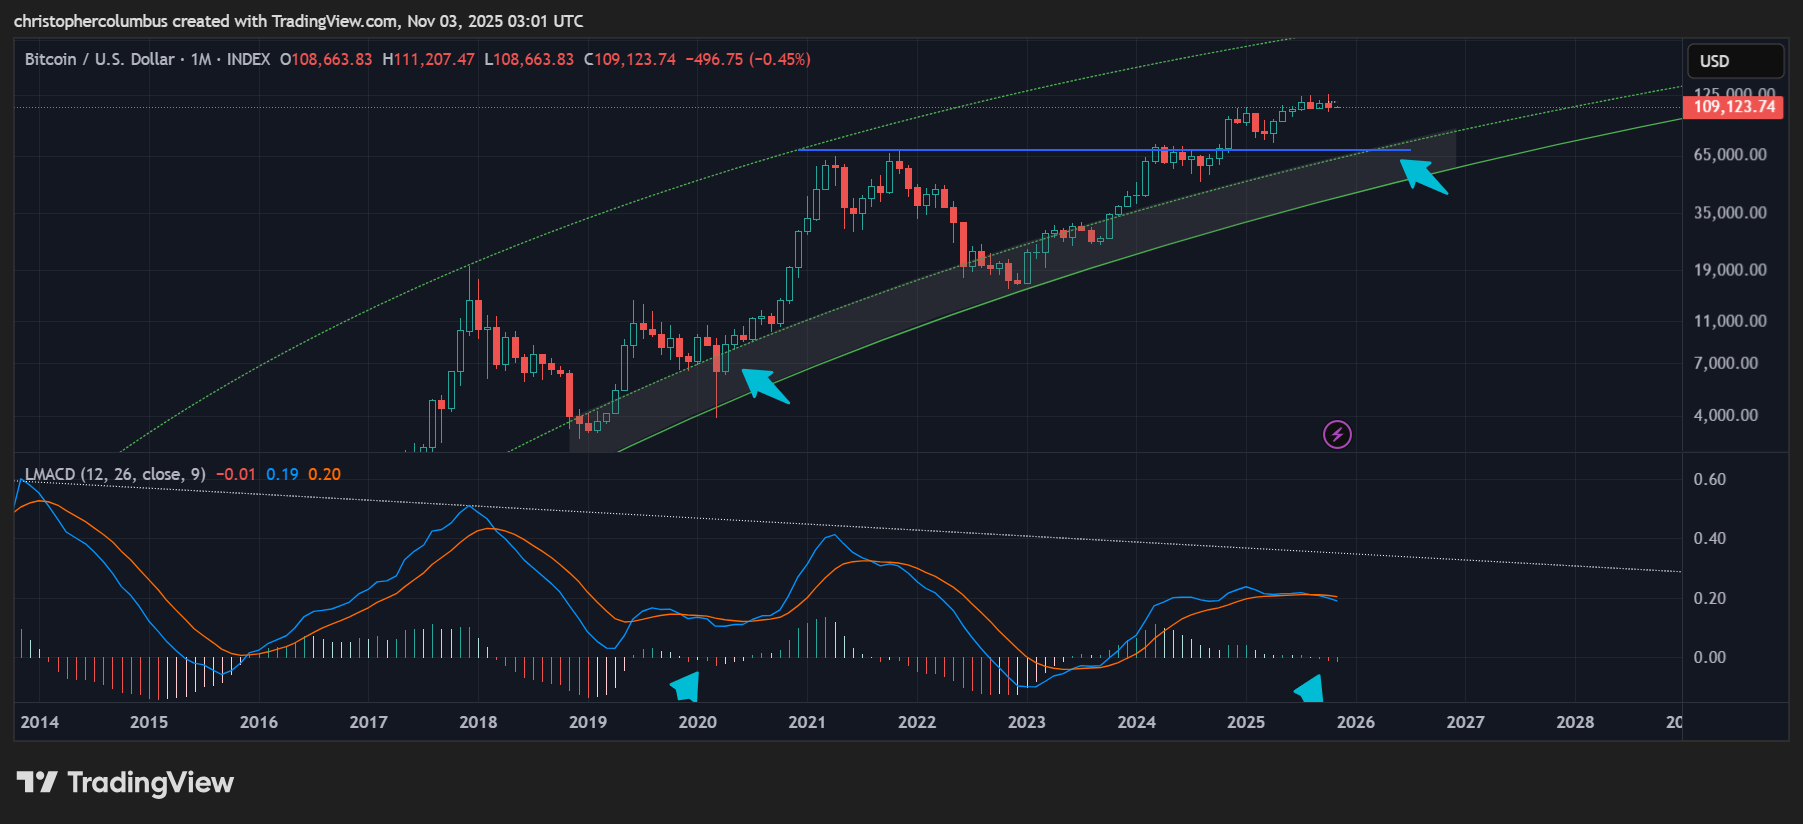
At first sight, the comparison looks scary, but when factoring in the relative price stability [that 2020 was effectively a mini-parabola and precipitous decline], it’s not so dire. On this reading, arguably a stress-test, you’d have something of a technical correction to the previous peak and back to the buyzone - 65 odd K. Must price do this? Of course not, but the boy scout and manager of risk is always prepared.
Weekly MACD
Given that BTC as an asset class has matured somewhat from its early days, the weekly MACD is arguably a more useful metric to use, for it lends itself to a more technical analysis of the recent market [past few years] that is qualititatively different to the preceding cycles [the market having matured]. Where the monthly MACD measured parabolas over various cycles, the weekly MACD measures more technical moves over the course of this cycle.
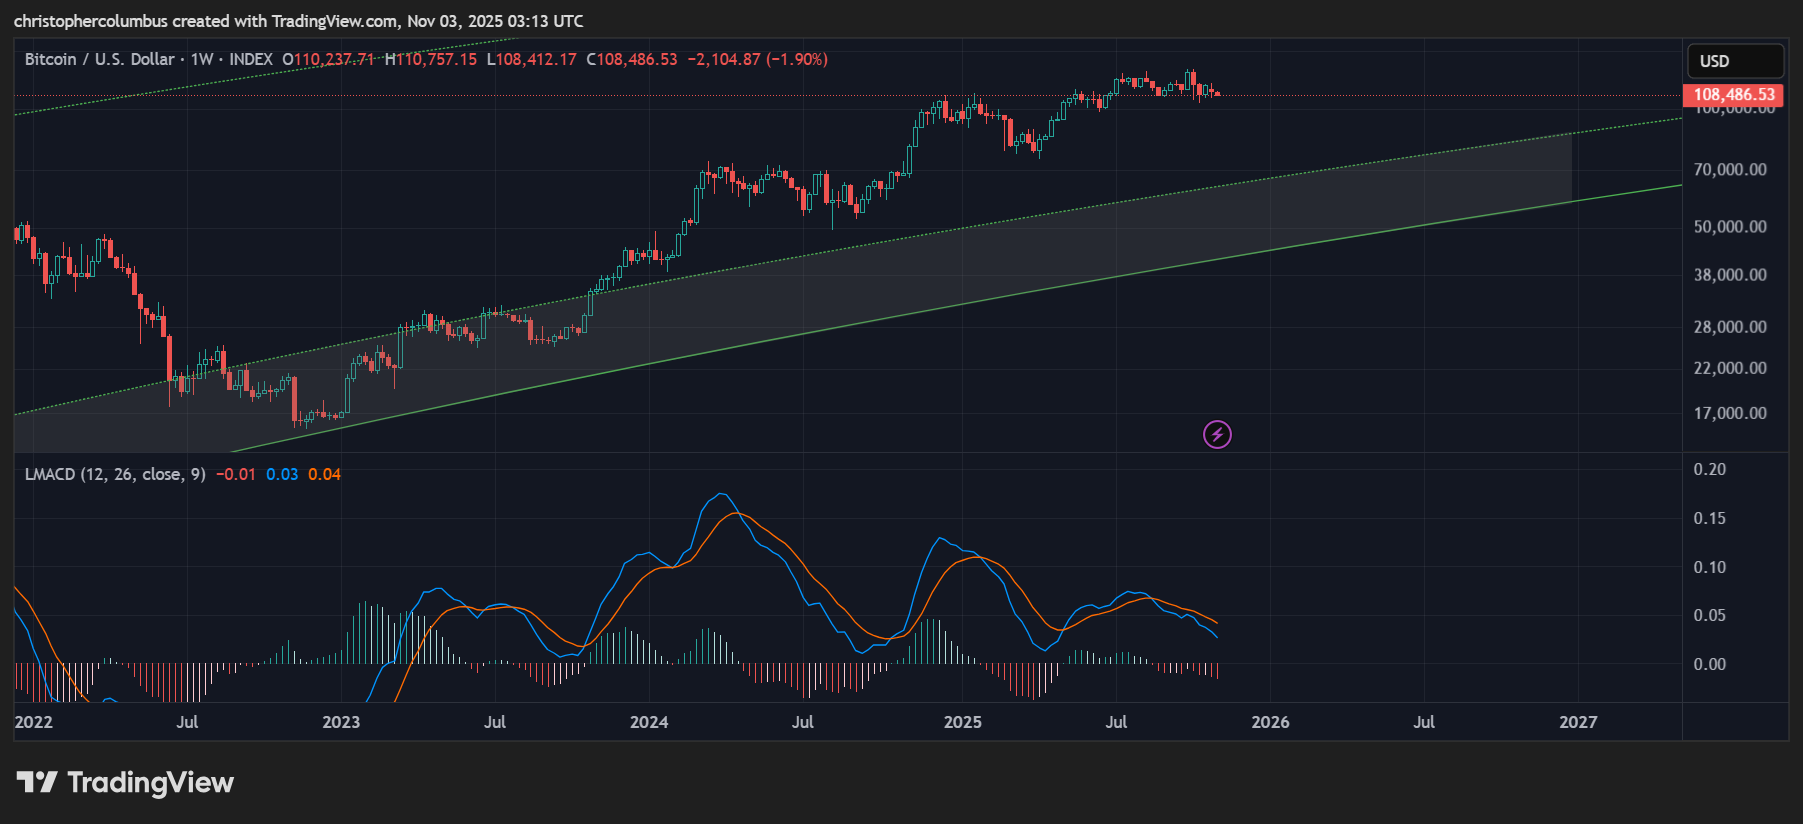
And here, on the face of it, we see what in traditional markets is a case of classic bearish divergence [prices higher, momentum lower].
The question is whether this is signaling a transition from a parabolic market to a more mature one and increasing price stability, or whether this is signaling a loss of macro momentum and a coming period of consolidation back to the buy zone.
Comparing the current weekly MACD for this cycle with cycles of the past, it looks like quite a different beast - modest move up, correction to the base line, followed by a more modest move. No parabolas.
Summary
Given that TA cannot tell the future, cannot definitively say whether we’ll see a renewed push to the upside or a prolonged correction… or even something in between, we are instead forced to manage our risk, for TA should be seen as the management of risk and risk to both sides.
Of course, if you’re a longer-term investor with a core position [not over-exposed or leveraged], the risk here in my opinion is limited - a technical correction of a technical move up, and then a future move up to higher prices [assuming the LGC model, which shows BTC in the process of capitalization].
Technical Summary
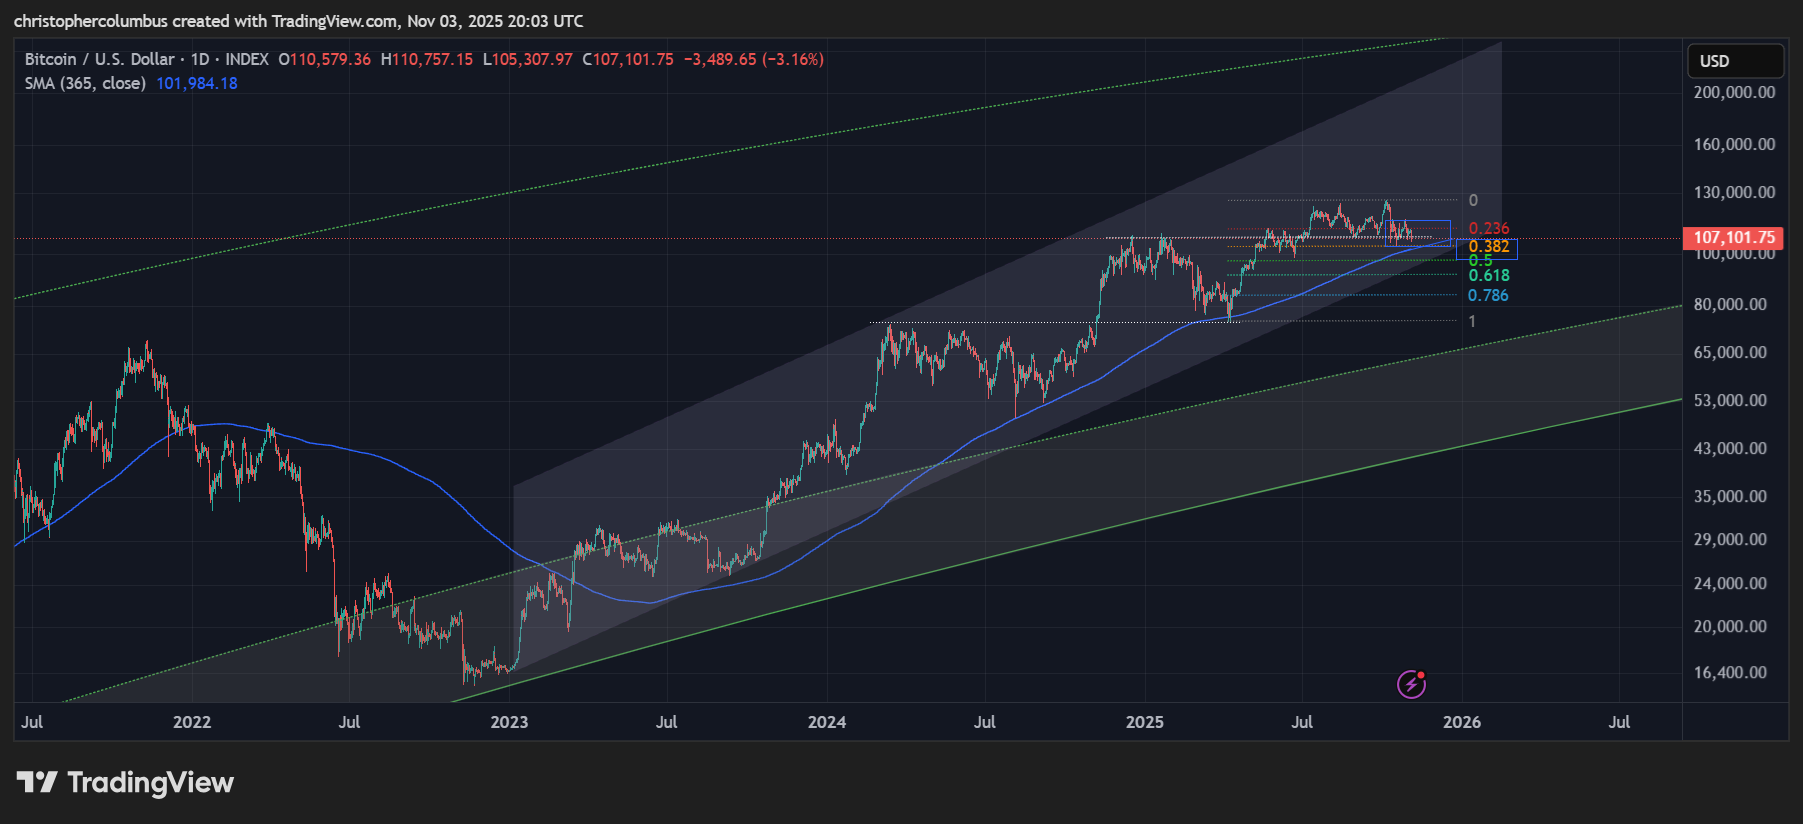
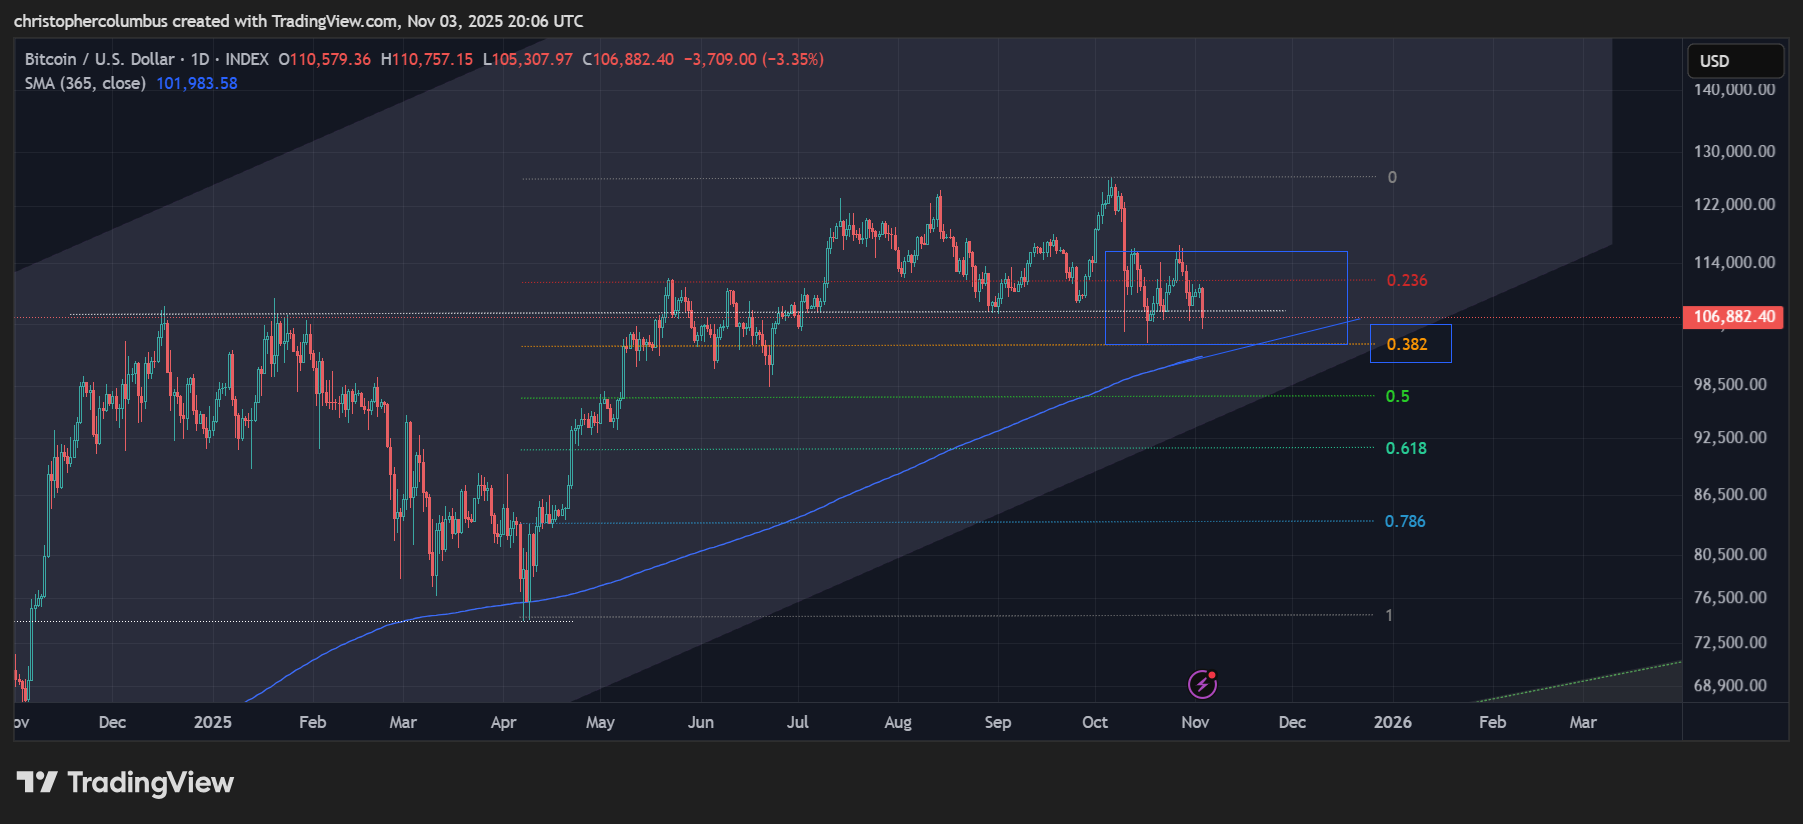
A remarkably stable price structure at the current elevated prices. Because this is something so novel to the history of the BTC market, it is creating some anxiety… but keep in mind, bull markets like to climb a wall of worry. The crucial metric to have in mind here is the 1 year moving average, which is currently 100K.
A current real 38% correction of the recent multi-month move up, where price is now oscillating in a 10% range.
It has to be recognised that while not definitive ,the bearish divergence on the weekly MACD adds a degree of concern.
Stress-test: IF the market were to roll over here and into an extended correction, that correction would be less precipitous and more technical in my opinion… due to the technical less parabolic nature of this current market.
Price back to the buyzone [between a 23 and 38% real correction of the entire multi-year ascent] would see price back to somewhere between 80 and 60K. From there it would steadily head back up again based on the logic of the LGC channel, the predictions of which have held good since 2018.
Until next time,
Stay [relatively] safe out there,
Dave the Wave.