
BTC: A Macro Blueprint and a Technical Scenario
Dear Readers,

There have been many milestones achieved in the history of Bitcoin’s price, and one way of seeing this is to take note at which an extra zero is added to the price, of where it reaches and then holds a 10x rise.
In what follows I’ll first look to outline the macro blueprint for sustainable six figure prices in the long-term, and then look to sketch a technical scenario for an initial achievement of this six figure price in the more medium term.
A Macro Blue-Print
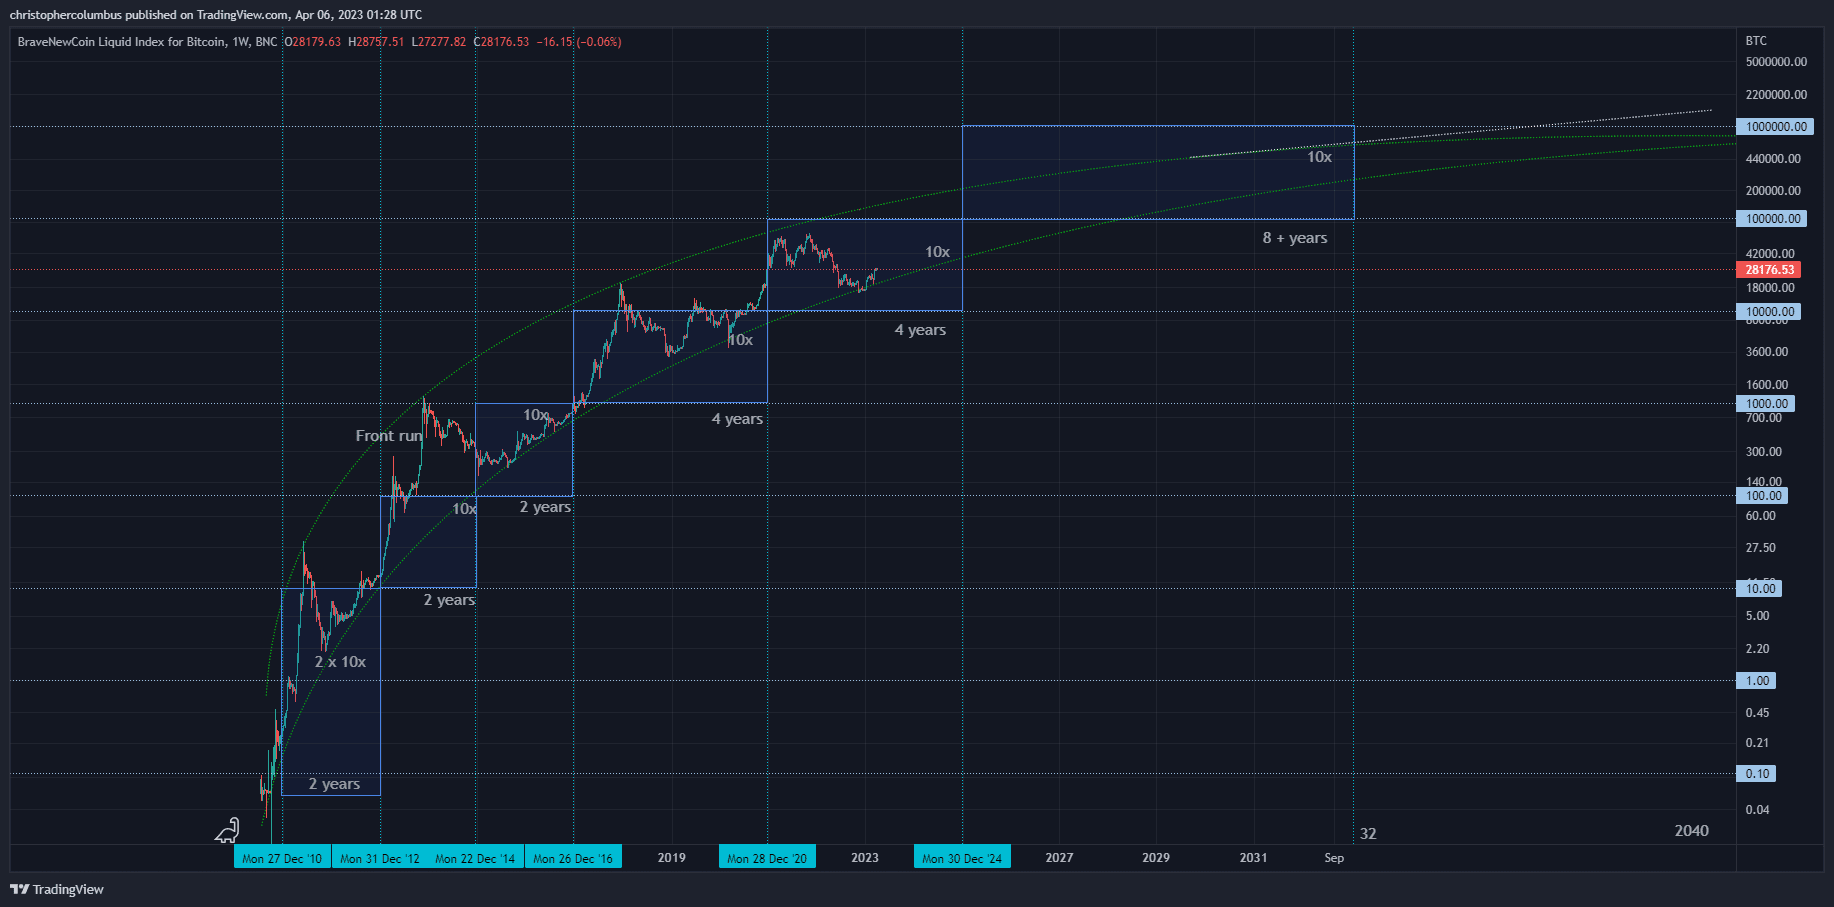
As can be seen in the chart, the five figure price range is starting to look solid and sustainable. The question now for us longer-term investors is when can six figure prices be expected - note, and as an aside: the upper white line predicting eventual seven figure prices is due to an inflection point in the LGC curve itself, due to USD’s compounding annual rate of depreciation as covered here . That said the LGC, in USD terms, should continue to be relevant as a predicter of price for a good few years yet, that is, while prices continue to rise exponentially.
Coming back to our topic of six figure prices, it is one thing to see a brief spike to that level, and quite another to see those prices as sustainable. The trader is more interested in the first, and the investor the second. With the blueprint above in mind, sustainable six figure prices are looking more likely to be a couple of years away yet. Also keep in mind, given the radical volatility of Bitcoin price, and its tendency to ‘front-run’ price, this does not preclude the possibility of a price spike to six figures before this time-frame. The question is whether that six figure is likely to be sustainable over the longer-term.
Looking at the following chart, the reader may be wondering why there is projected such a radical drop, where there is effectively a 100x over our current 8 year period - representing by 10x followed on by another 10x over the two four year periods - to be itself followed on by only a projected 10x over the subsequent 8 year period. This has to do with the nature of the logarithmic growth curve, where prices are projected to increasingly plateau at the top. This is also seen clearly in the following chart, where the vertical axis is divided into fib sections that represent the projected development of the log curve, in terms of real logarithmic values.
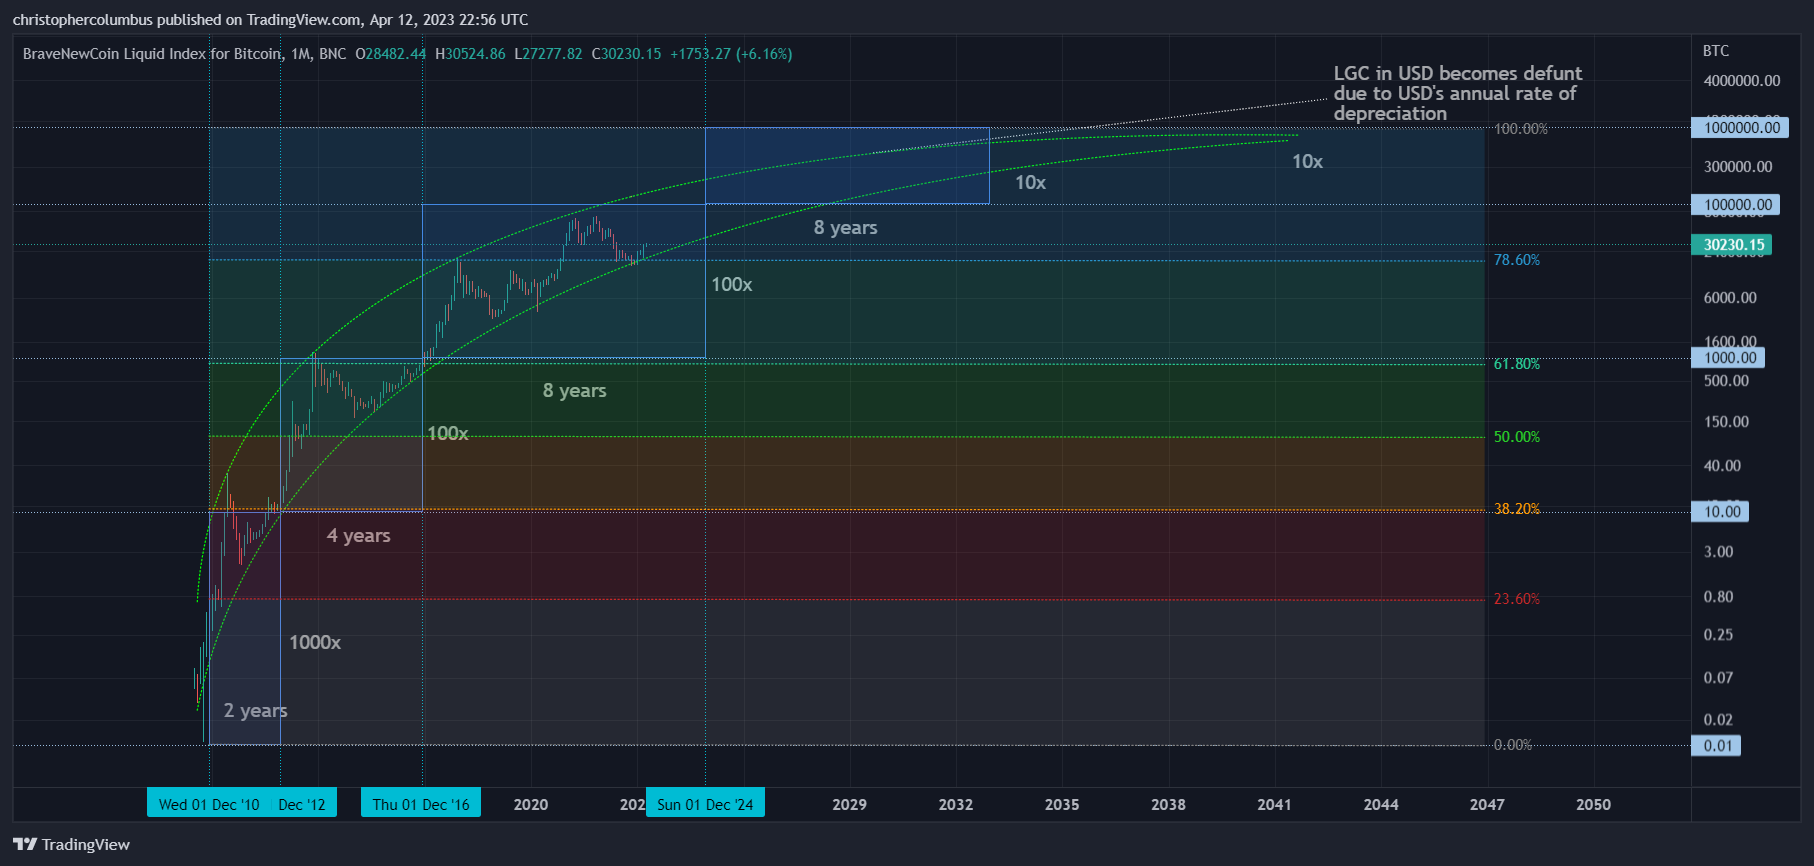
As can be seen, much of the middle bulk of the log curve is achieved in the first eight year period as relative to the second period. Indeed, the first period consumes one and a half fib levels compared to half a fib level - the last - of the second and subsequent period. One can also see that the bulk and middle of the curve is described by those two periods of 100x rises - the first involving four years, the second eight years.
This leaves the first and last periods, the shortest and longest in log growth terms, where the first involved incredibly exponential and explosive growth, and the last where that growth begins to plateau. Such is the nature of the curve, and a currency in the process of capitalization, of which the log curve provides a model for price development.
Having explored the macro blue-print on the longer-term time-frame, time now to turn to a consideration of price development in the shorter-term, or should I say on the more medium-term time-frame, which is to consider a likely technical scenario that might make sense within this macro outlook.
A Technical Scenario
It is all very well to have a grand over-riding hypothesis that can orientate us toward the longer-term, but we are naturally also going to be curious about the likely trend of price development in the medium-term… with short-term volatility being left on the sidelines as the most random and more unpredictable.
Where we move from the longest term outlook of the macro, the model, to the medium-term of a more technical scenario, we also move to a lesser degree of probability as to those more particular predictions in my opinion. Nevertheless, as speculators, this is what we do. An excerpt from a previous article -
If time were to be placed on a spectrum, with the shortest of periods at one end and the longest of periods at the other, randomness and possibility would belong to the shortest periods, while pattern and probability would belong to the longest periods. There would be varying degrees of probability/ randomness depending on what point of the spectrum you were dealing with - at the one end, minutes would be near completely random, at the other end, years would have a much higher degree of probability. Just as with any science, where momentary observations only start to make sense when accumulated into a mass over a longer period of time, so too with T.A. It applies most effectively to longer time frames, where lines might be drawn, and trends discerned.
In the more technical aspect, I’ll sketch a possible scenario that I favor at the moment. I favor this scenario - and also will hedge against it as I’m not clairvoyant - as it works in well with certain macro considerations applicable to the model of the LGC, which has so far performed remarkably well.
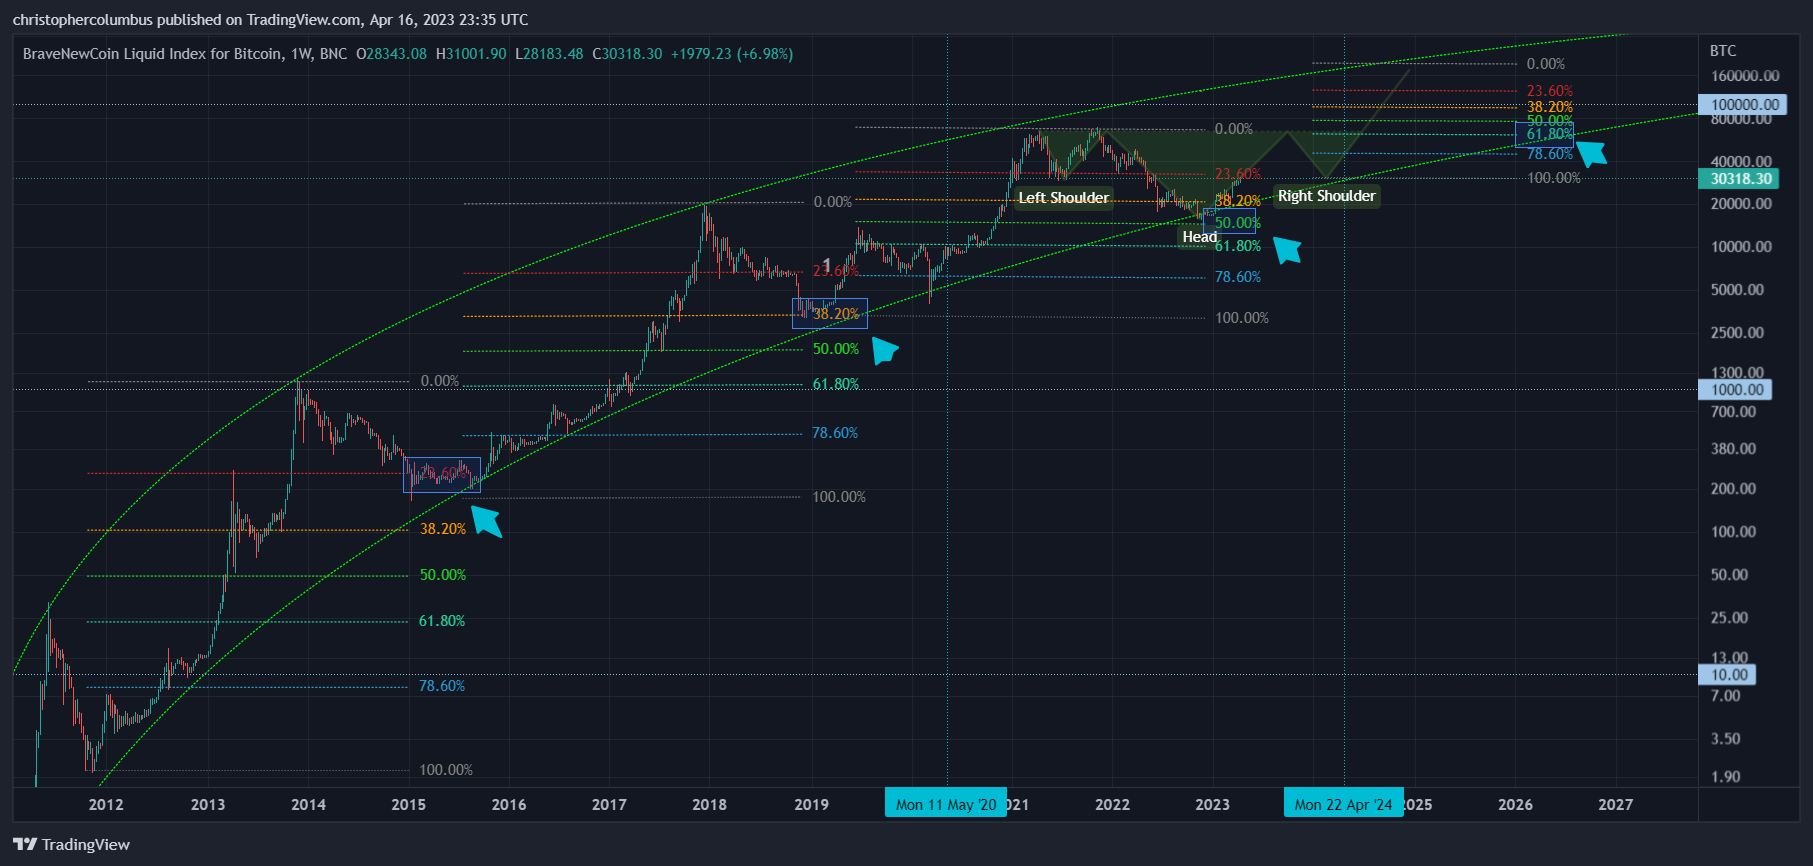
A Reverse Head and Shoulders Tying in with the Halving

What I’ve in mind here in the above chart is the possible formation of a reverse head and shoulders. Factors in favor of this scenario are an initial move up commensurate with the 2019 move, midway in the channel; resistance met at previous highs; correction back to the bottom of the curve commensurate with the left shoulder; and a final spike to the top range of the LGC curve. Admittedly, the extension on the last leg matches more the right shoulder as opposed to the full length of the head and neckline…. something that may coincide with macro considerations on the one hand, and the LGC model on the other.
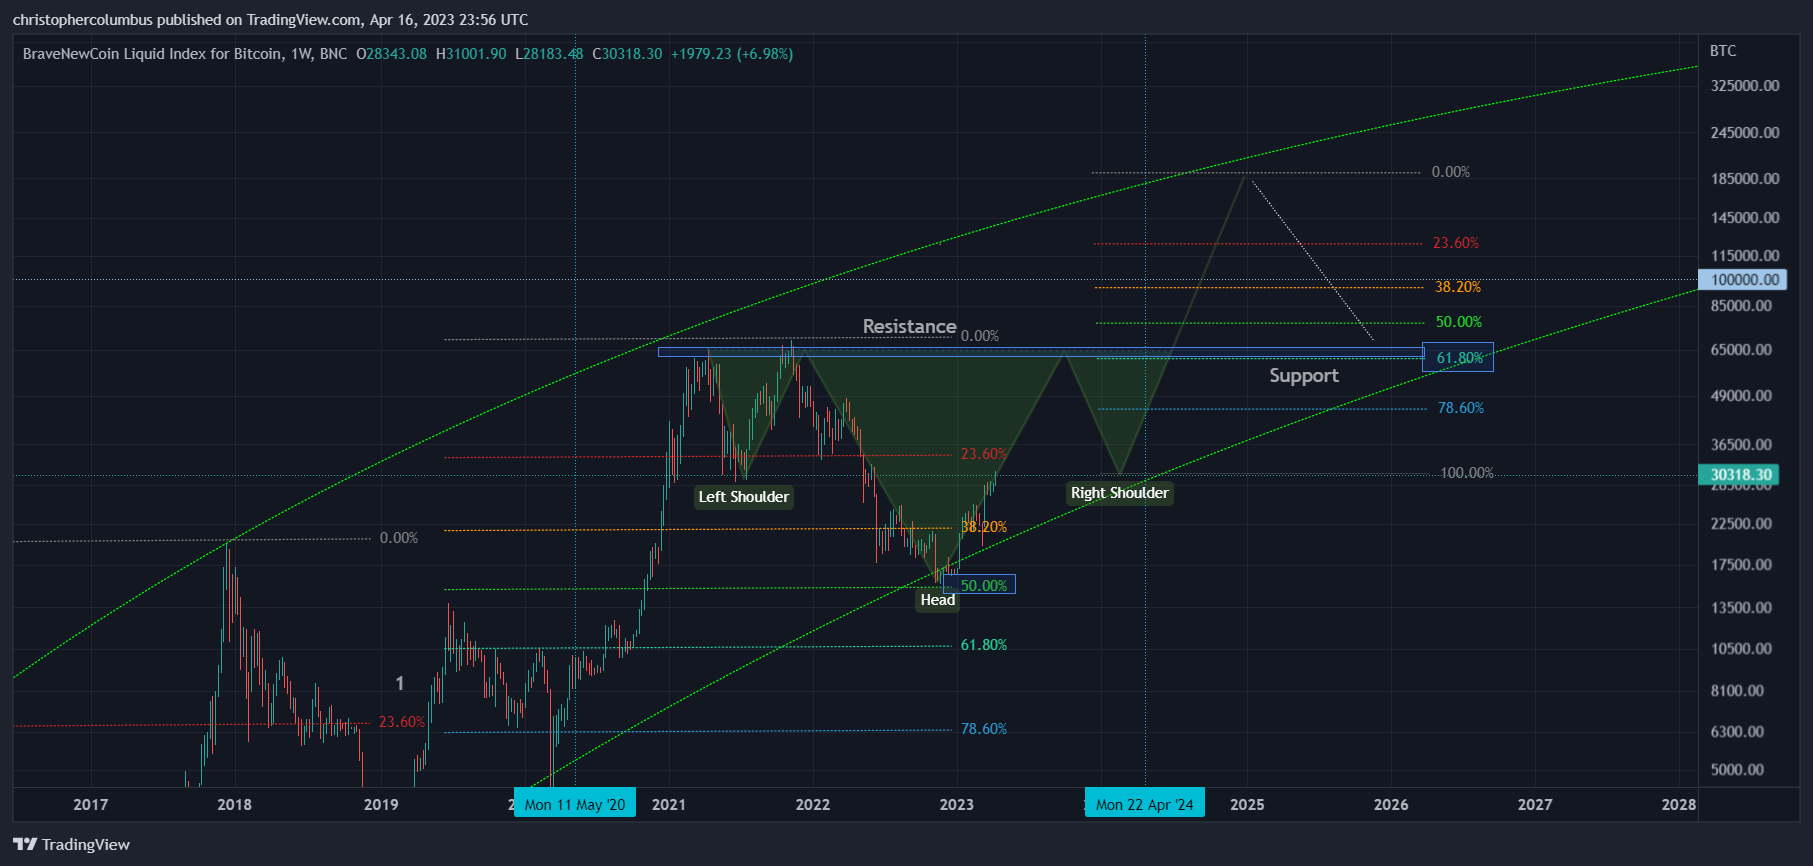
The macro factors I have in mind here, as favorable to this scenario, is the breaking up of the grand cycles into something more erratic in a more mature market - as covered previously here - and a reducing volatility in the macro. This should, along the lines of the LGC, see a process at work toward an eventual stabilized price. The macro principle at work here predicts an increasing correction in real terms of any large moves up. And so you have the sequence in the following chart, where an extra fib level is involved with each correction.
If this sequence is to hold, a further fib level would be added on a major correction from the top. For this to occur, a correction of the main move, involving a full 61% in real terms, seems more applicable to something like a shoulder subsequent to a previous correction. Also in mind here is a transition between grand cycles and a breaking up of them as was discussed in the linked article from two years back, which, incidentally, may have gone toward explaining why the ‘blow off top’ failed to materialize as was expected by most :
As speculative episodes become more frequent, so too might they become a little more restrained in their magnitude. In the aggregate, the volatility will reduce - what could be considered in this ‘cycle’ as increasing intra cyclical volatility, as relative to the previous cycle, may also be read as a breaking up of that grand cycle altogether. In contrast to this, the current ‘cycle’ could also be considered a transition of sorts - a lengthened cycle with increased intra volatility morphing into what comes later - something messier and defying the notion of grand cycles altogether. In this scenario, mini parabolas, of the sort seen recently, would supplant the cycle, with those mini parabolas/ manias [speculative episodes] themselves reducing in volatility. And herein would lie the road to price discovery, which is also price stabilization, mass adoption, and a nascent currency full capitalized along the lines of Gold.
A further corroborating factor for an large reverse head and shoulders pattern is that this also allows previous highs, tested a few times, to become support on the longer-term time-frame, while contributing to eventual macro price discovery on that time-frame.
To sum up, obviously the ideas explored here are not thought to be definitive, but exploratory. The idea being that something like this is a very real possibility, and so then the risk of that happening, both to the upside and downside, is taken into account in one’s trading and investing activities. For myself, I think that trading this kind of volatility can serve to function as a hedge to your investments in both major alts and Bitcoin.
As for the first discussed longer-term blue-print of price projections, where sustainable 10x increases are achieved on the basis of the LGC, this has a higher degree of probability to it than the more specific technical pattern that was outlined subsequently. Like Daedulus, we fly to speculative heights in the hope of seeing further, not to mention in getting to our destinations, financially speaking. The challenge is finding the right altitude, so to speak, and not flying too high like the overly confident and exuberant Icarus.