BTC and MACD Updates
Dear Readers,
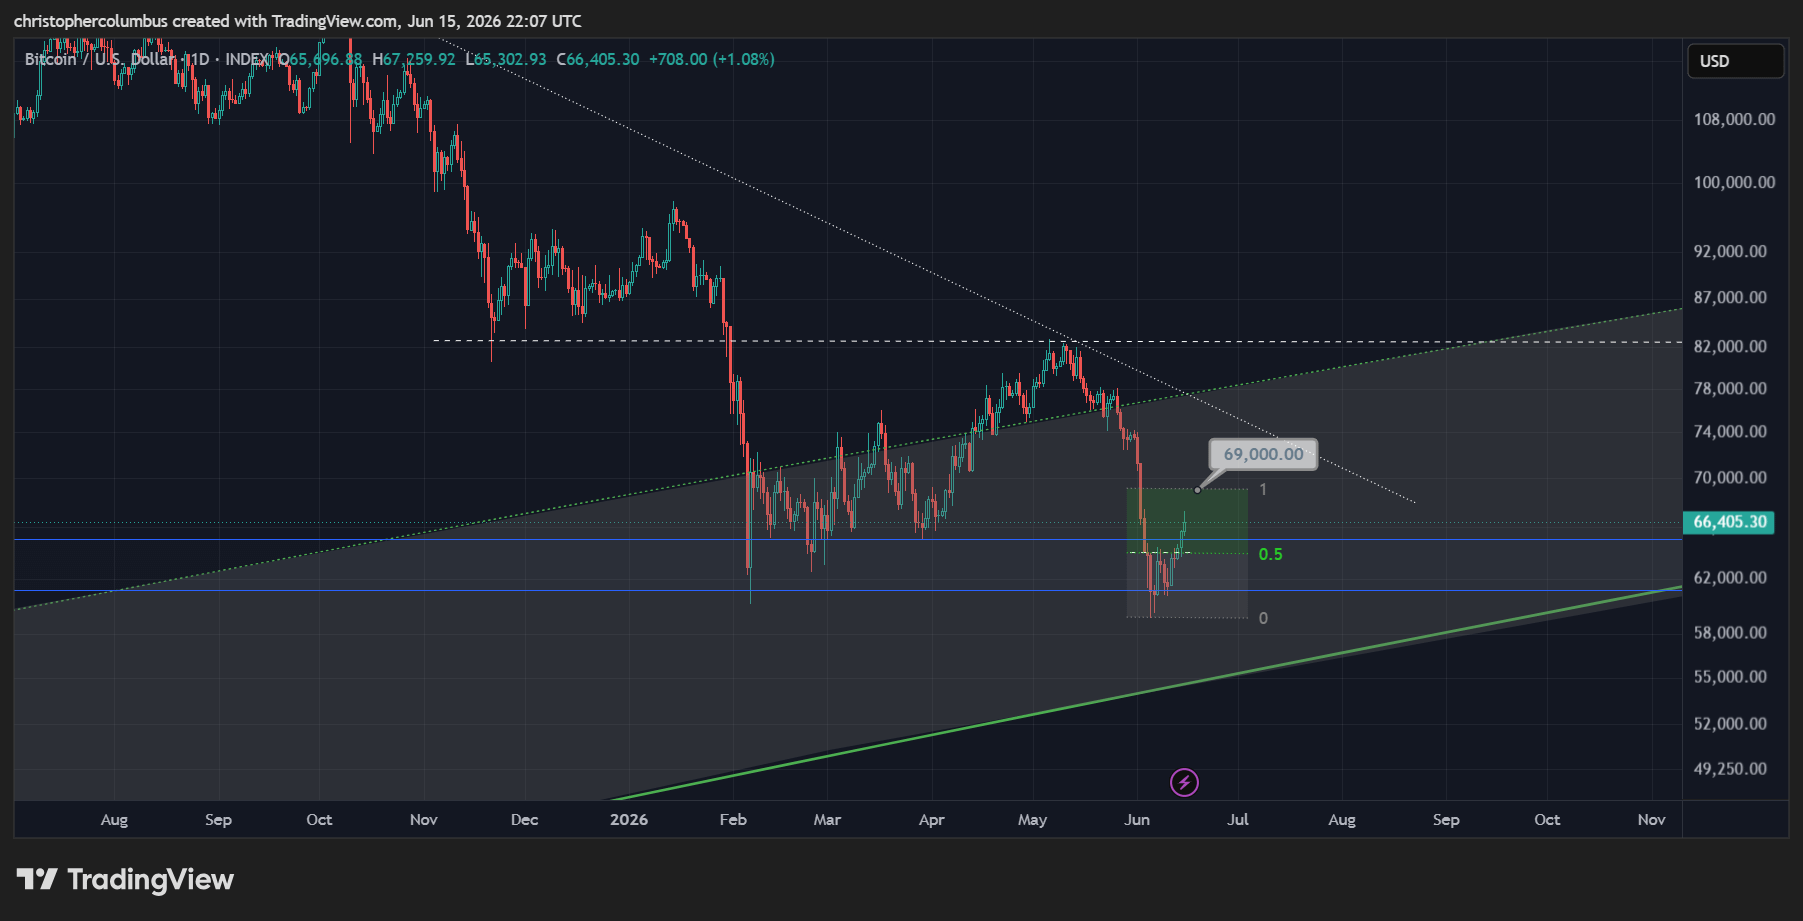
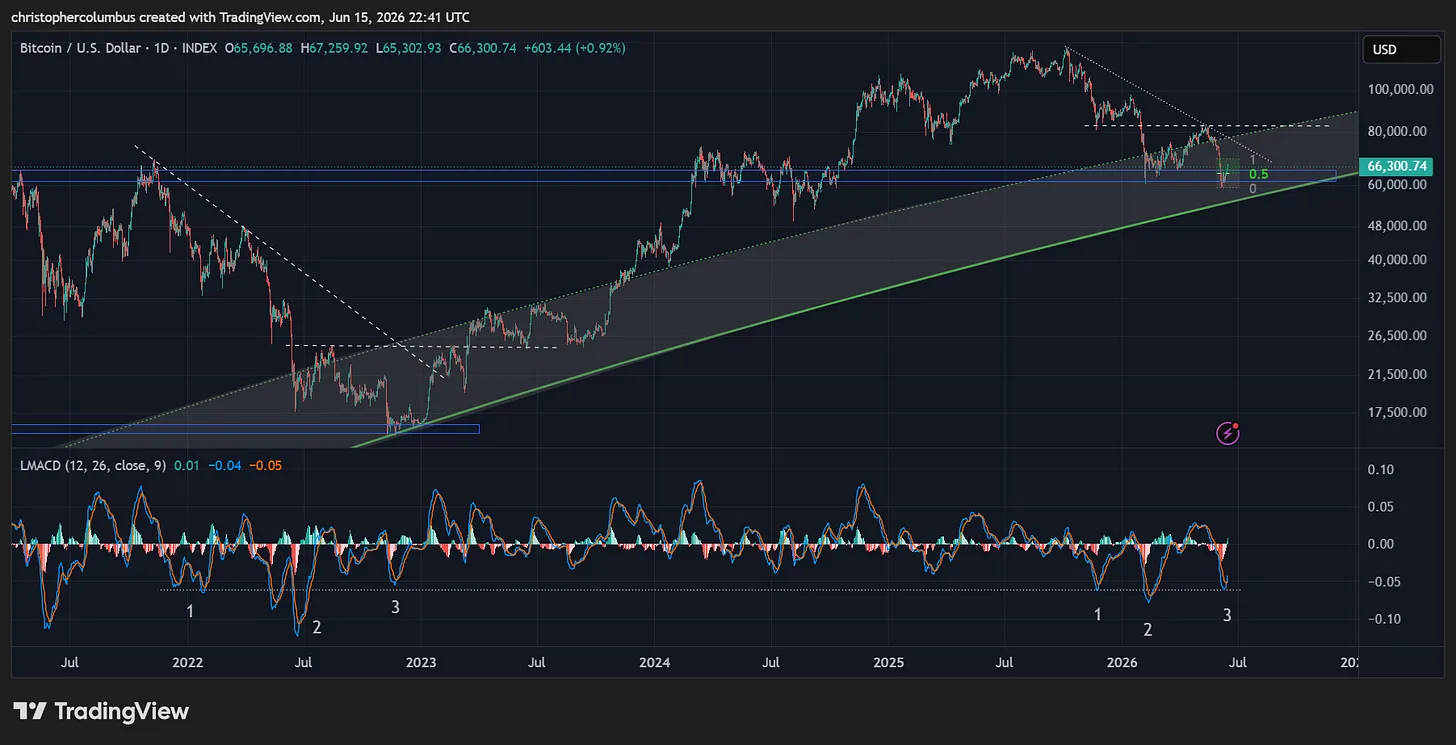
As many are no doubt familiar, short term price continues to strengthen on the bounce after the recent sell-off while also observing the technical projection as sketched on the chart some days ago now.
Price is currently situated right in the middle of the LGC ‘buy zone’ that has been on the chart, and performed well since 2018, near a decade ago now.
For this article, I thought an update of the MACDs, a major momentum indicator was due, and so first with the daily chart, which is more of a volatility indicator in my opinion.
Daily MACD
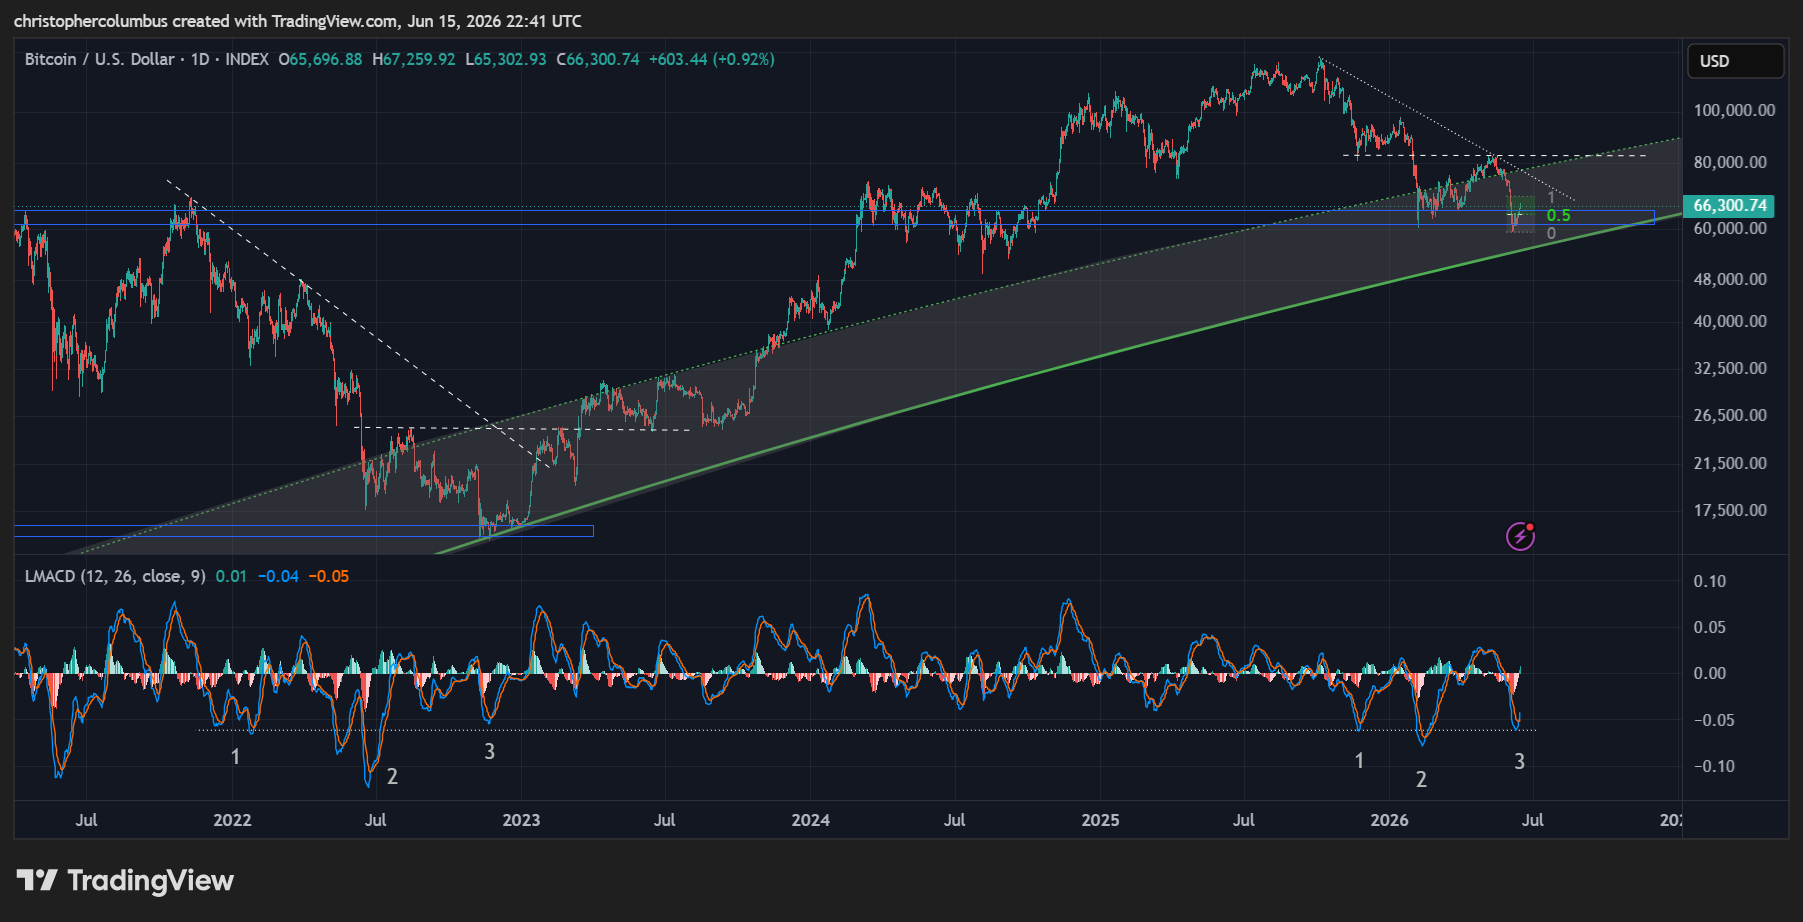
Though I usually focus more on the weekly MACD, I find this chart of interest. To find the daily MACD so low as recently, we have to go all the way back to the major cyclical correction of 2022. This suggests that we are likewise repeating that pattern. Also of interest is the three swings lower in the course of that correction… something we see mirrored here in 2026, and more concisely in a more mature market. If the pattern continues to play out, the bottom is in.
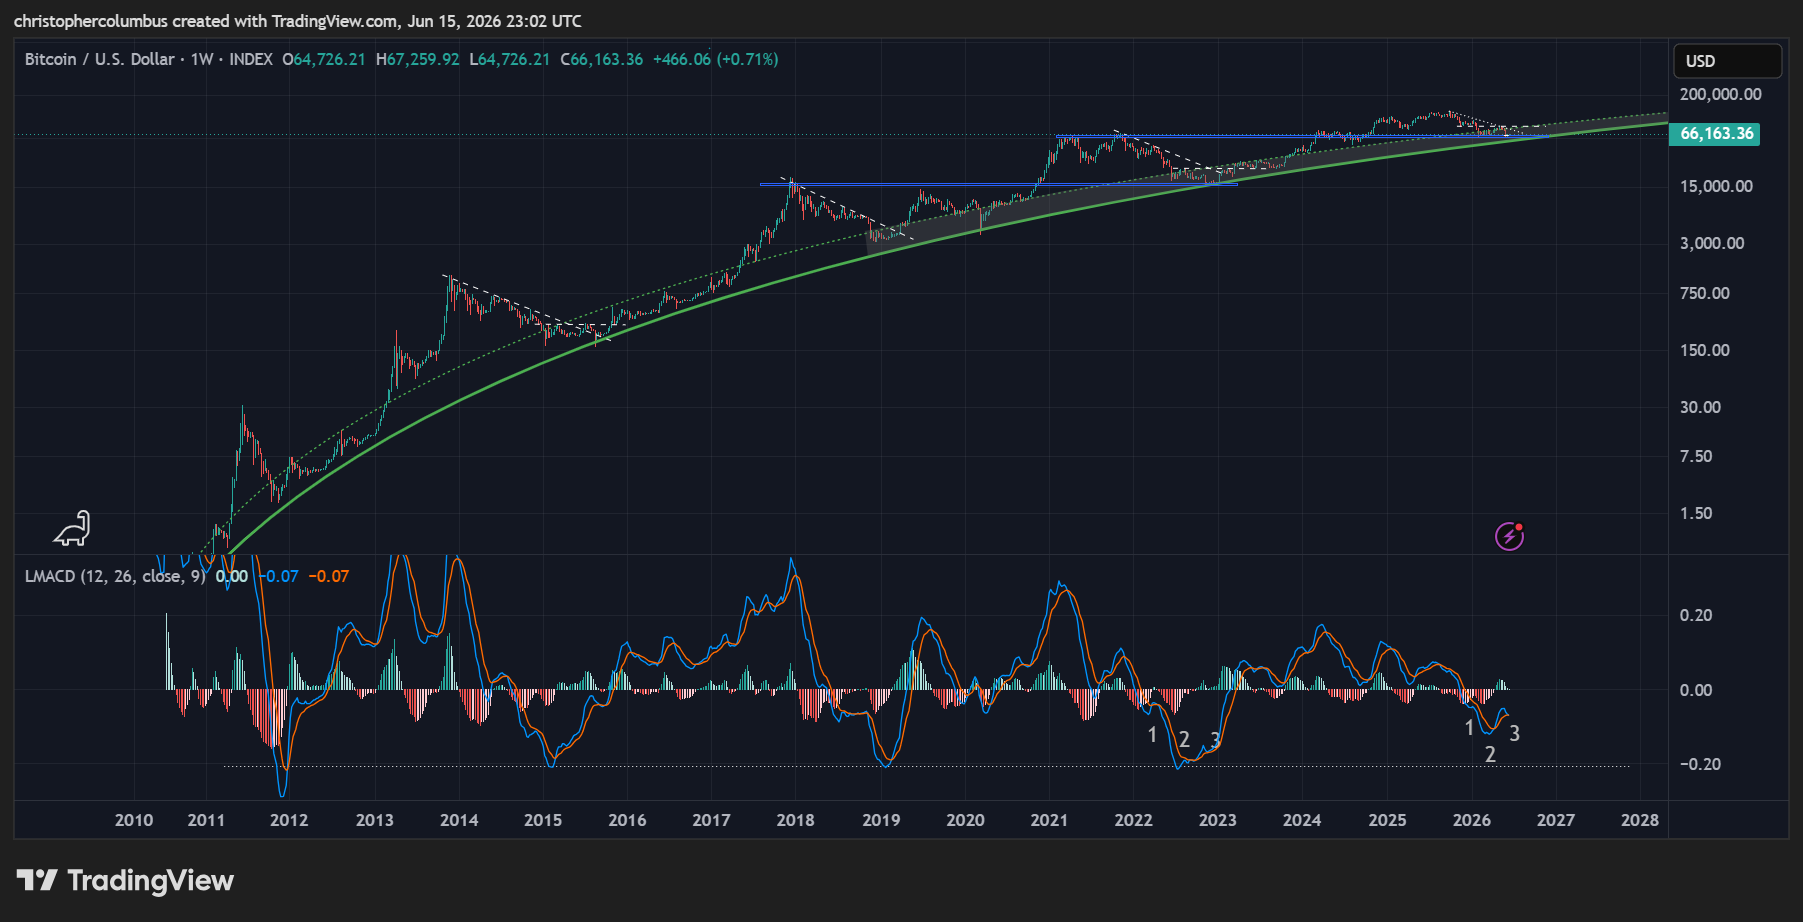
Weekly MACD
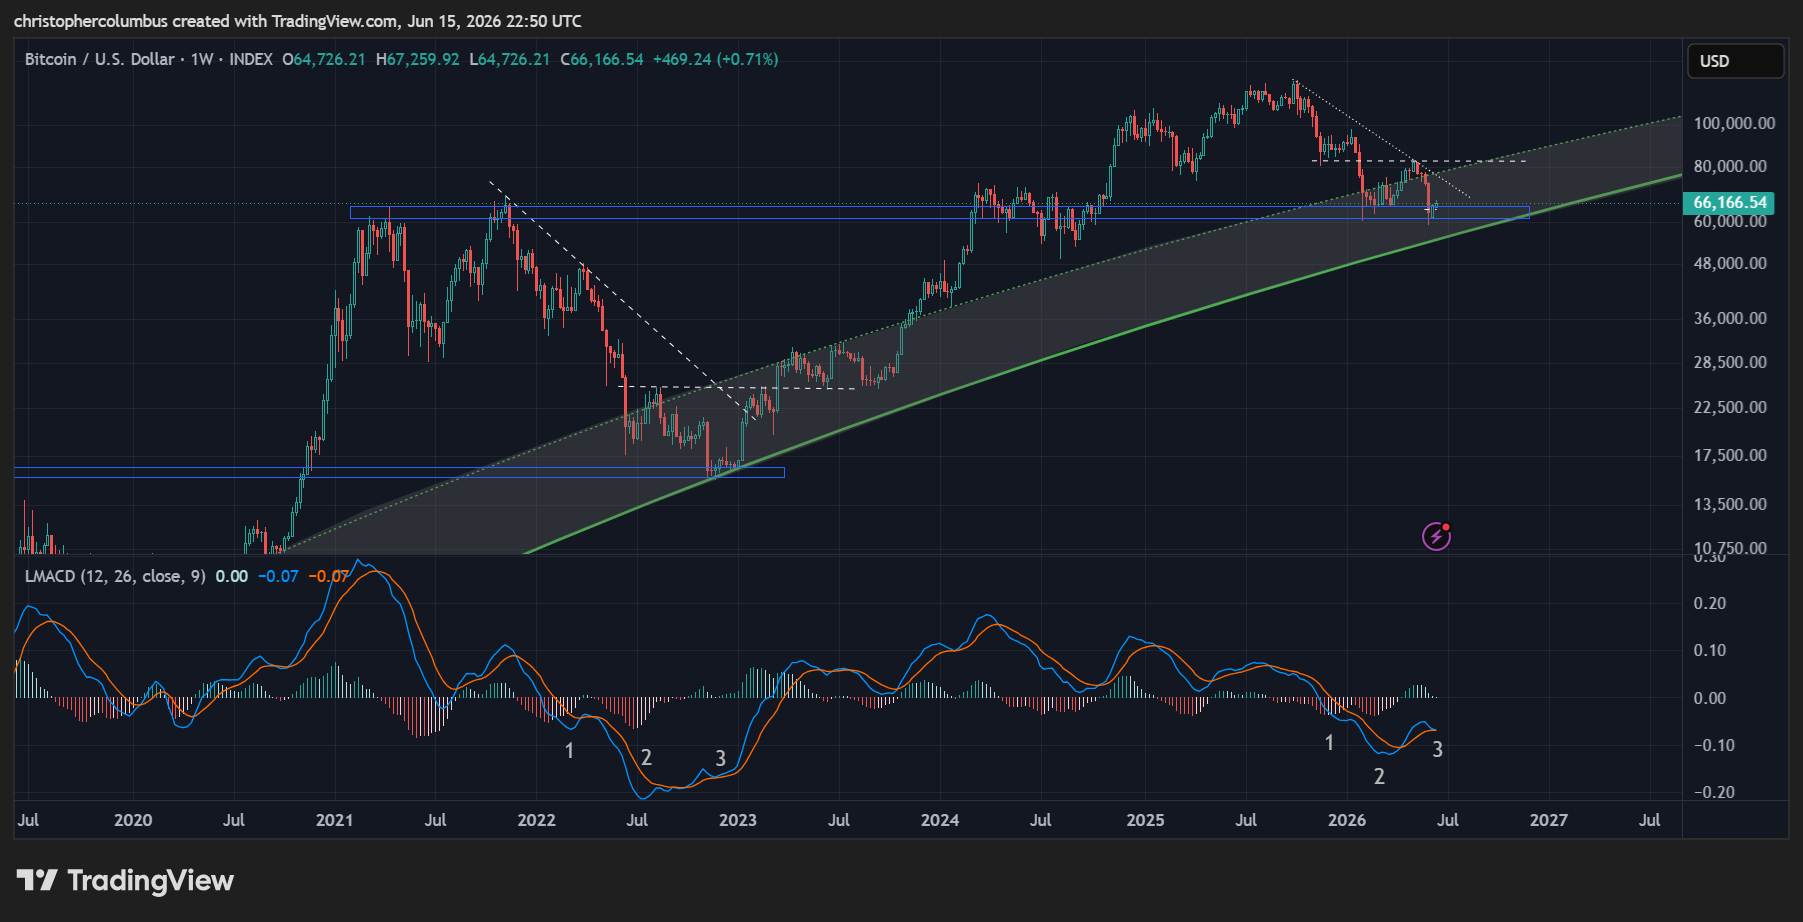
On the weekly chart, we see the same pattern in a more subdued manner, once again signaling a maturing more technical market in my opinion.
The MACD here does not reach as low due to reducing macro volatility in price, or, in other words, increasing price stability. Keep in mind that along the lines of the LGC model [Logarithmic Growth Curve], a process of price discovery is unfolding. In this scenario, overall price increase while remaining volatile to both sides, will itself increasingly plateau as BTC [an alternative currency/ digital gold] is capitalized by the market. This eventual price discovery/ capitalization is also why the MACD on higher time frames should not swing as high or low. The chart above is so far confiming the theory/ prediction. The theory has performed.
But Dave. you say, what about when you zoom out on the weekly chart? Has not the weekly MACD reached the same depth on previous cycles?
My reply to this, and as an explanation, is that previous cycles were parabolic ones whereas this cycle is a mature technical one - just as price lacked the parabolic spike, so too it will lack the absolute capitulation of previous cycles [this is why the top line of the LGC channel is also no longer relevant in my opinion.. it related to parabolic spikes].
Monthly MACD
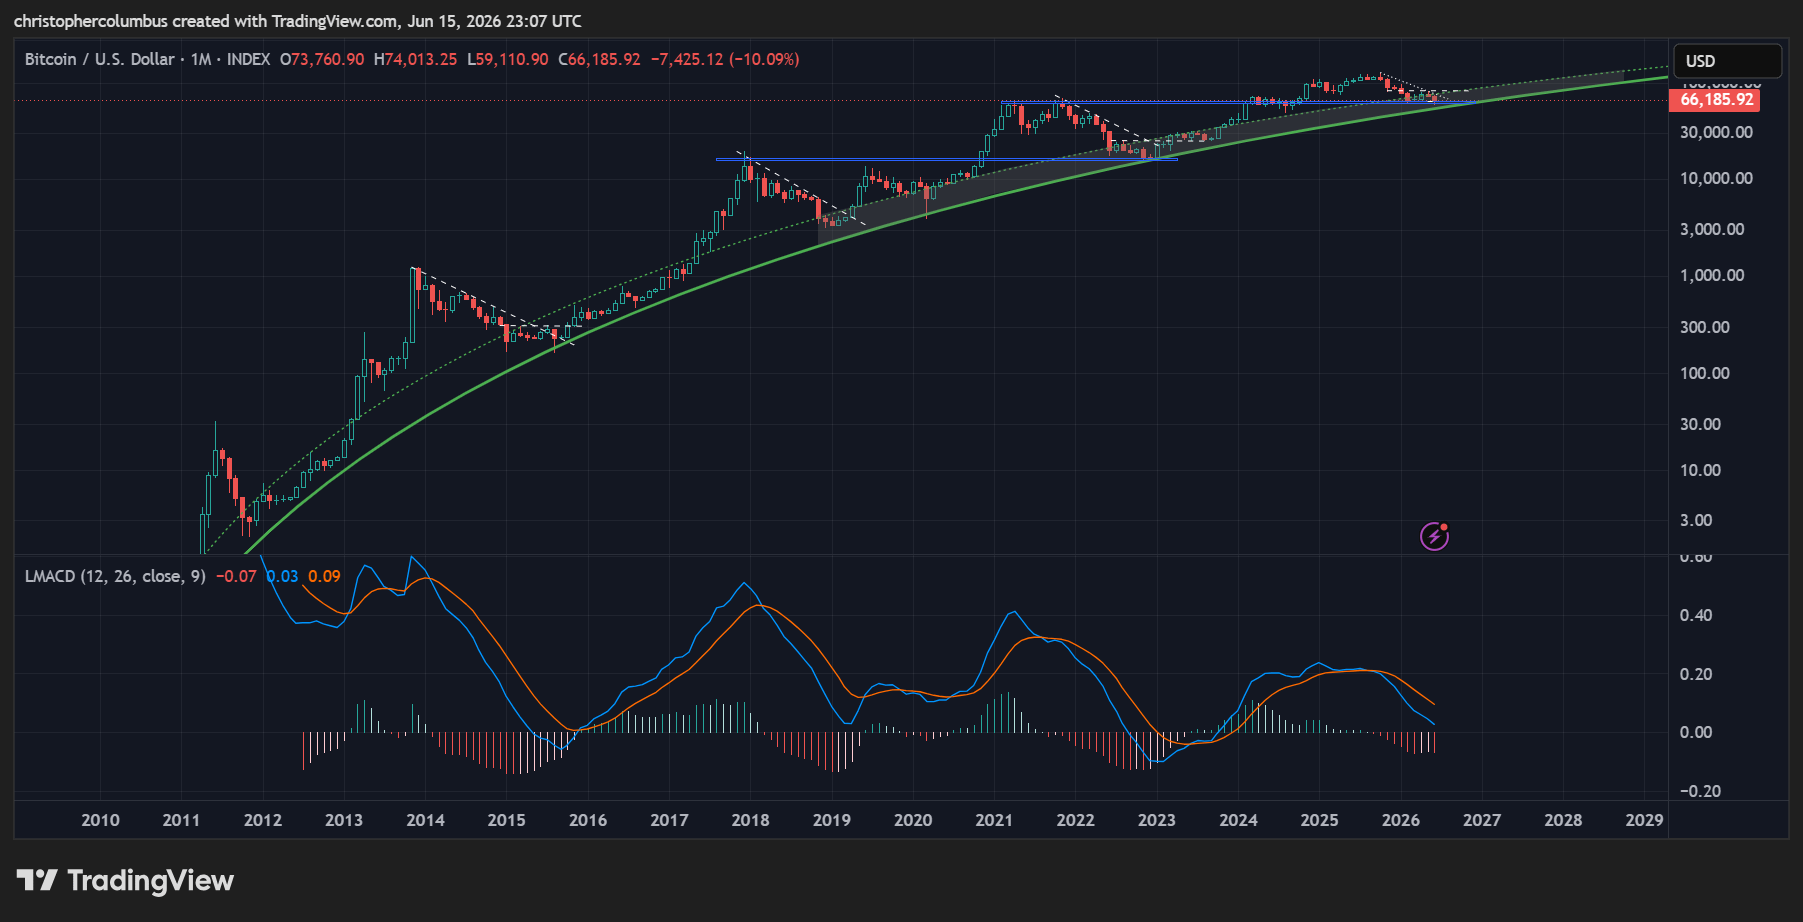
Of most interest has to be the monthly MACD on the highest time-frame. We see clearly here the MACD rebooting to the zero-line, building a base for the expected move higher at a later date.
Also of interest is the previous two months of a contracting histogram signaling a turnaround. With two weeks yet to play out for this latest histogram, it will be interesting to see if it also contracts [from red to white].
Once again, we see here a story of reducing macro volatility given the reduced range that the MACD moves in. Also supportive of the idea of reduced macro volatility is the histogram itself [the measure of the gap between the MACD and its signal line] reducing as seen in the following chart.
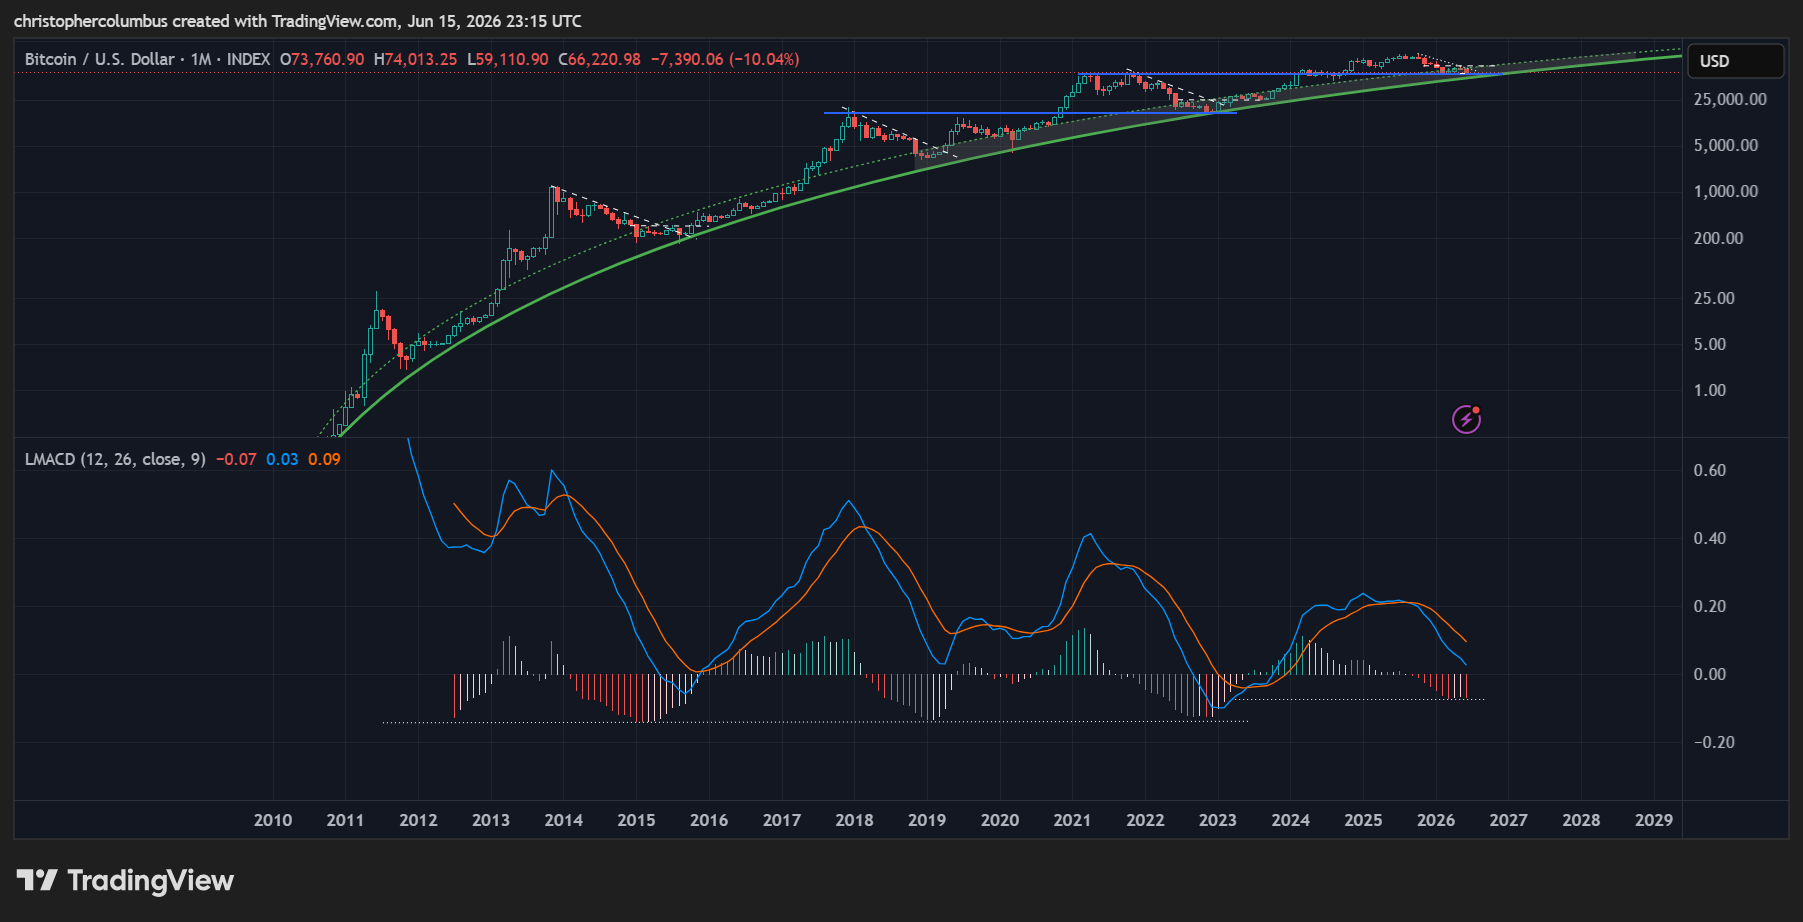
The line connecting the histograms on the monthly chart is similar to the line connecting the MACD lows on the weekly chart. They also show an ‘anomaly’ in this cycle, where the pattern is broken. Once again, this reflects a more mature technical market in contrast to previous parabolic ones in my opinion. From a long term investor’s perspective, this is a positive - that the cycles will become less ‘boom and bust’ and more a store of monetary value akin to gold.
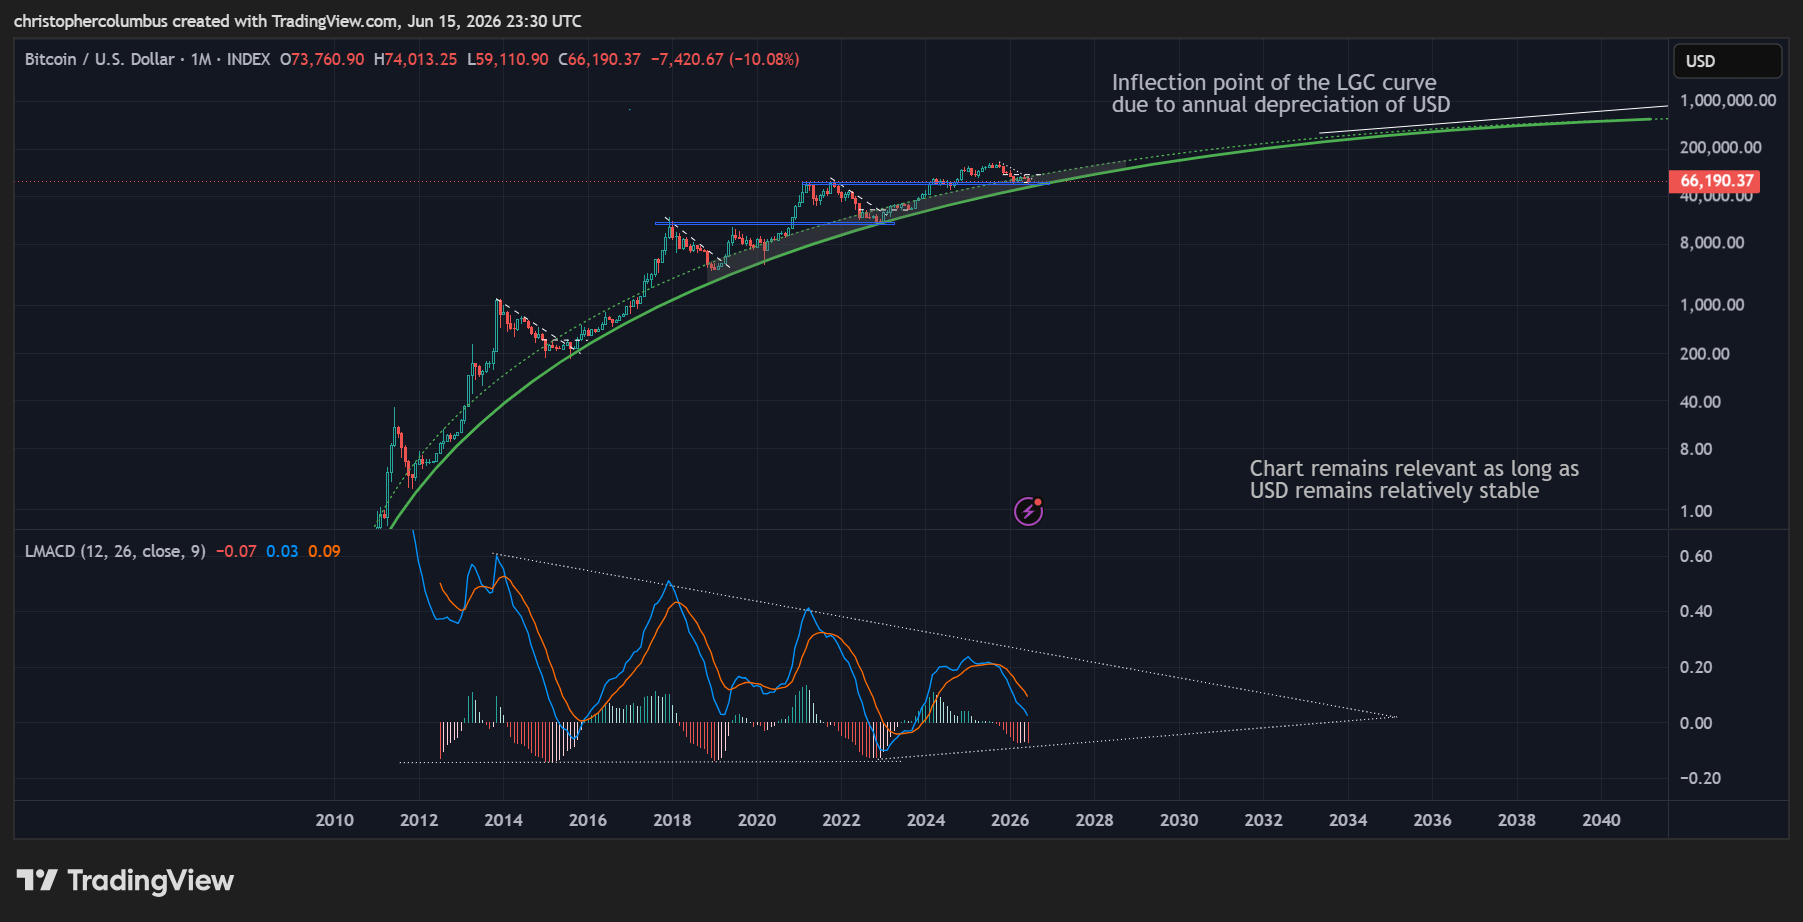
Finally, a projection of the monthly MACD below has it stabilized at a point that reflects the limit of the LGC’s relevance as mapped out against a relatively stable USD currency. This reflects a process of qualitative change in the market, where BTC markets are first parabolic, then exponential, then technical as the currency matures in the market place.
The inherent inflationary nature of only a relatively stable currency, the pricing mechanism of USD, will make the BTC/ USD chart at some point [and only 8 years on the projection of the chart] redundant. Add to this the risk of USD becoming destabilized in the interim, and you only have another reason to diversify your liquid capital into BTC, digital gold.
Until next time,
Stay [relatively] safe out there,
Dave the Wave.