BTC and the MACDs
Dear Readers,
I thought it was about time that the MACDs were reviewed on all time frames in order to further orientate us as to where price might be positioned in the greater scheme of things. Markets show patterns, and a study of this momentum indicator on various timeframes can help with the identification of those patterns.
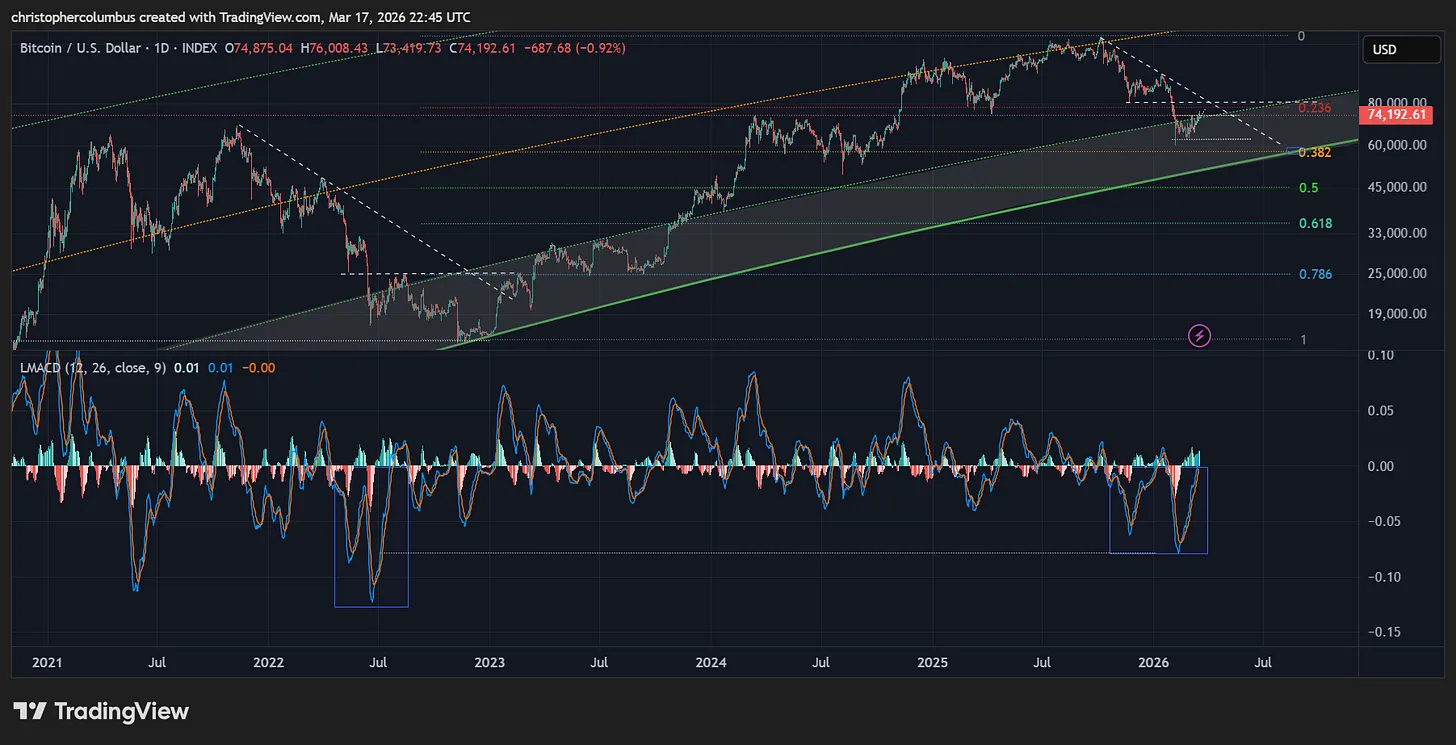
Daily MACD

First of, the MACD on the daily chart. Even though on this shorter timeframe it is really more useful as a volatility indicator, it still has information to provide for longer-term analysis.
What’s of interest here is the depth of the MACD, which you’d expect to go not quite so low in a maturing market. In the comparison I’ve highlighted [which is where I think we are when comparing the cycles], the second capitualtion is stronger than the first…. and then followed by an extended sideward range before the final and less dramatic move down. Such a price dynamic moving forward would be consistent with the LGC buy zone and a year-long correction.
The Weekly MACD
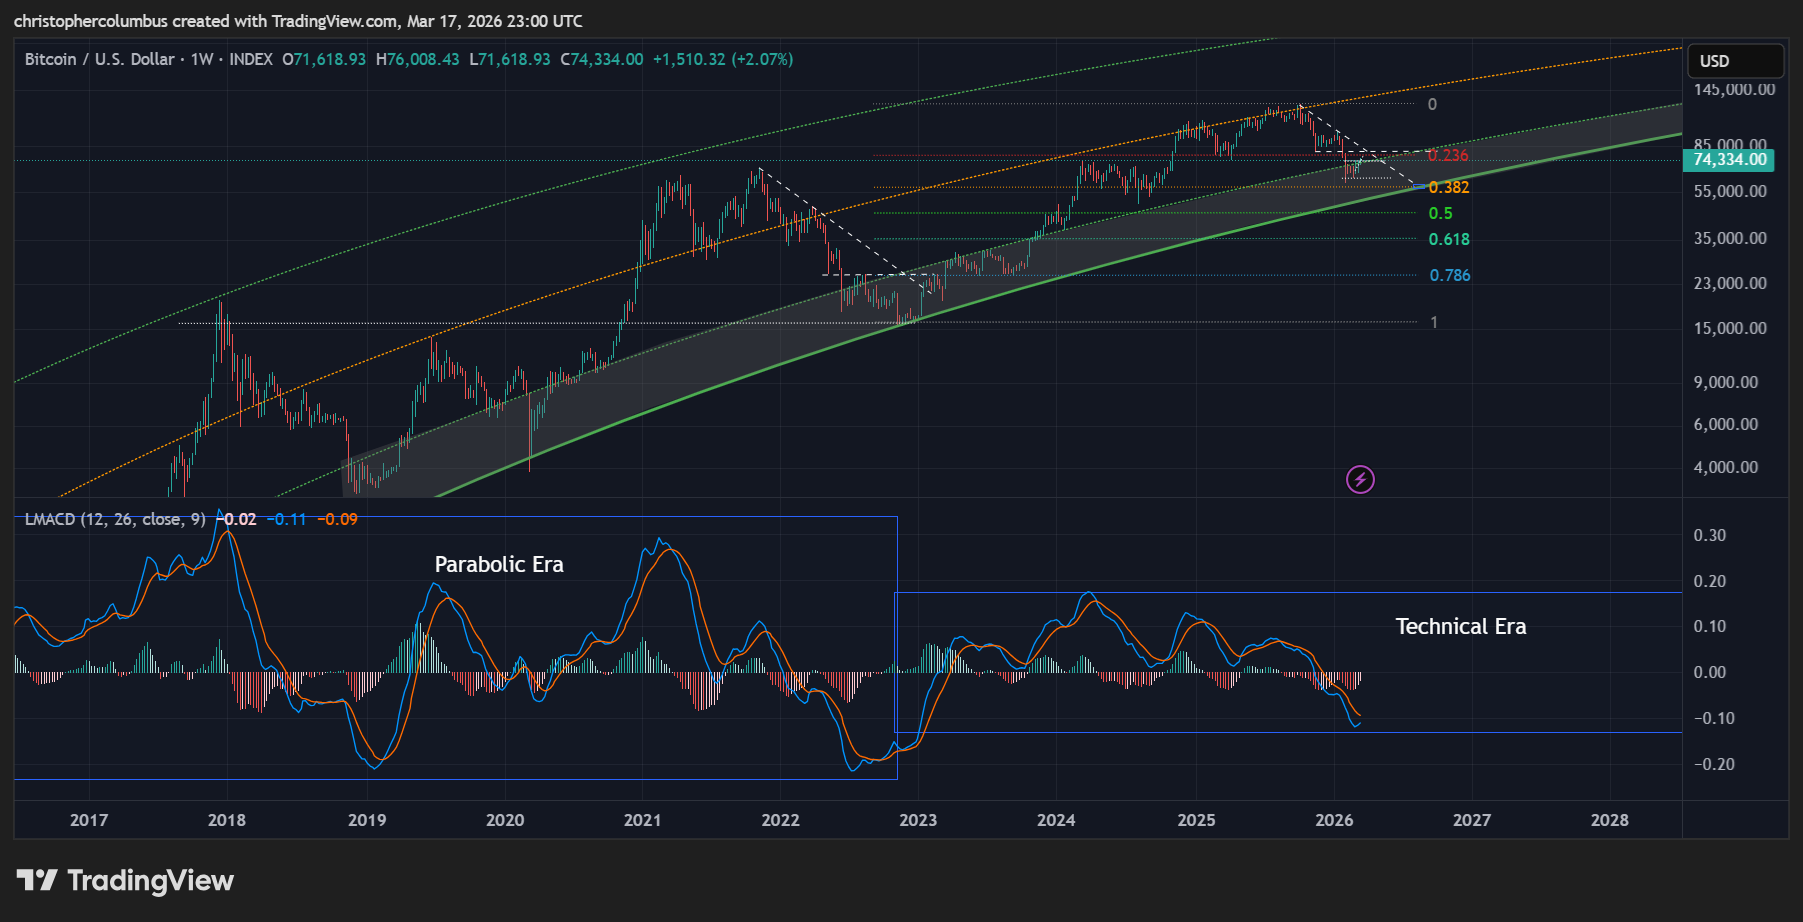
The first thing noticeable here is the reducing magnitude of the MACD post 2022 as compared to the MACD previous to that date. In my opinion, this is explicable in terms of a maturing market, where the market shifts froma parabolic one to a more technical one. On every move up post 2022, the technical nature of those moves [and the consolidations] became more apparent. The LGC curve model itself predicts this maturing of price action, where the gains are explosive at first, then shift to more modest gains to eventually plateau over the course of time [the capitalization of an alternative currency]. That said, the shift came a little earlier than expected, where price failed to run into the top half of the channel… something that I think now belongs to the parabolic era. The LGC curve itself remains applicable.
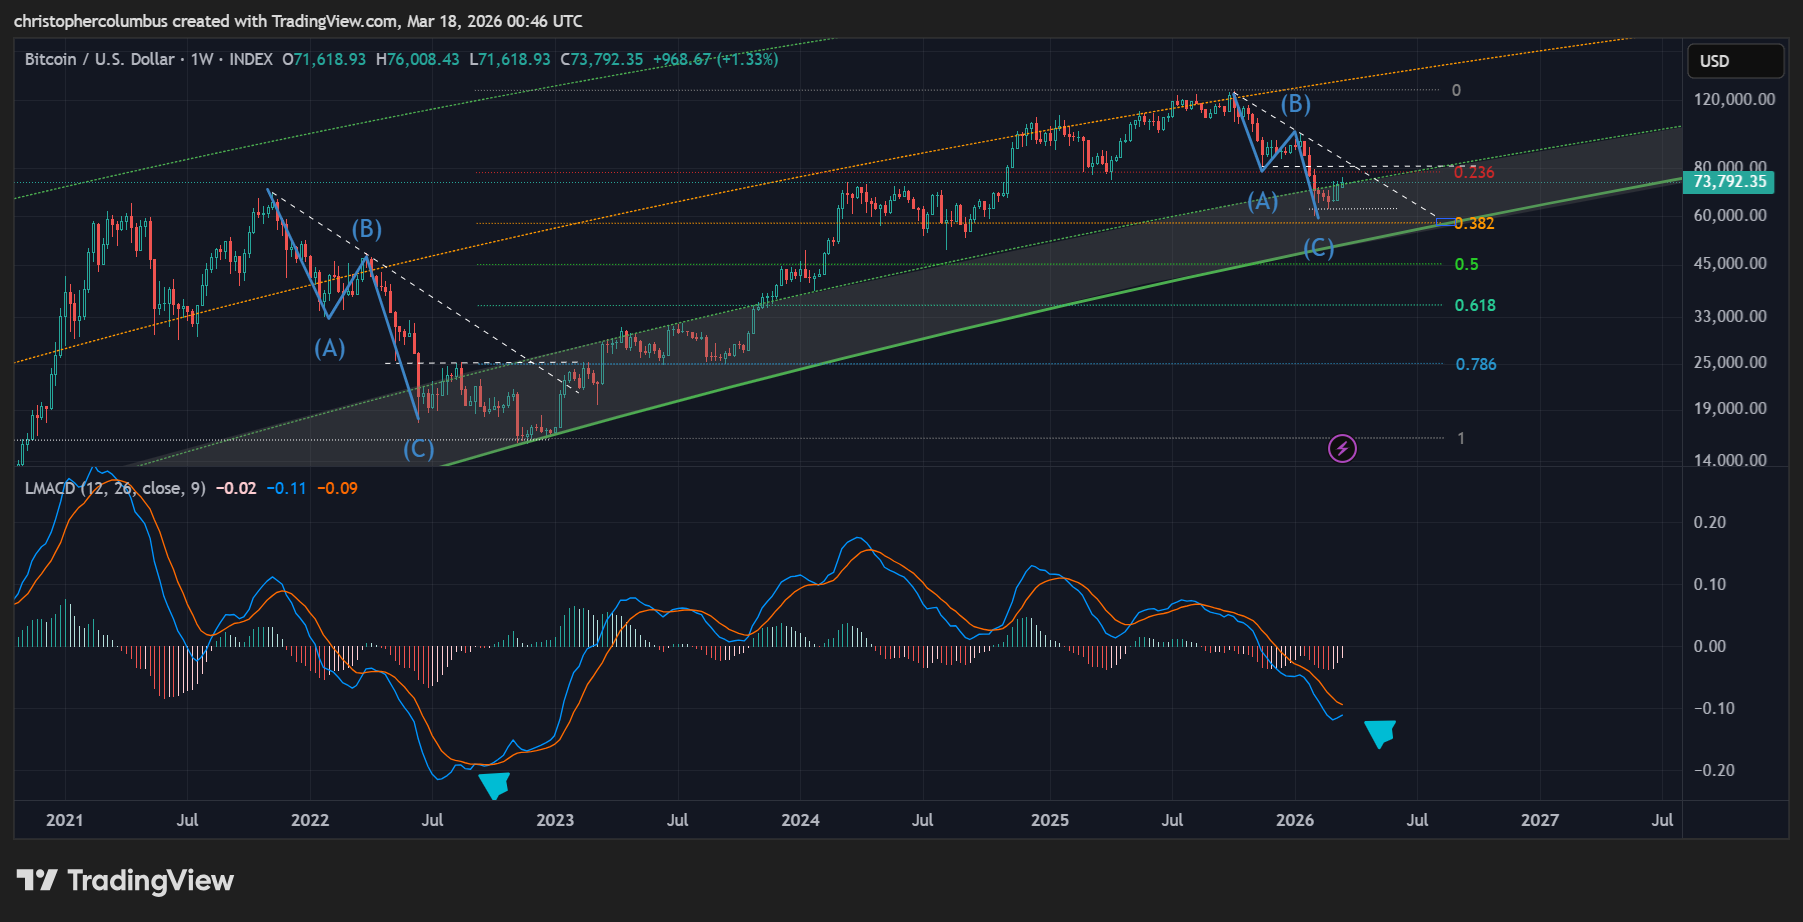
Focusing on the MACD of this cycle, it looks to be strengthening to the upside consistent with an ABC corrective phase. Look for a sideward range to form here, which would build the platform for the next cyclical move up. I’m thinking the MACD weekly low is in. Though this does not mean the price low is necessarily in [where a sideward range could culminate in that one last dip at a later date], momentum-wise most of the correction has already played out in my opinion.
Monthly MACD
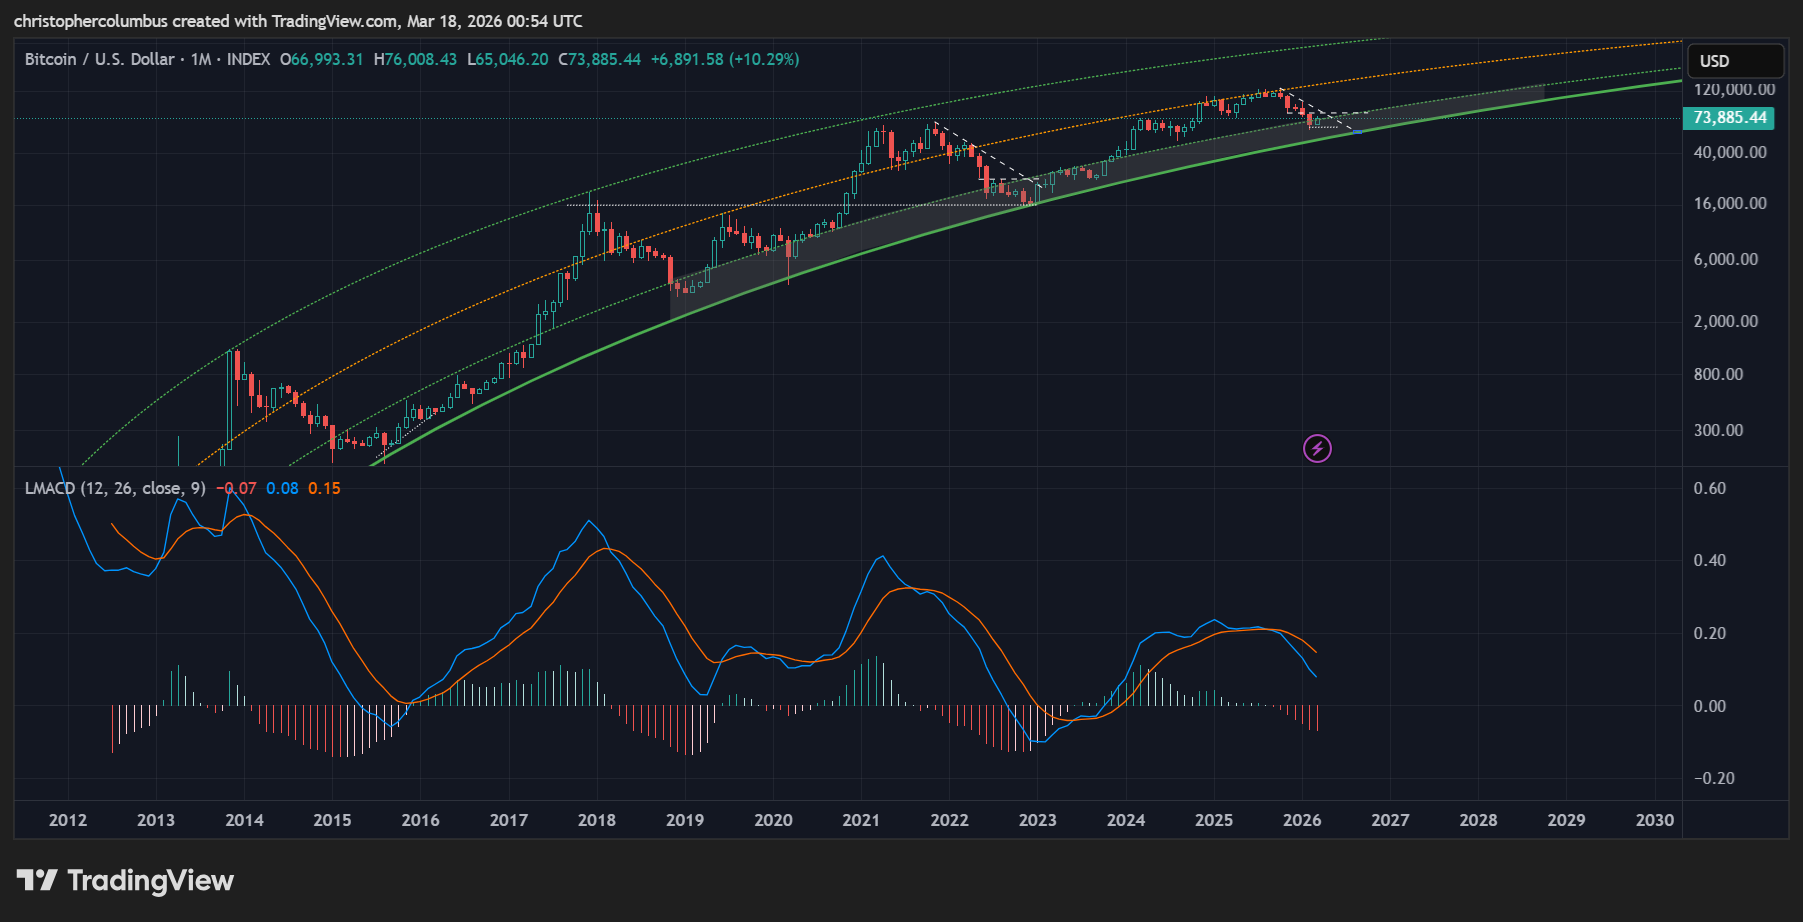
Lastly, on the monthly MACD, you see clearly the lack of a momentum spike even as price was moving higher on the recent cycle. As the MACD did not get as far extended above the zero-line as compared to previous cycles, it has now near corrected back to it - a few months would have it re-booted to the zero-line and in a good position to build upward momentum once again.
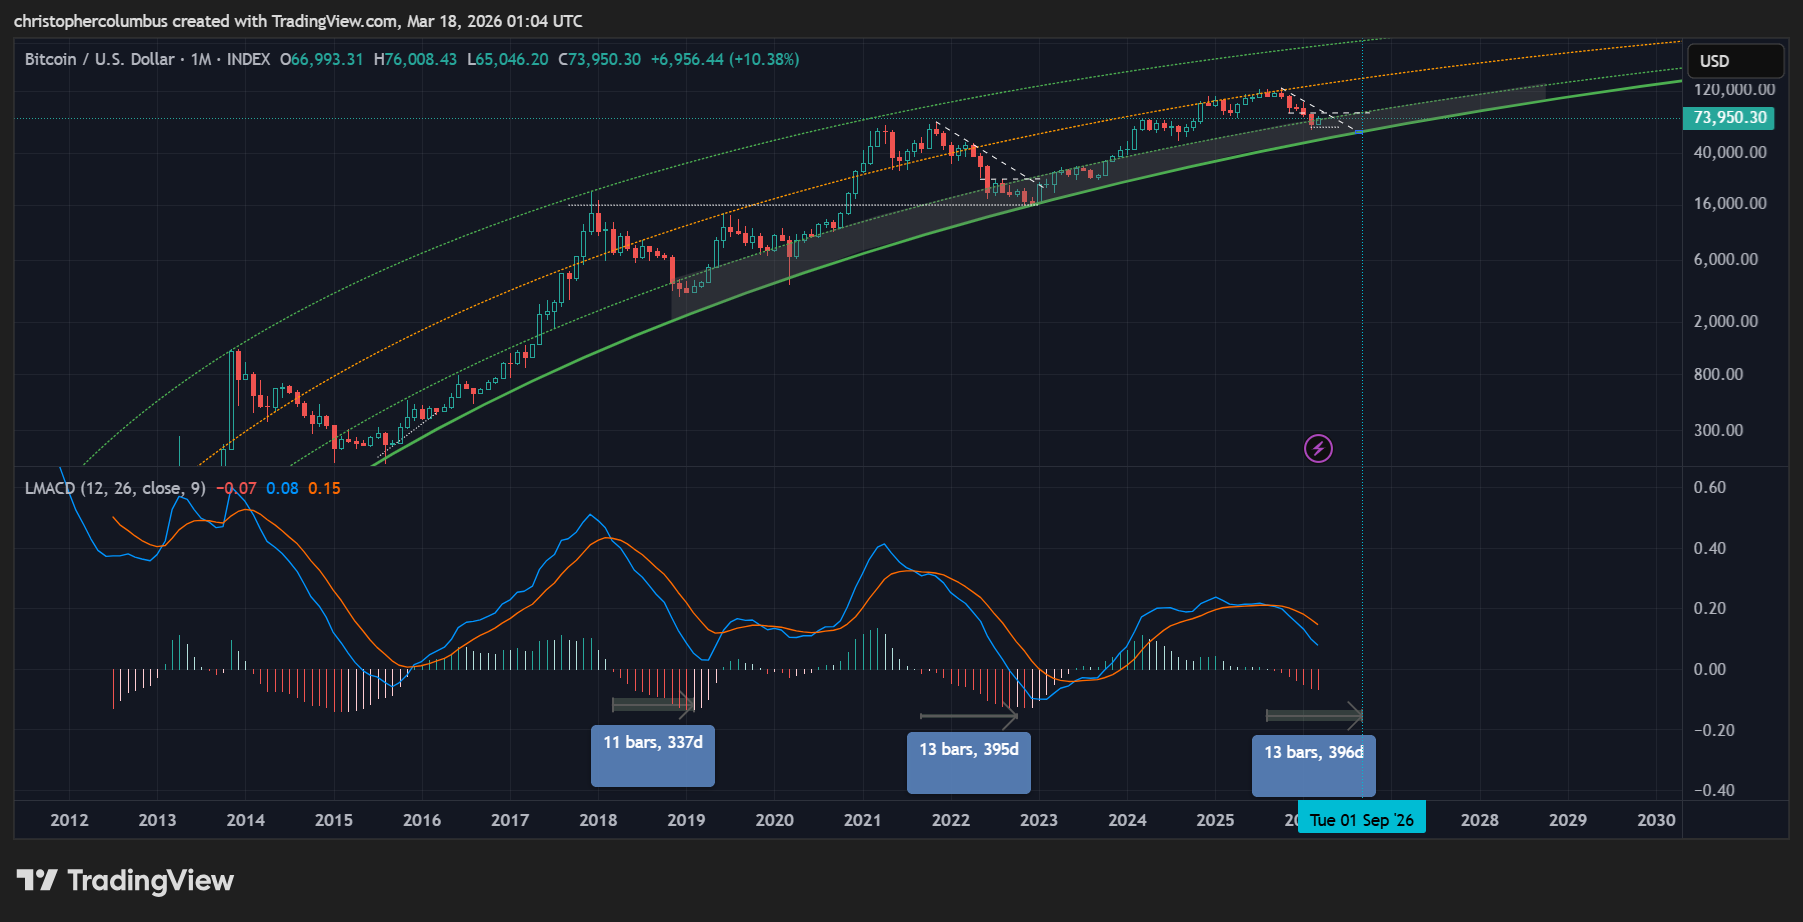
Something else to watch for is a contracting histogram [red to white], which would signify a relative strengthening of momentum/ increasing stability to what we currently have. Timewise, and if factoring in 13 bars for the turnaround, this would put us at September of this year for renewed upward pressure on price. This scenario would see two more quarters of essentially a sideward base-building range.
Until next time,
Stay [relatively] safe out there,
Dave the Wave.