
BTC and the Monthly MACD
Dear Readers,
Those following for some time will no doubt be well aware of my long-term focus on a long-term momentum indicator of bitcoin known as the MACD.
Recently, I drew attention to a pattern in the histogram that signaled a shift involving a contraction of bearish momentum. Once this shift in momentum occurred previously on the long term BTC chart, the market progressed from strength to strength with a series of further contractions in bearish momentum leading on eventually to fully-fledged bull markets.
This article will look to examine how significant a break of this pattern is for the ongoing secular/ long term bull market in Bitcoin... as is represented by the logarithmic growth curve [LGC]. I’ll look at three possible readings of this - first, as an anomaly; second, as a reflection of an increasingly irregular market; and lastly, as a breakdown in the secular bull market. Of course, I’ll also look to ‘weight’ these possibilities in saying what I think is the most probable interpretation for the BTC investor on the basis of the LGC.

dave the wave🌊🐫 @davthewave
And there you have it ladies and gentlemen, a momentum [and momentous] shift on the monthly MACD.No guarantee of certainty, but certainly a strong indication of the #Bitcoin macro turnaround... given the previous historical trend.

1:14 PM ∙ Nov 1, 20221,299Likes226Retweets
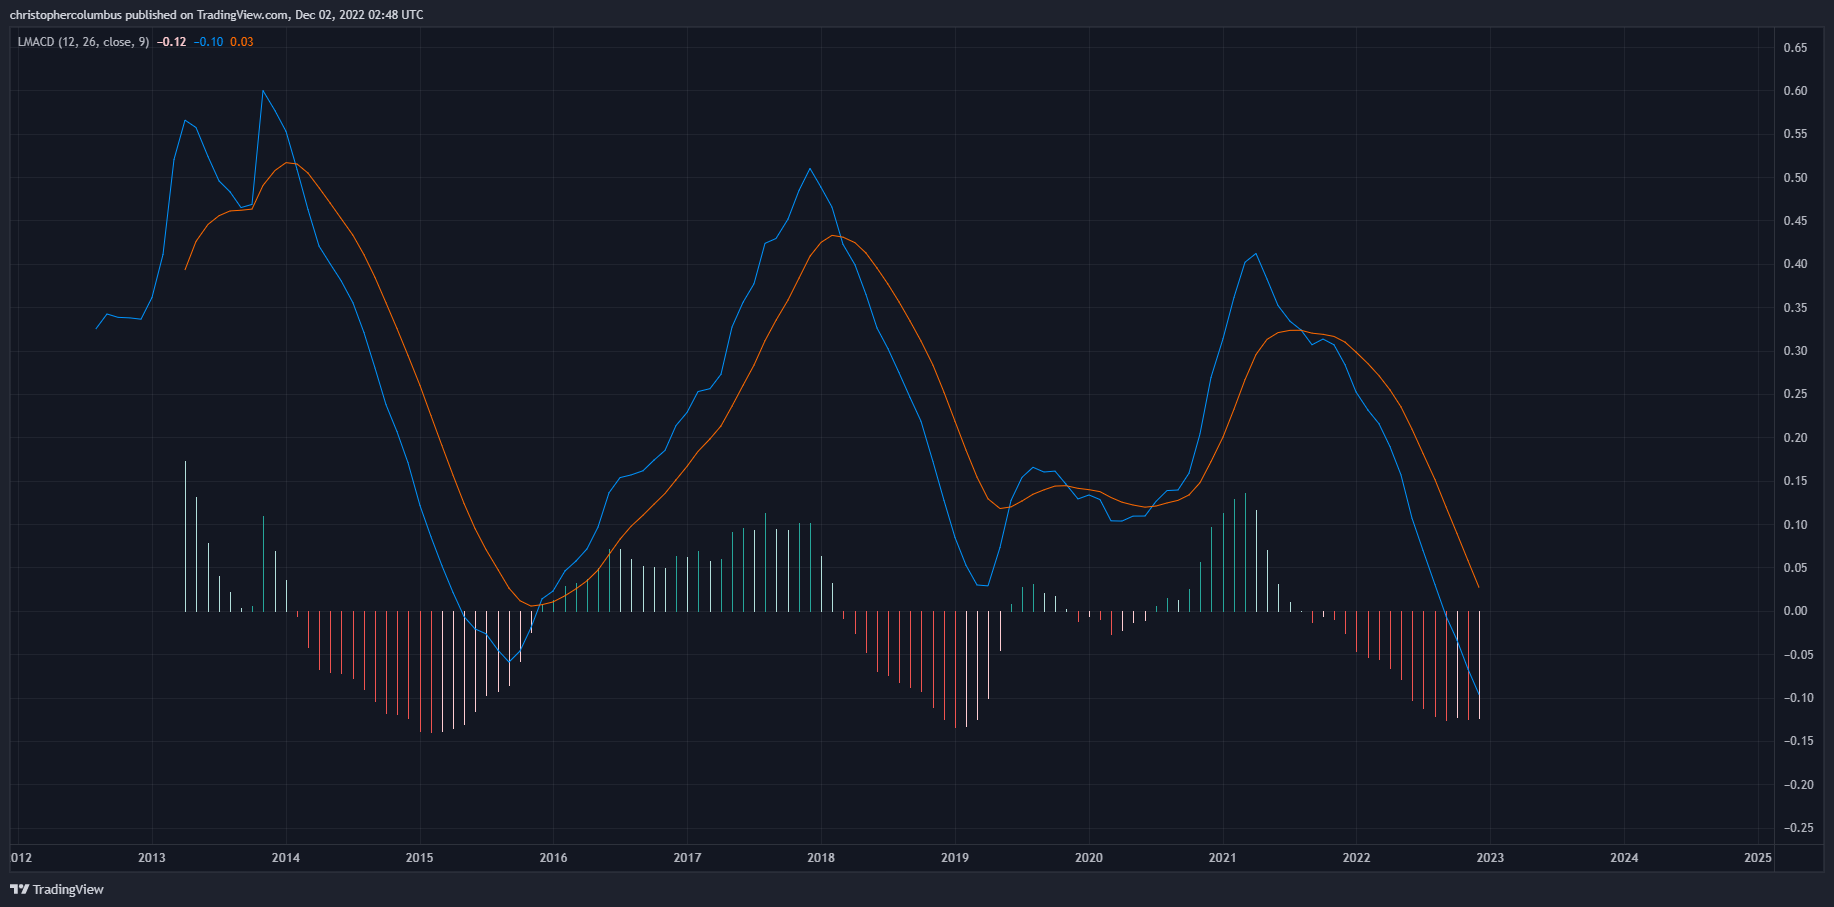
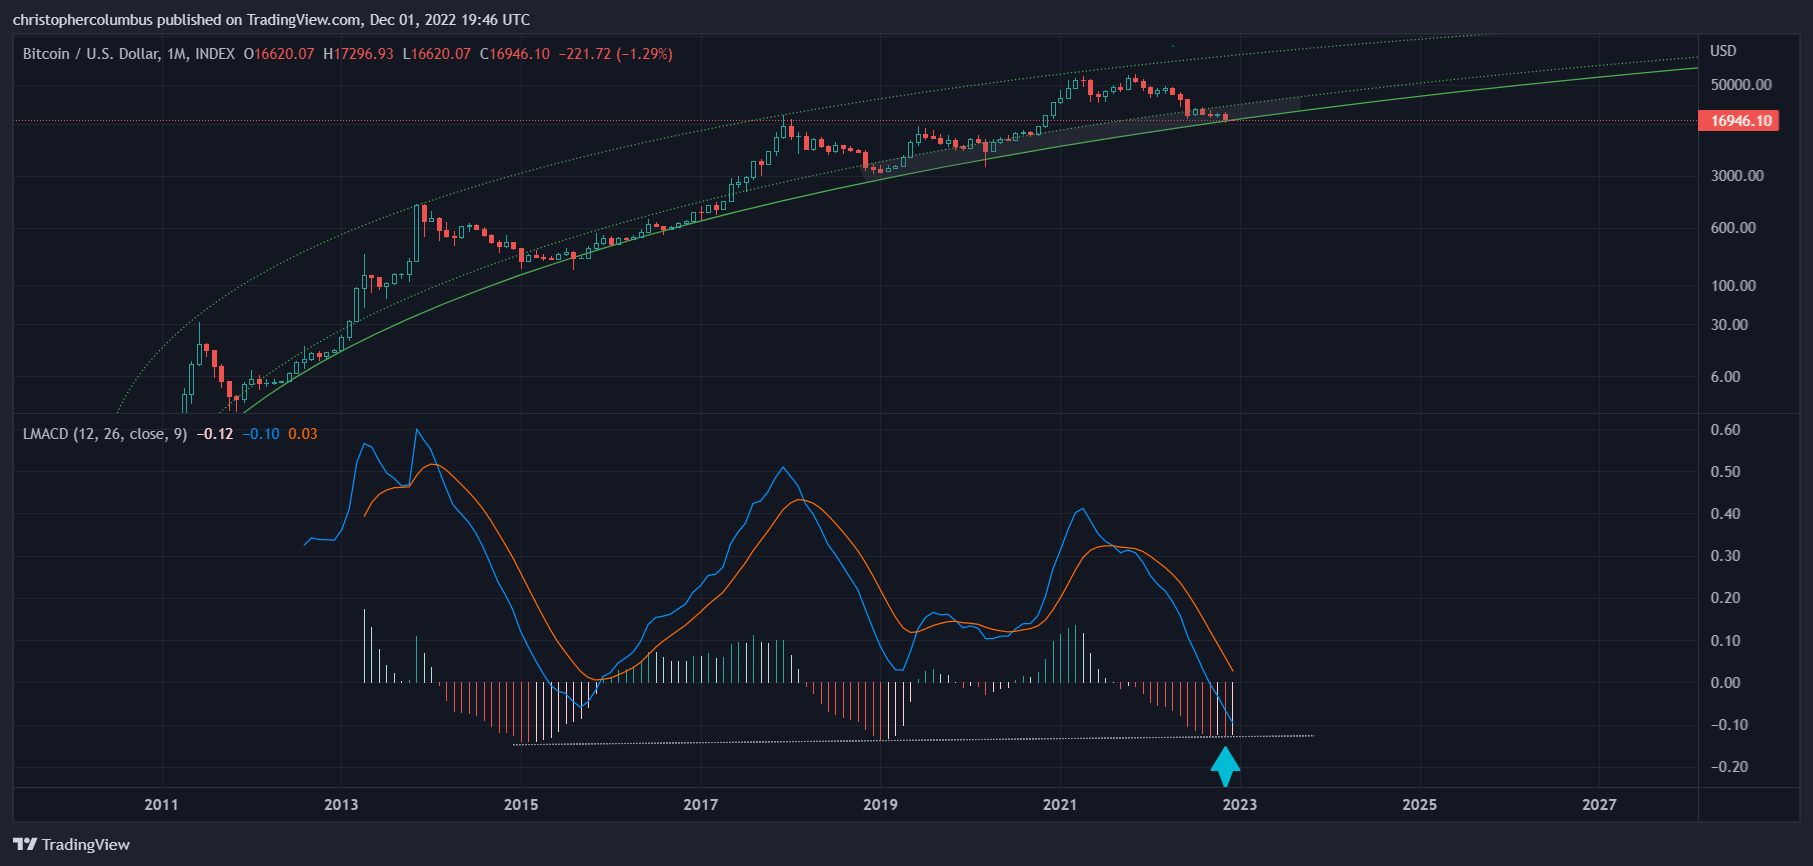
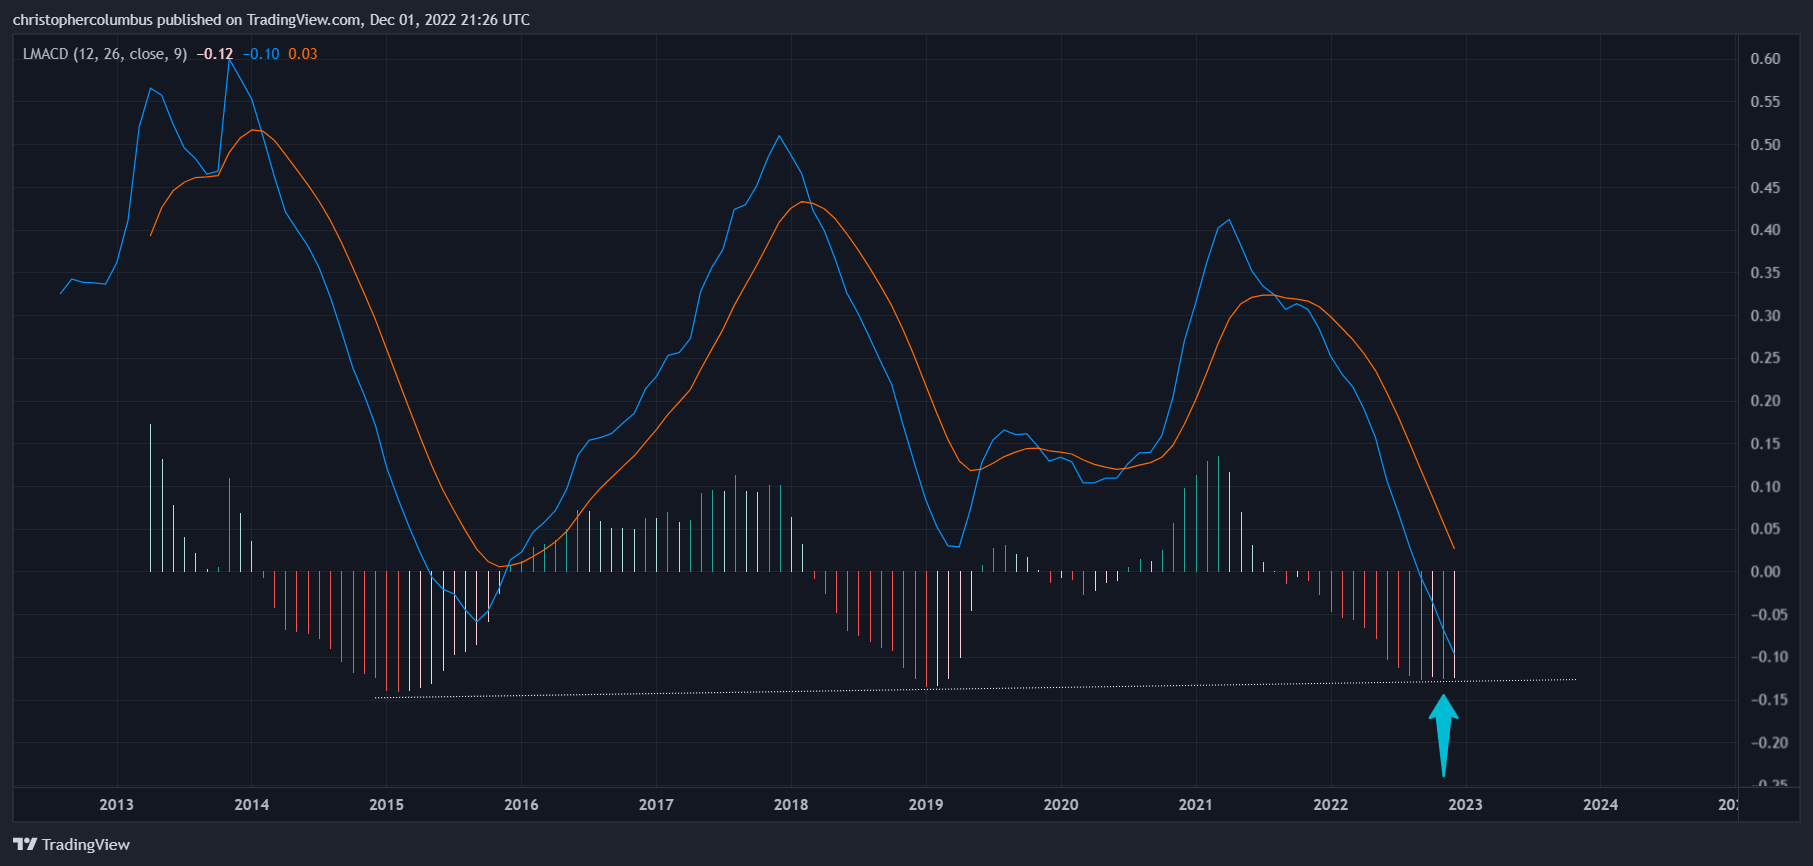
The above tweet drew attention to the printing of the first contraction/ weakening of bearish momentum as measured by the MACD histogram. Given the history, the expectation was the start of a continued series of contracting histograms to eventually lead to the bullish cross of the MACD [and green histograms above the zero line]. Though technically another contracting histogram did not quite eventuate, with a printing of another red for last month, we still have what looks to be a bottoming in the histogram as the following charts illustrates. Also of interest is the slightly upward moving line connecting the histogram troughs of the previous cycles… showing bearish momentum never getting quite so extended as compared to previous cycles.
The Various Interpretations
1] An Anomaly
Any identifiable pattern allows for an anomaly [a one-off exception to the rule]. It’s when this anomaly itself turns into a new pattern, with further anomalies, that the old pattern breaks down and a new pattern develops. Here one could say that the SBF debacle created a temporary liquidation event that upset the pattern, a temporary shock that the pattern can absorb. The question remains as to whether the pattern can indeed absorb it over the next few months.
2] The Macro Principle of an Increasingly Irregular Market
A macro reading of this anomaly, on the other hand, predicts that at some point this pattern must break due to the nature of a maturing asset, and an increasing irregularity in the so-called cycles that we’ve previously seen. I touched on this idea of an increasingly irregular market [due to an increasingly mature market] here:
The dynamic of recent price development [subsequent parabolas] may be starting to throw the general theory of nice neat cycles into doubt. The reason being that cycles are about finding a regular pattern, and what is unfolding on the chart looks to be becoming increasingly irregular. Instead of a long arcing cycle as seen previously, we are now seeing something quite different. On the chart, the ‘cycle’ seems to be breaking up just as giant ice-sheets would in warmer waters. Nor should this surprise us in the face of a general principle, where a maturing market and increasing liquidity is understood to lead to reducing volatility - the single major volatile spike [and correction] may be broken up into a series of more minor volatile spikes [and corrections]. And so it is that the increased liquidity of a maturing [and very speculative] market suggests a re-visiting of what has to be the current ‘orthodoxy’ of cycles.
The idea is that at some point the grand extended ‘cycle’, as reflected in the nice neat pattern of the monthly histogram, must at some point break due to this qualitative change in the market [maturation]. Even if this break of the pattern currently is just an anomaly, with its resumption over the next few months, this macro principle still applies - as the nascent currency of Bitcoin increasingly approaches price discovery/ stabilization, the previous MACD pattern will break down becoming a lot ‘messier’, and less predictable.
3] The Unthinkable [though Thinkable for the Hedge]
And this is that it’s all over, the market is in melt-down, and that price now must face an inexorable decline given that the series is broken and a red histogram printed. Yes, it does all seem a bit dramatic, and yes, this principle of a complete meltdown is at the core of your investment thesis anyway [the uncertainty principle]:
At the investment level, you’re looking to cover your bases, keeping something in reserve, keeping liquid while also invested, staying flexible while also knowing when to reasonably back some venture. A worldly-wise fleet-footed practicality typifies the mindset here, not a mind weighed down by some set of dry fundamental doctrines. Indeed, such overly theoretical concerns only serve to hamstring the pragmatism required. Though the pragmatist will observe which way the wind is blowing, that is, will observe what motivates the many, he’ll do so with more a curiosity to psychology than to some supposed Truth, for the compass at his center is that uncertainty principle. Bringing this back to the world of Crypto [a world within a world for the pragmatist], Bitcoin would be such a diversified investment. Having observed the longer term trend, and being cognizant of a nascent currency gathering strength, he’ll stake something solid on it without over-reaching. The investment will be proportional to the risk and reward of the venture - if it happens to blow up, he’ll not be sunk though it would no doubt involve some skin off his nose. It would be a blow but not enough to be the cause of his demise [financially speaking]. And as an investment, he’ll sit on this as a core position, to be sold later [on a longer time frame] at his discretion, at an opportune moment, for real assets. With the second layer established on top of the first, consisting of a solid core investment in Bitcoin for the longer term, time now to move up to the next layer.
But of course, the chart is not showing anything as dramatic as this. You see the LGC holding. Of more significance in regard to this particular article, the real story of the monthly MACD here is the formation of a base as mentioned earlier… a base suggesting the culmination, on an extended time-frame, of bearish momentum.
Also of significance is the reaching of the MACD line itself deep below the zero-line. Of course, with eventual price stabilization/ capitalization in mind [at higher levels] it is only to be expected for the MACD to come to spend some time below the zero-line [after a speculative episode] due to the increasing maturation of the asset. Eventually, at full maturation/ capitalization, the MACD should oscillate around the zero-line, and at much less extreme levels. The story here is that though the halcyon days of stupendous gains may be over, the potential for solid gains to be made are still there.
Conclusion
The LGC model is primarily a long-term macro chart. Accordingly, at times of testing such as now, it needs to be given a reasonable period of time to see whether or not it passes that test. It also needs to be given some tolerance to allow for temporary volatility. This is not to prevaricate, or ever put of the day of reckoning, but to find a middle ground between jumping to a premature conclusion [of its invalidation] and never allowing for a point at which it would be definitely invalidated. A rational model by definition is falsifiable [capable of being invalidated], and so a criteria should be provided by which it would be invalidated. For myself, I think a multi-month close a level lower significantly below the curve would be that criteria.
At the start of the article I asked how significant a disruption of the previous histogram pattern on the monthly chart would be. In sum, for the reasons outlined above, I do not think this hugely significant at all.
Until next time,
Stay [relatively] safe out there,
Dave the Wave.