
BTC and the Technical Movement of Price
Dear Readers,
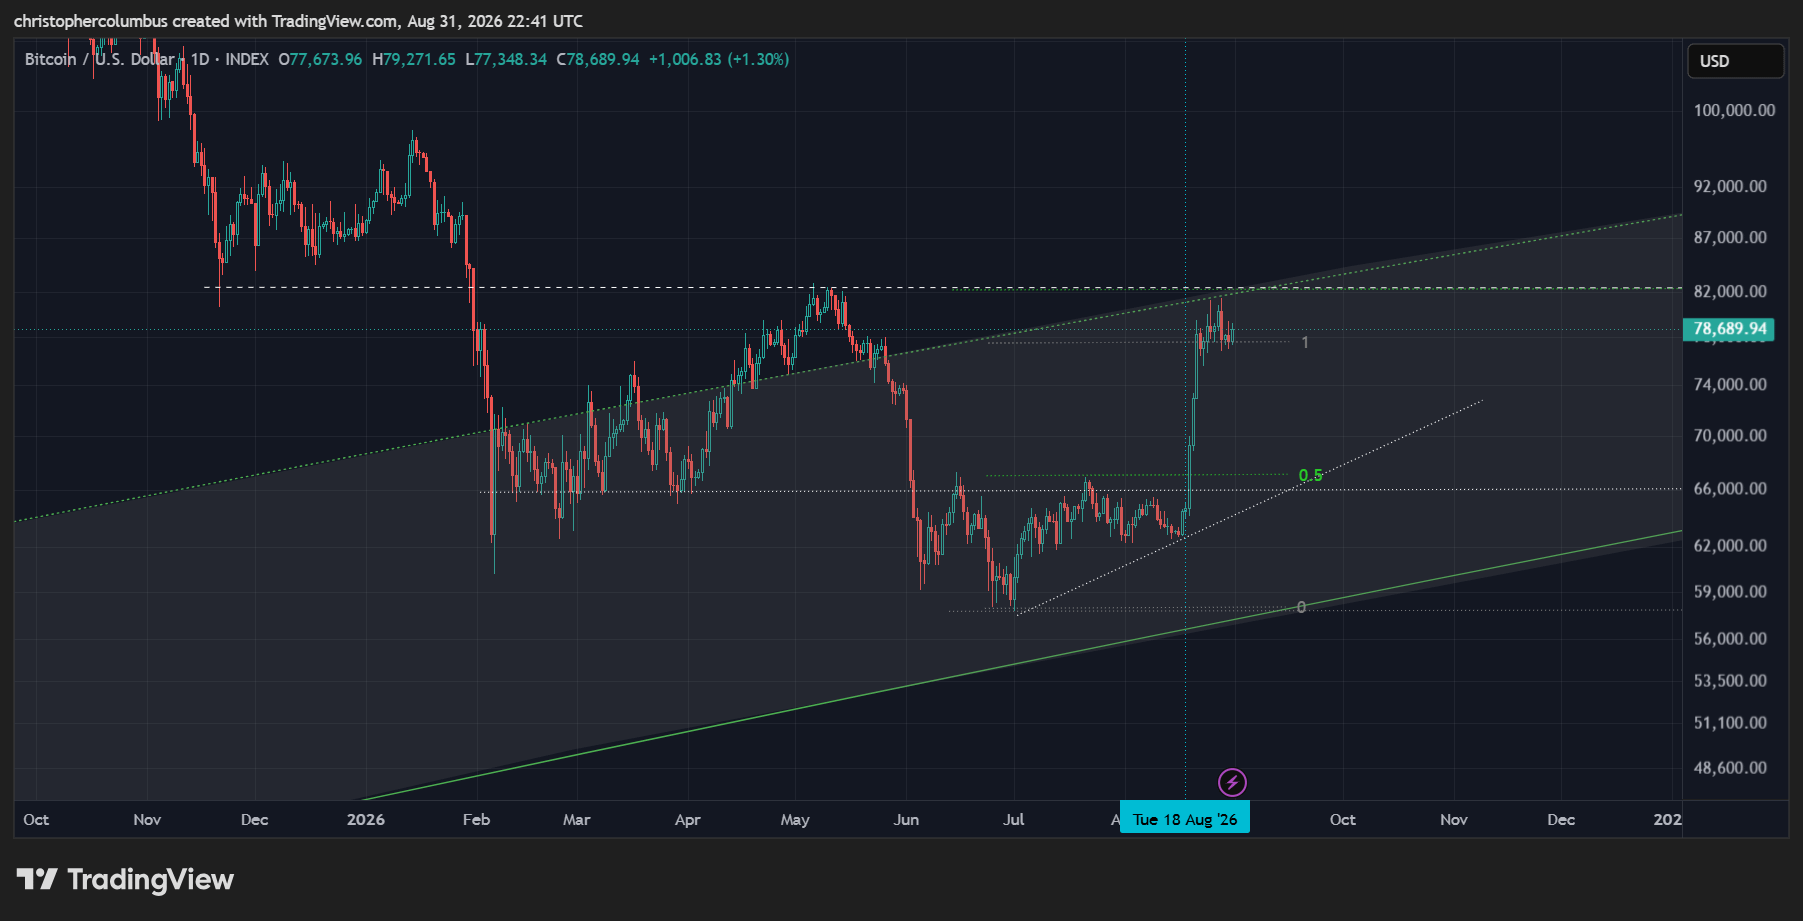
We saw quite the move indeed right after the previous article a fortnight back. A large move upward meeting the fib extension target that had been drawn… and more, to meet resistance at a significant level. Can price move further upward here and now? While always possible, an alternative to this and still bullish is the possible formation of a reverse head and shoulders, which is something I’ve had an eye on for some time now.
Scenario of a Reverse Head and Shoulders
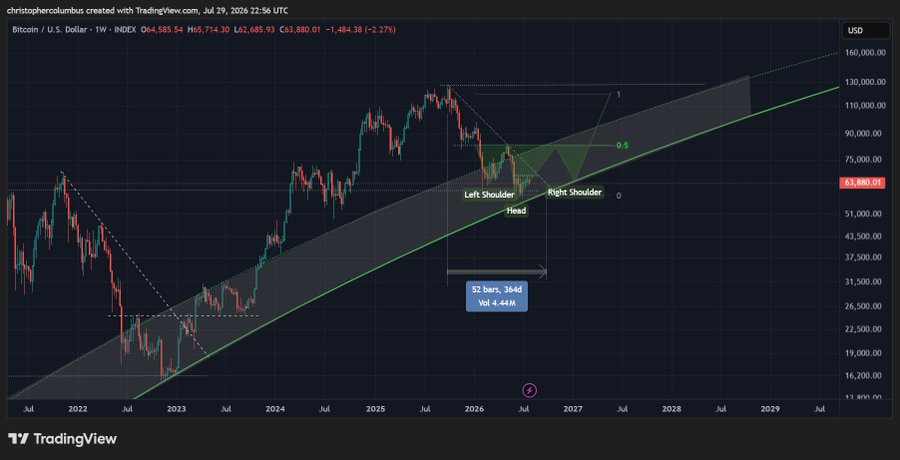
As posted in July 30 on X with price at 63K: “Potential reverse h&s shaping up in the LGC #btc 'buyzone' coinciding with a one-year correction”.
With price now at the neckline of of a reverse head and shoulders, a significant technical basing pattern in what has to be an increasing technical/ mature market, I think it is worth keeping an eye on this.
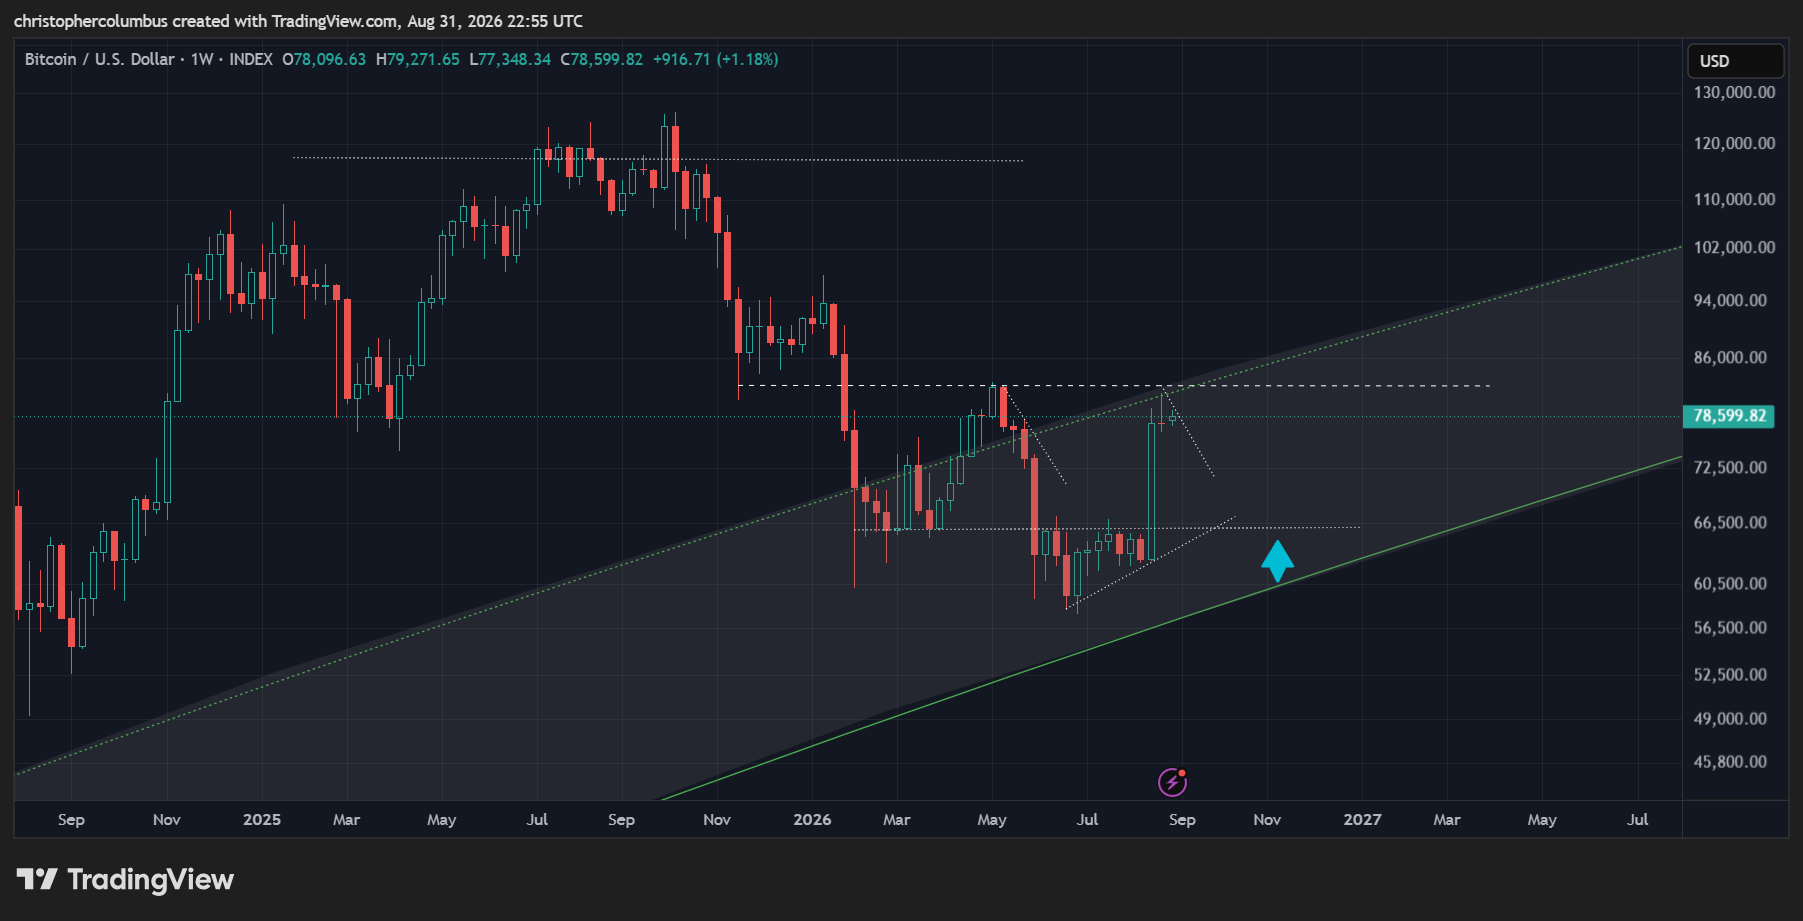
First of, the technical expectation here is that if price were to consolidate after this run-up, it would not make a lower low [into the 50K range], but remain in the 60K range before heading up again.
Next, timewise, the 4th quarter is looking promising with not only a recovery of recent local highs but a break out [going into next year] toward the previous cyclical high.
Next, it’s interesting to note that price still remains in the buy zone. It has always been the view of this investor [since 2018] that one does well to buy in tranches [if with no BTC exposure]. That view has performed well over the years.
Reverse H&S Target
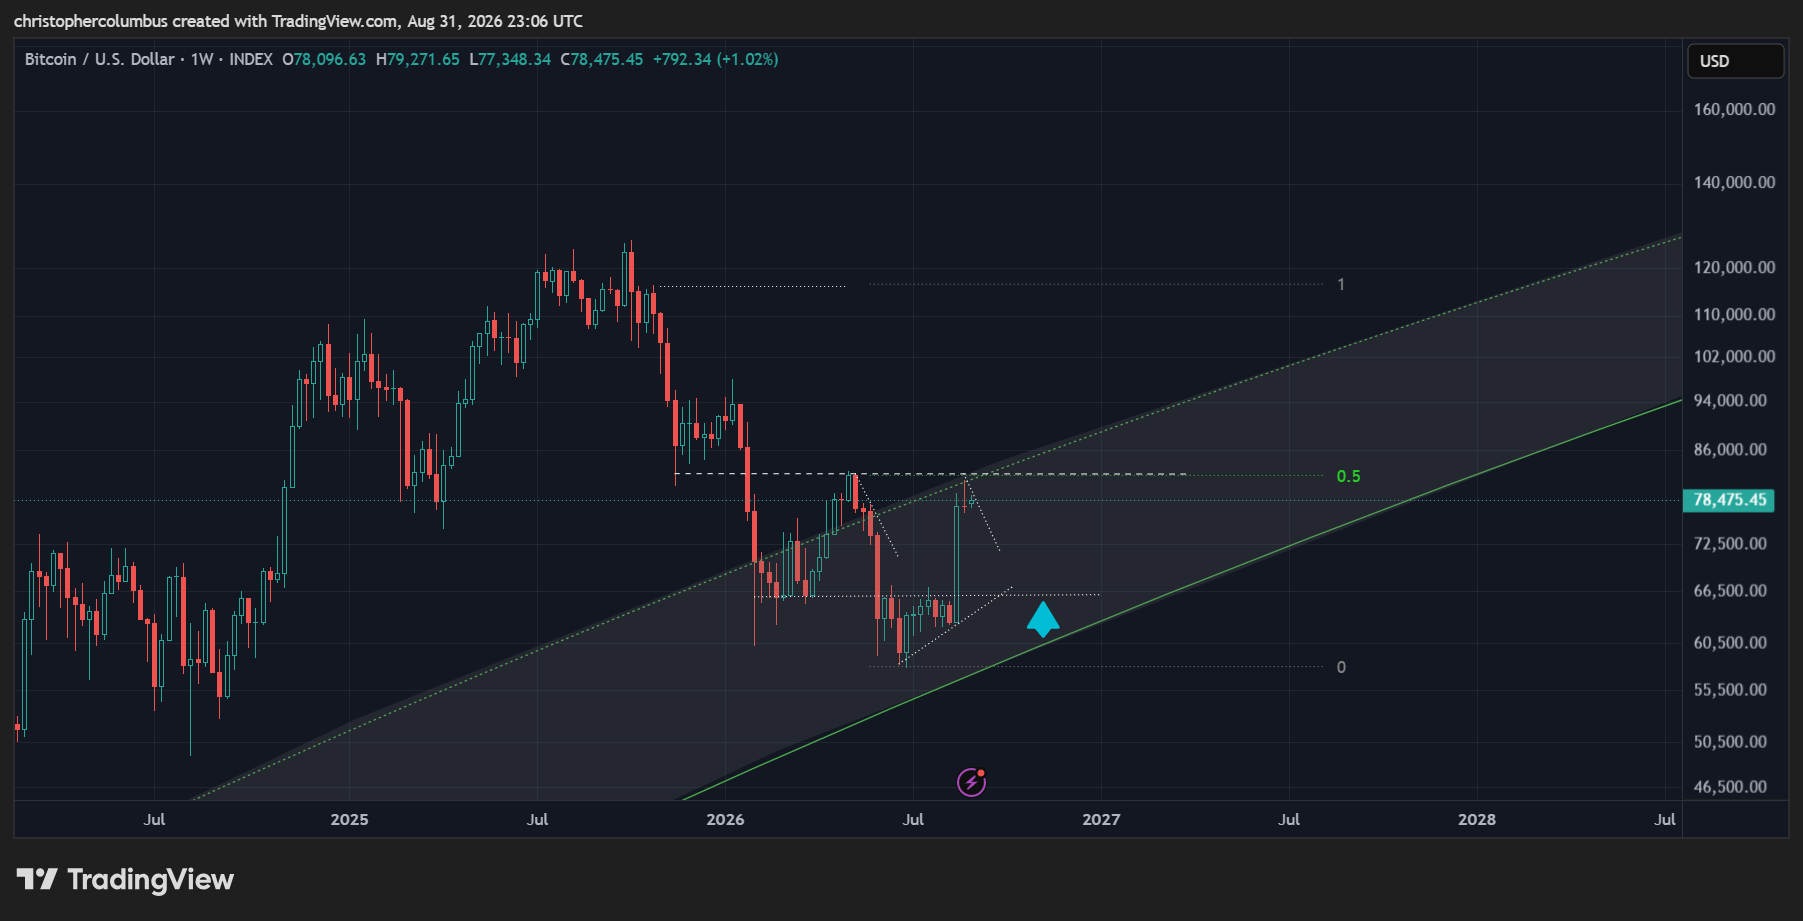
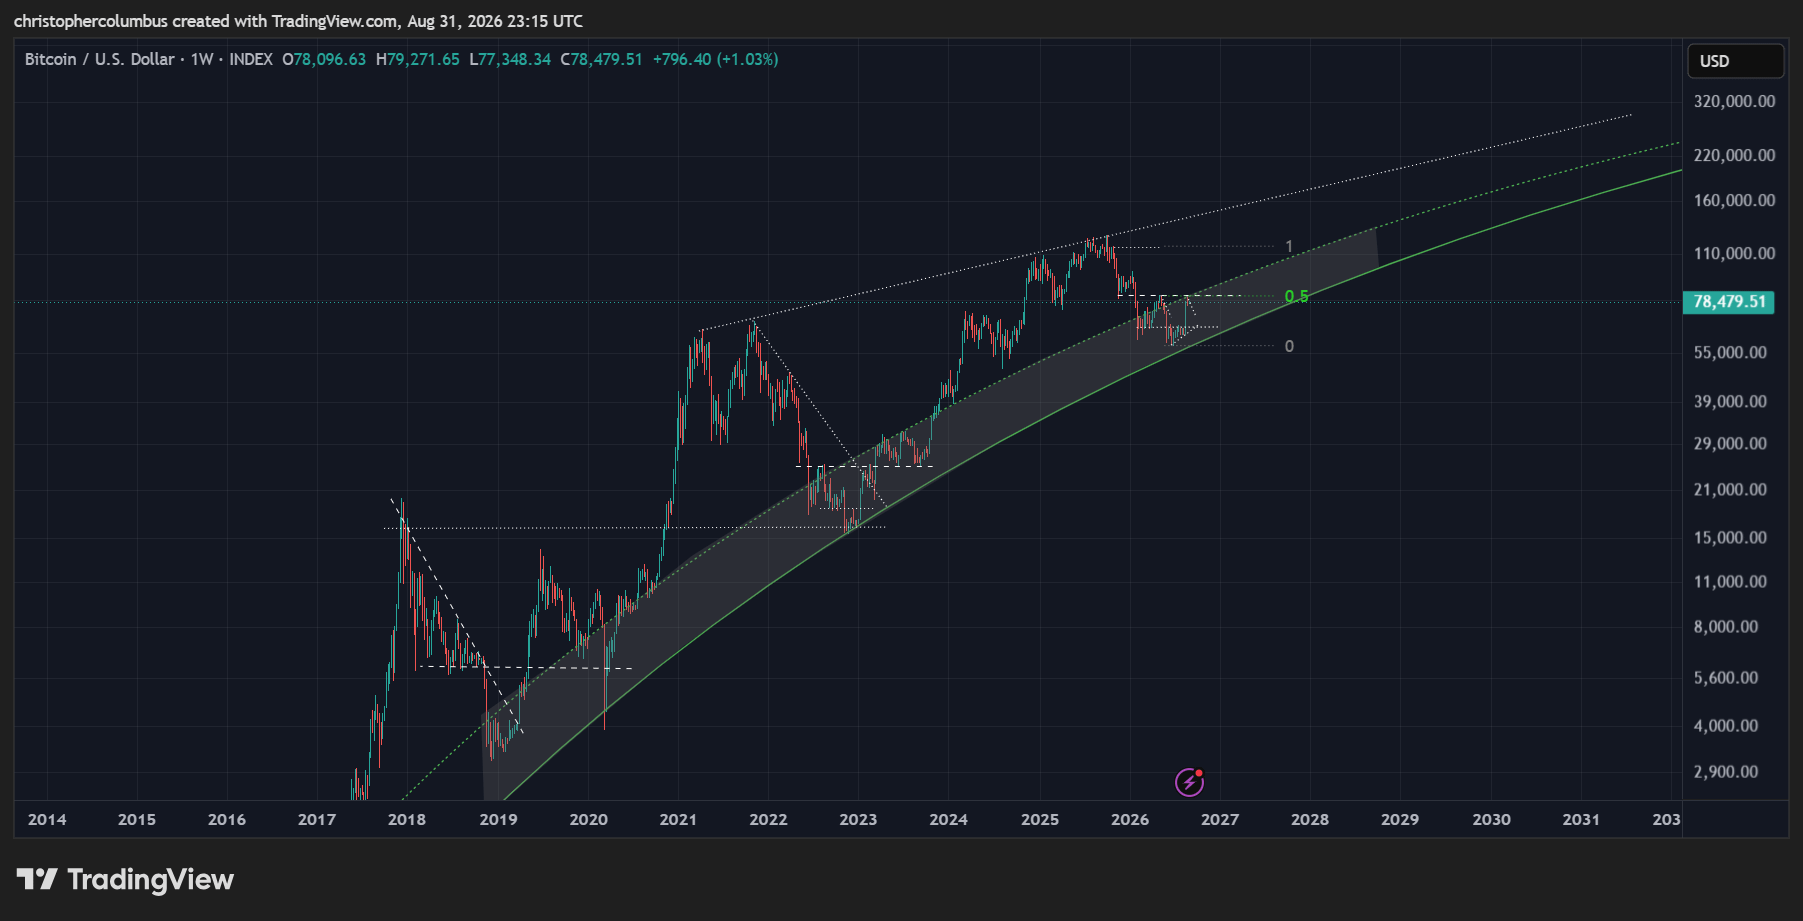
The technical target of the pattern is 116K, which would see price pushing toward all time highs next year. Also of interest to note here is how close these highs would be to the LGC [logarithmic growth curve] ‘buyzone’. And this is both predictable and explicable on the basis of the LGC model itself - that price is moving toward price discovery as the asset/ currency is further capitalized in the market.
One can envisage in the not-too-distant future that price will remain in the buyzone as the market increasingly matures… much as the way in which gold has always been for those with surplus funds at their disposal [because it has always been capitalized].
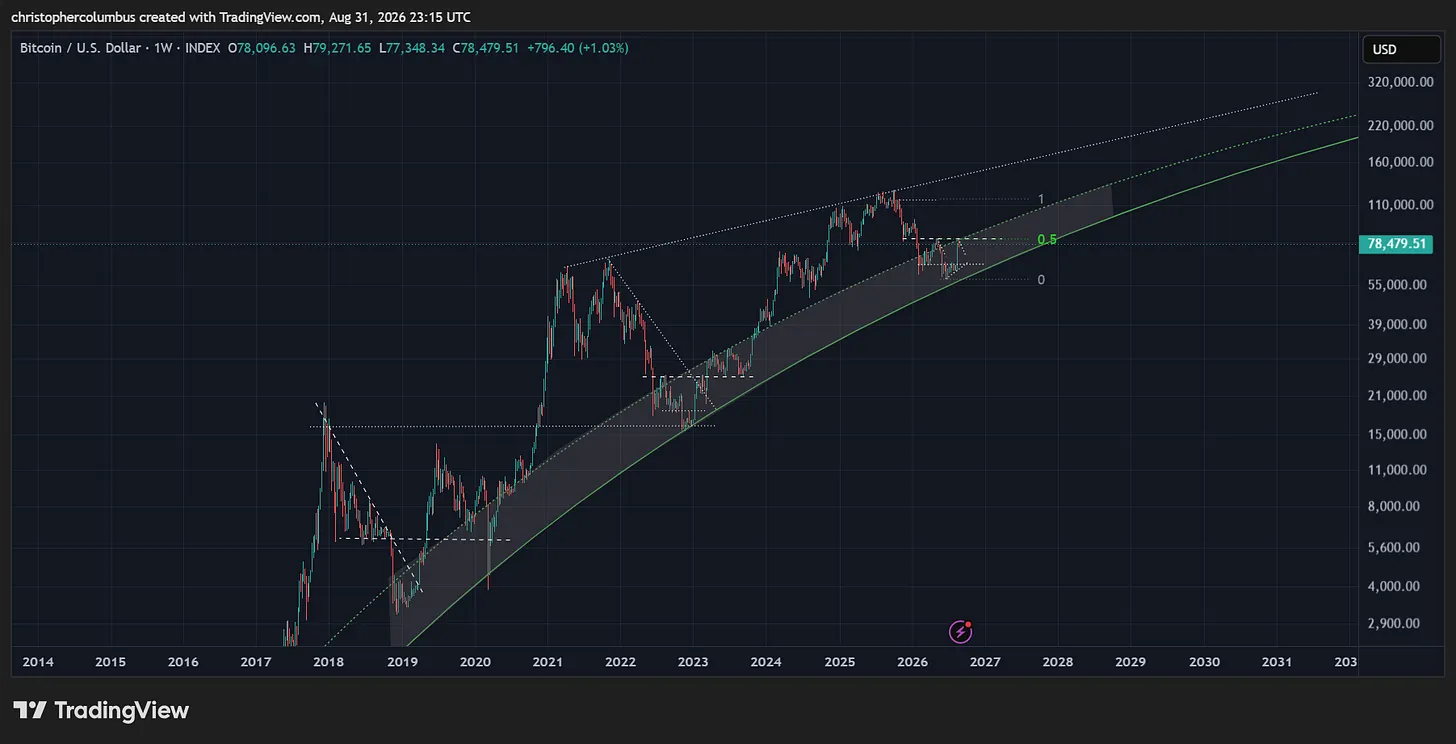
If we are now also in what I like to refer to as ‘post-parabolic markets’ [i.e.; moe mature technical markets] then it makes some sense to connect the recent cyclical peaks to provide a projected/ predictable cap of sorts to price going forward [keep in mind that the relative stability of USD is being assumed here… always the wild card]. Significantly this projection from the highs begins to converge with the logarithmic growth curve as seen in the chart below.
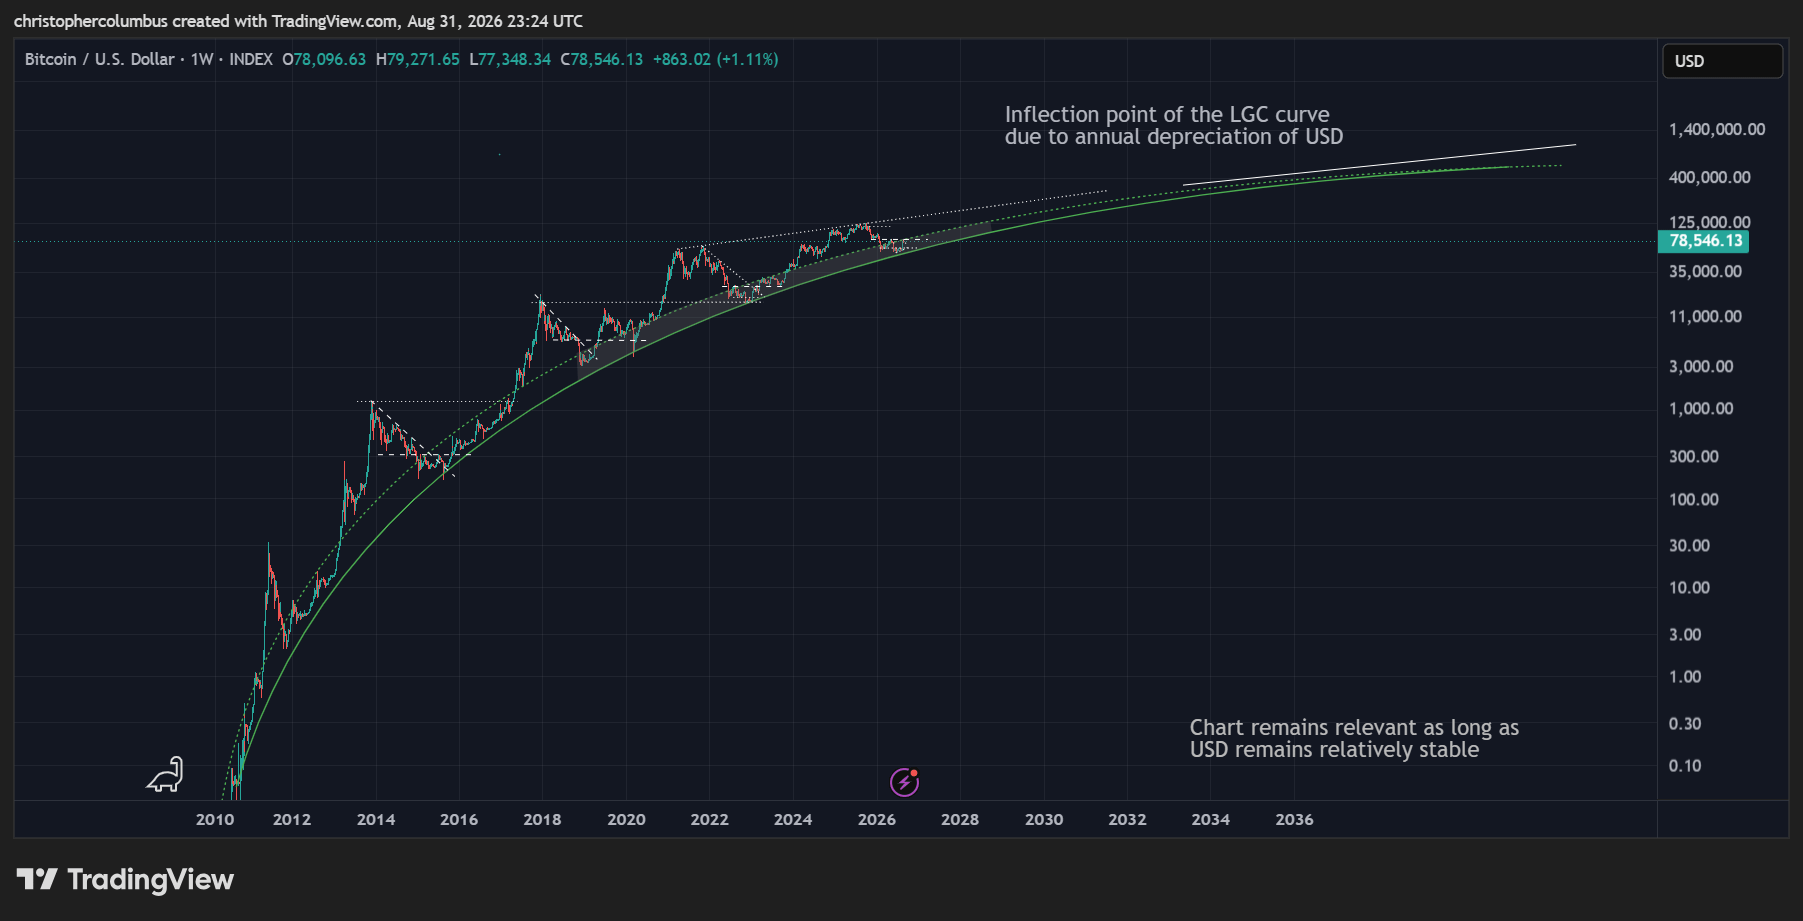
Finally, to zoom out to the longest term chart, we can see the logic that is playing out, something that has been predicted to play out since 2018 along the lines of the logarithmic growth curve. Even though the astronomical returns may belong to the past, and to previous cycles, stratospheric returns still remain for the investor in the here and now going forward. Best conceived as digital gold, BTC provides an alternative to USD and a means to diversifying one’s liquid worth in a very unstable monetary environment.
.
Until next time,
Stay [relatively] safe out there,
Dave the Wave.