
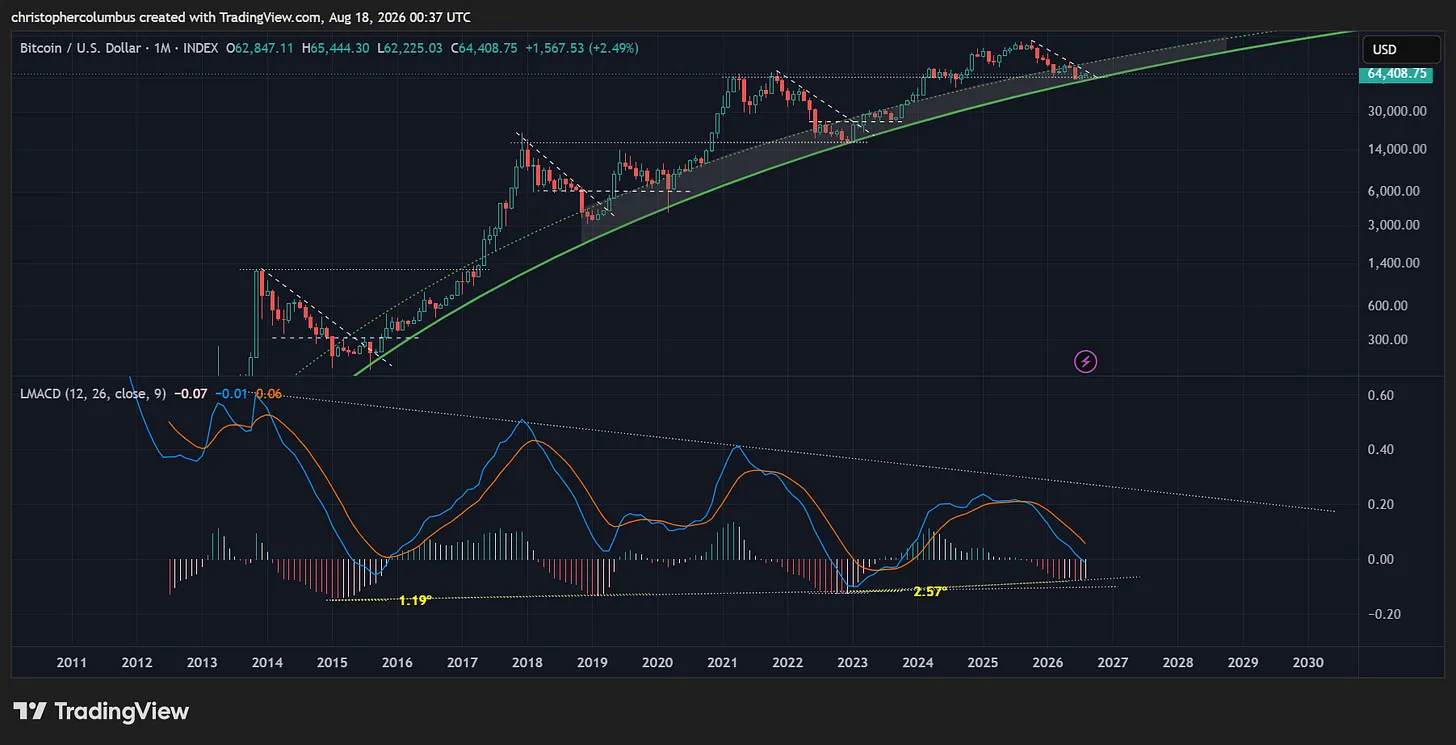
BTC Basing Range on the Monthly Chart
Dear Readers,
Time and Resistance
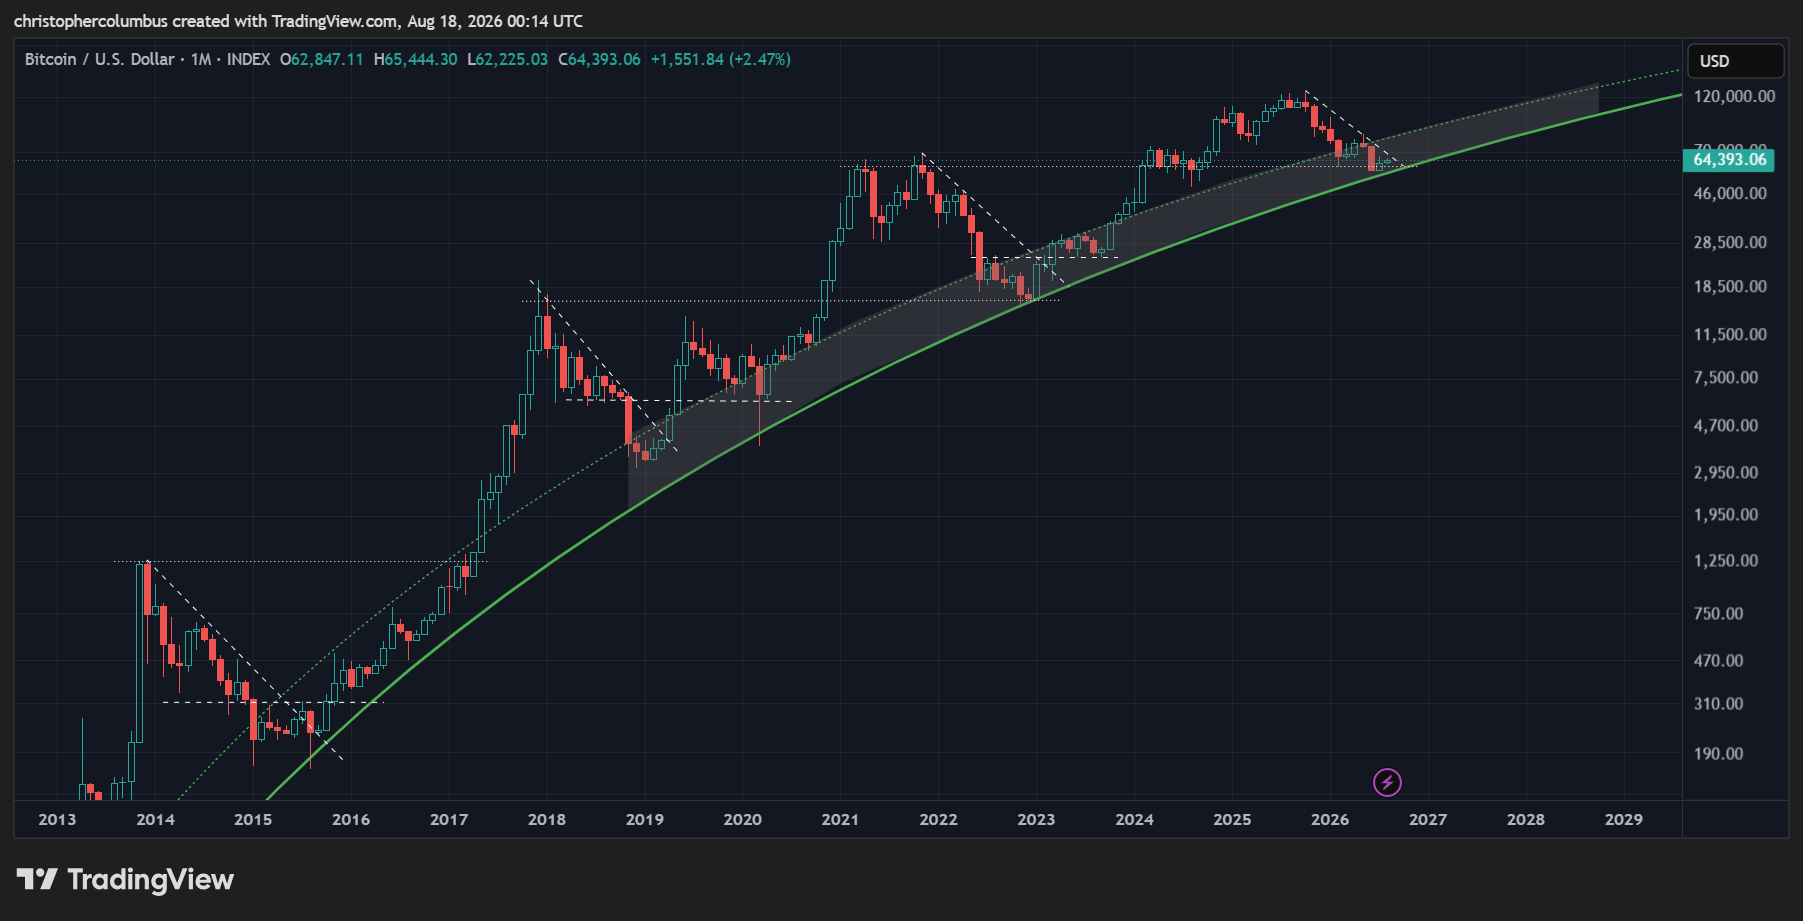
As far as technical analysis and the seeking of patterns go, the current chart has to be of interest for those bullish on Bitcoin as a long term asset [or currency]…. and of course for those that have been following the Logarithmic Growth Curve model.
To begin with a comparison of the longer-term downward diagonals of resistance. When these have broken previously, the bull market has been back on. This may sound like an obvious truism, but it is the comparison in terms of real degree on the log chart and in terms of time that is of significance here.
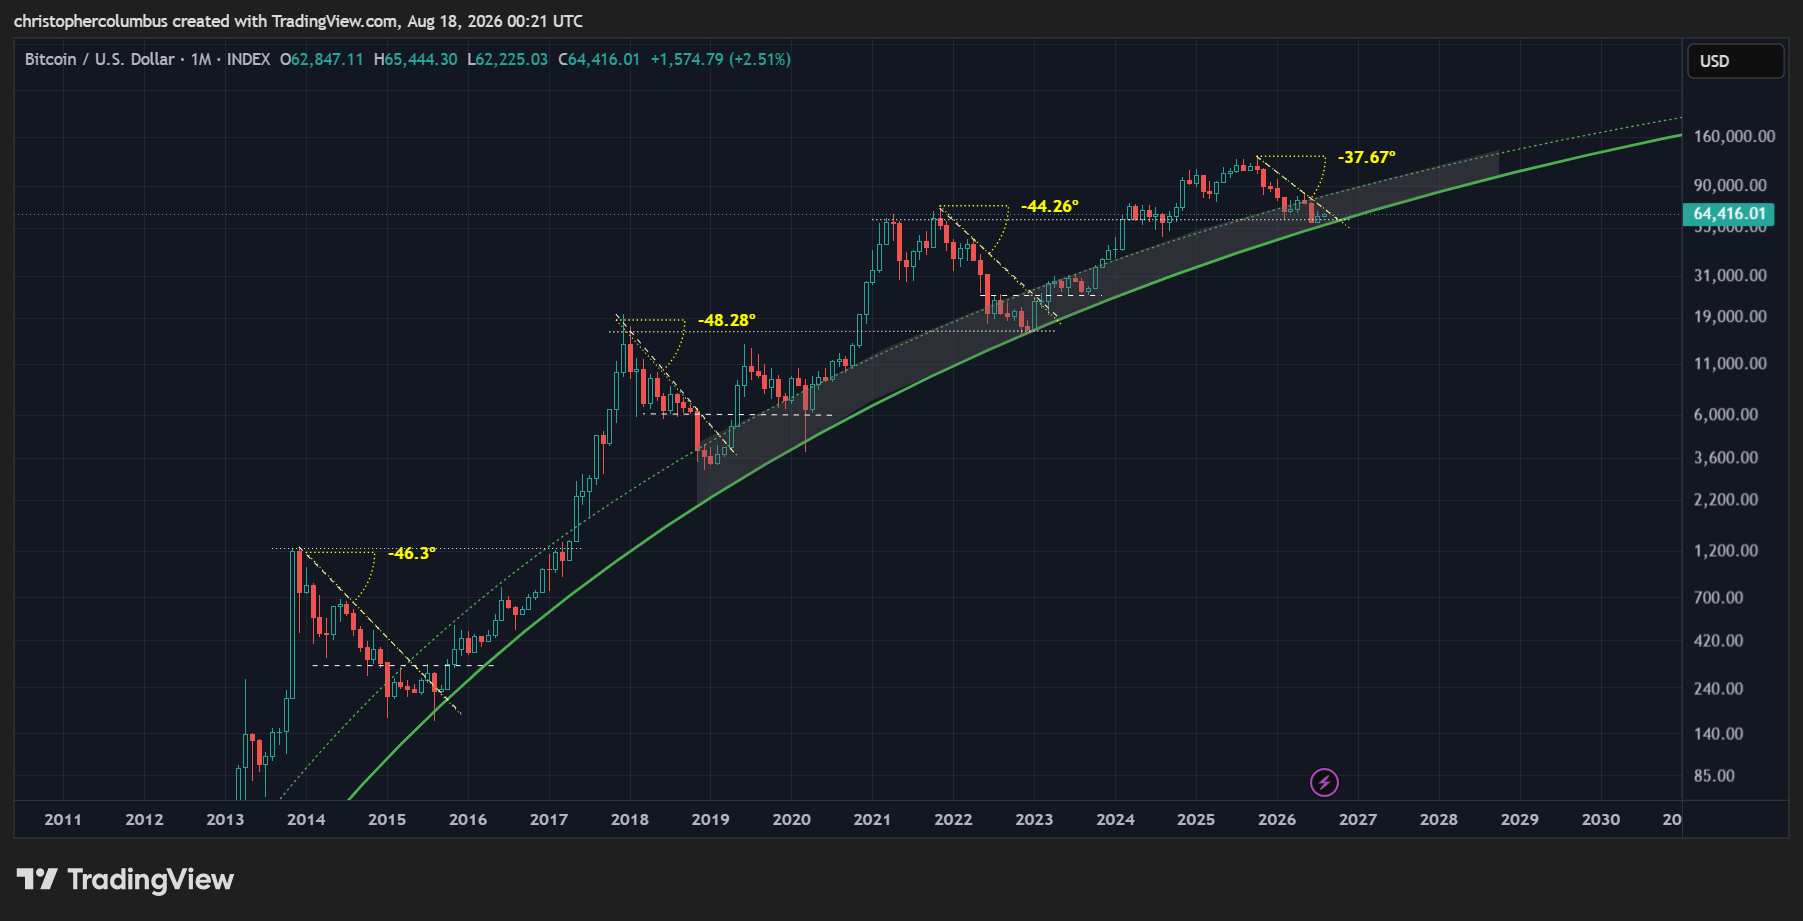
The angle of descent of the present correction is similar to those previous… while also slightly less as you’d expect in a maturing market, i.e.; reducing macro volatility.
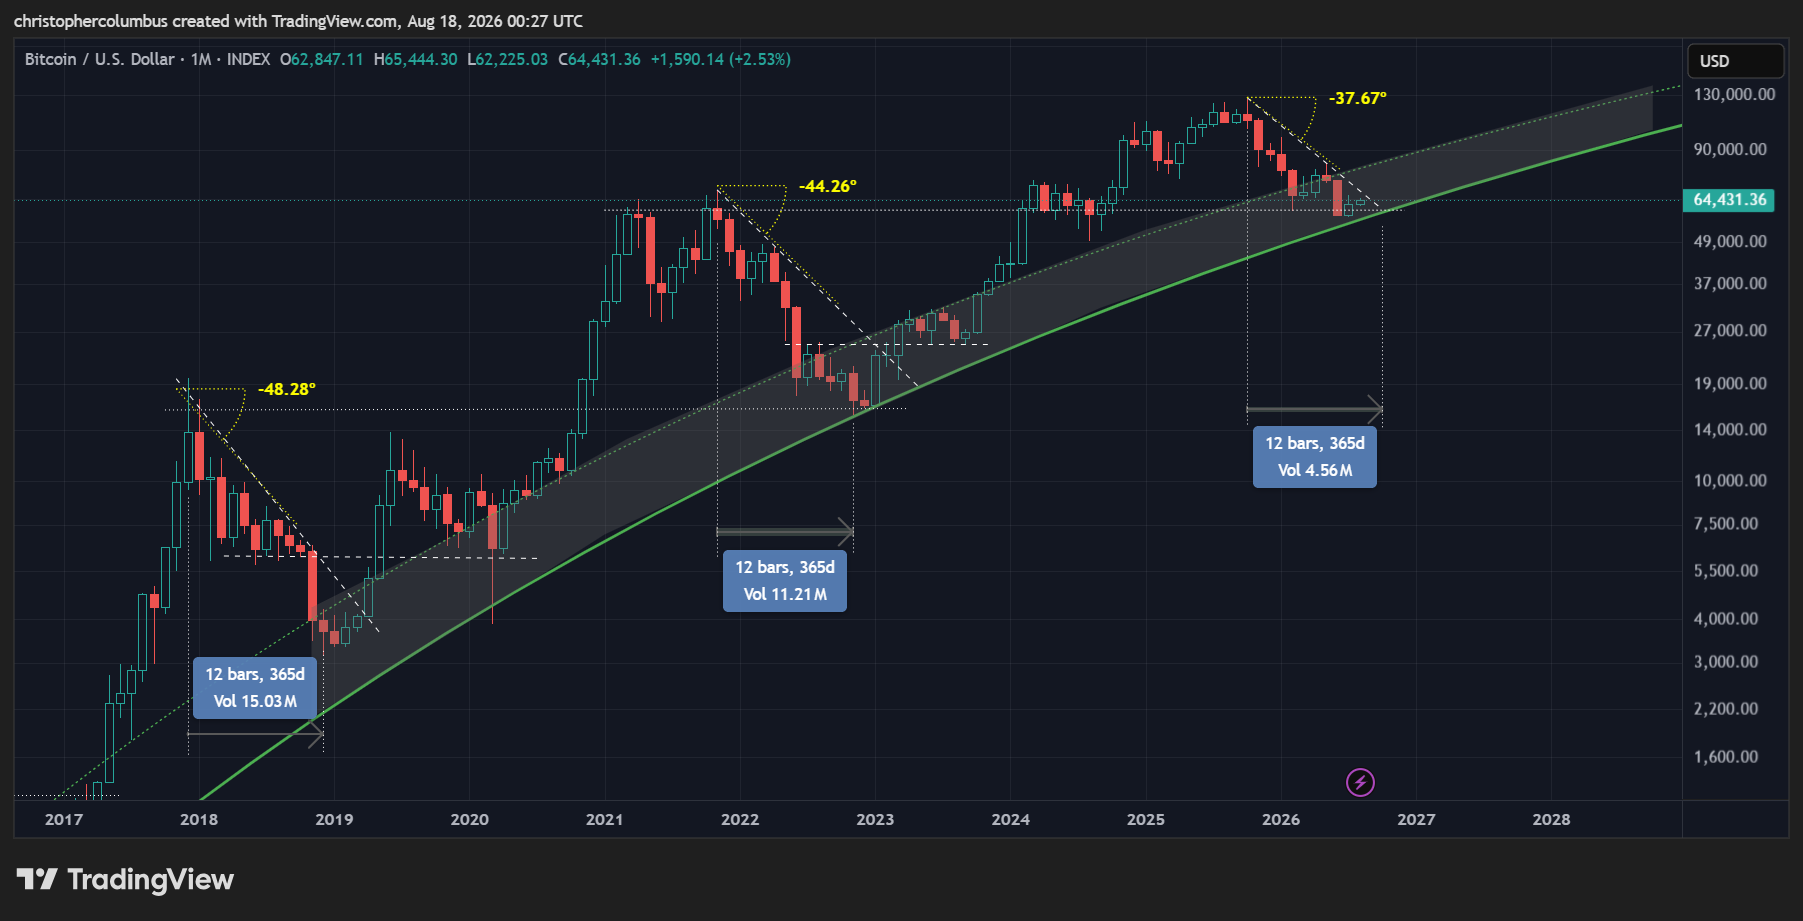
Add to this the near same period of time elapsed since the peak, and that this has previously coincided with the ‘buy zone’ of the LGC model [logarithmic growth curve], and you have a strengthened argument for a bottoming process underway. Process because we can expect, given the time comparison, another couple of months where a basing range will likely be formed.
Timewise, and if the pattern were to repeat, this would set up for a solid bounce in price over the course of the 4th quarter this year, only 2 months away [October].
Momentum
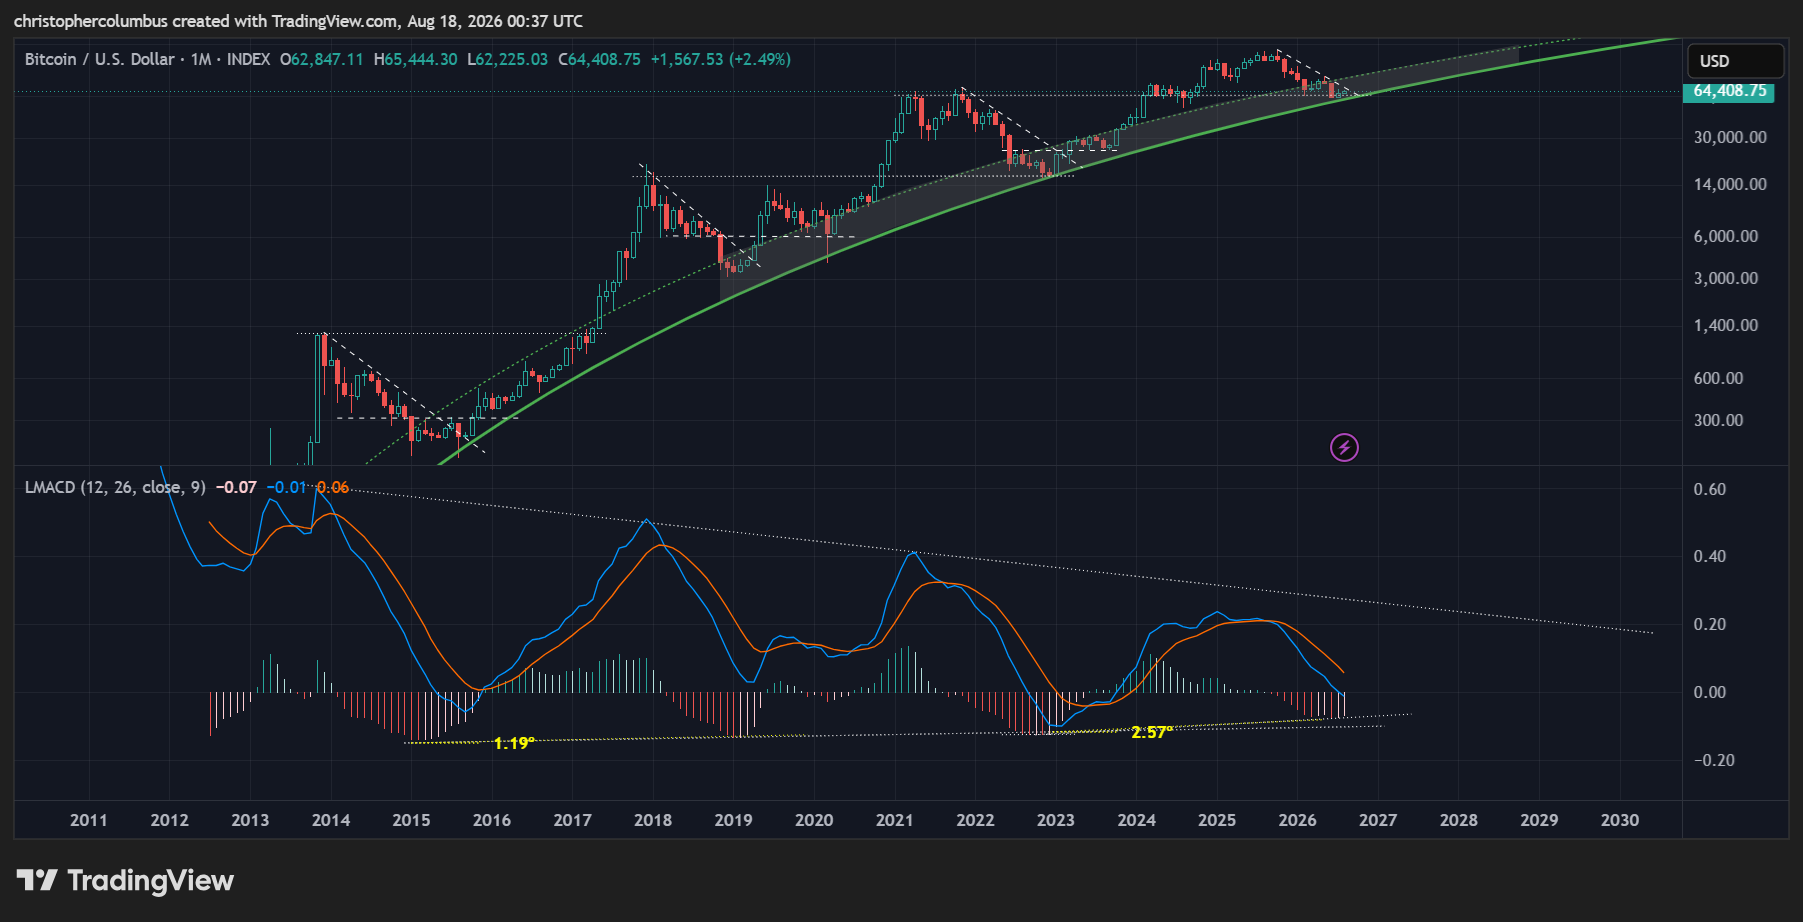
As can be seen in comparing the extension on the histograms, the comparative strength of downward momentum is weakening, i.e.; price is becoming more resistant to downward pressure in the market as measured to previous moves. Of course, in nominal terms, the move in price still seems massive, but in real terms it is reducing as Bitcoin moves toward price discovery/ capitalization on the LGC.
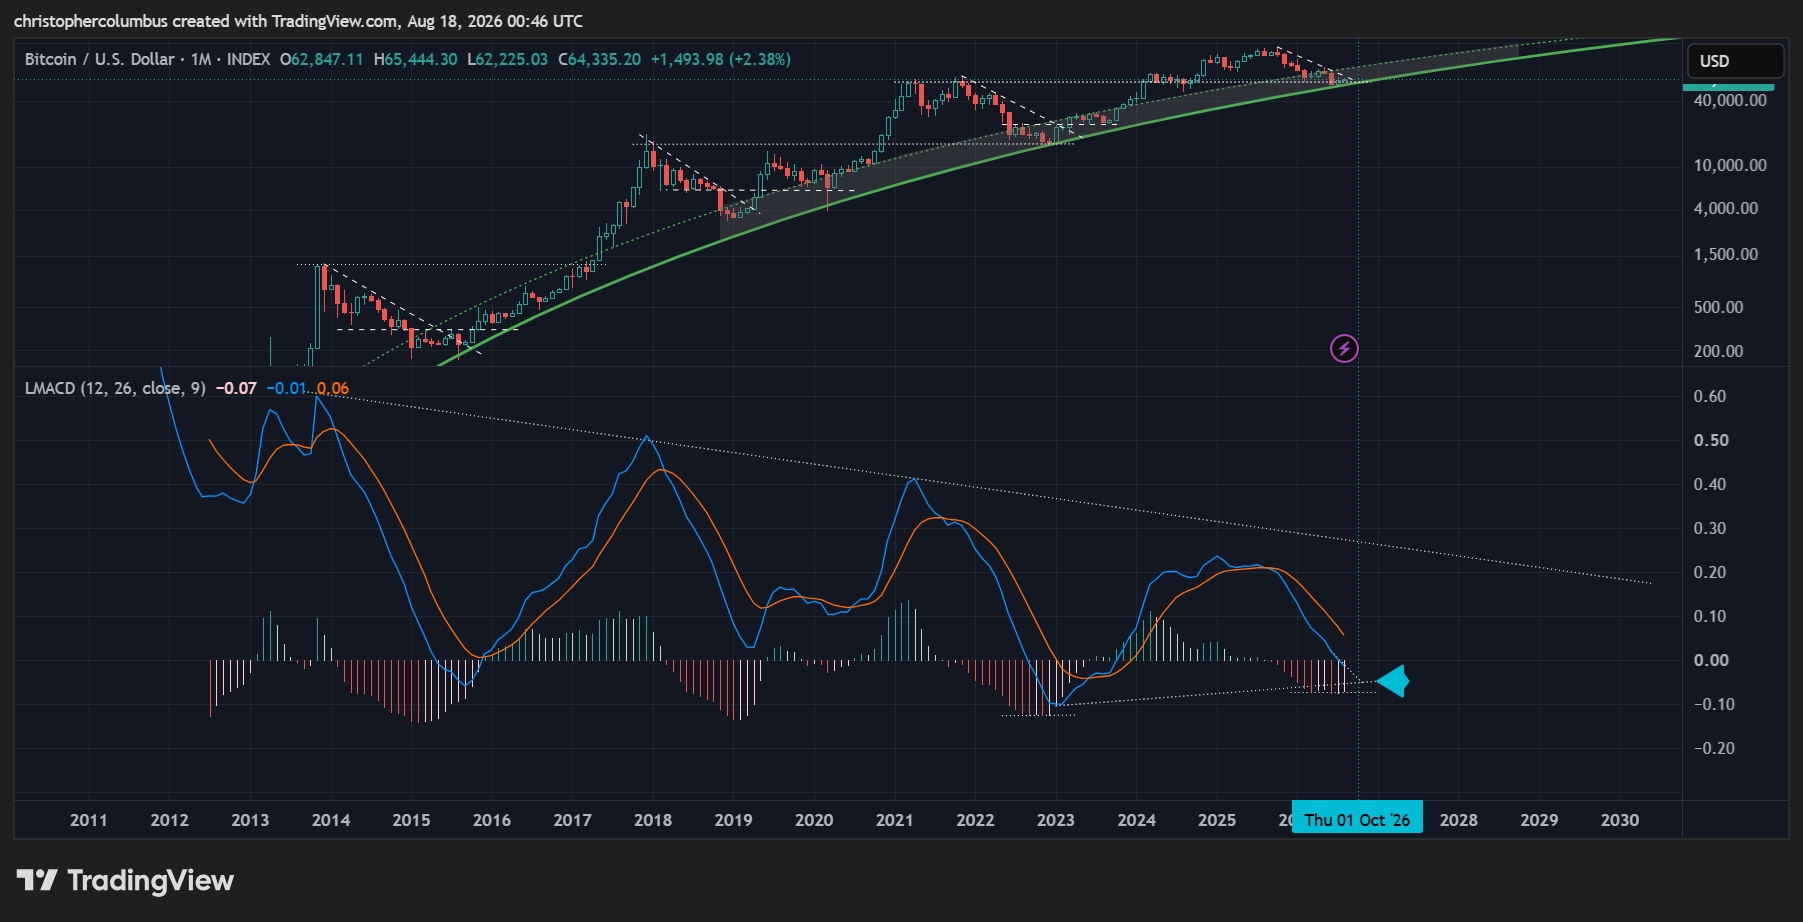
With another 2 months of consolidation factored in, a projection of the MACD would see it bottoming at a higher level as to the previous cycle. This level would also coincide with the contracting histogram [as below]. The histogram looks to be fully extended over multiple months as a base is formed.
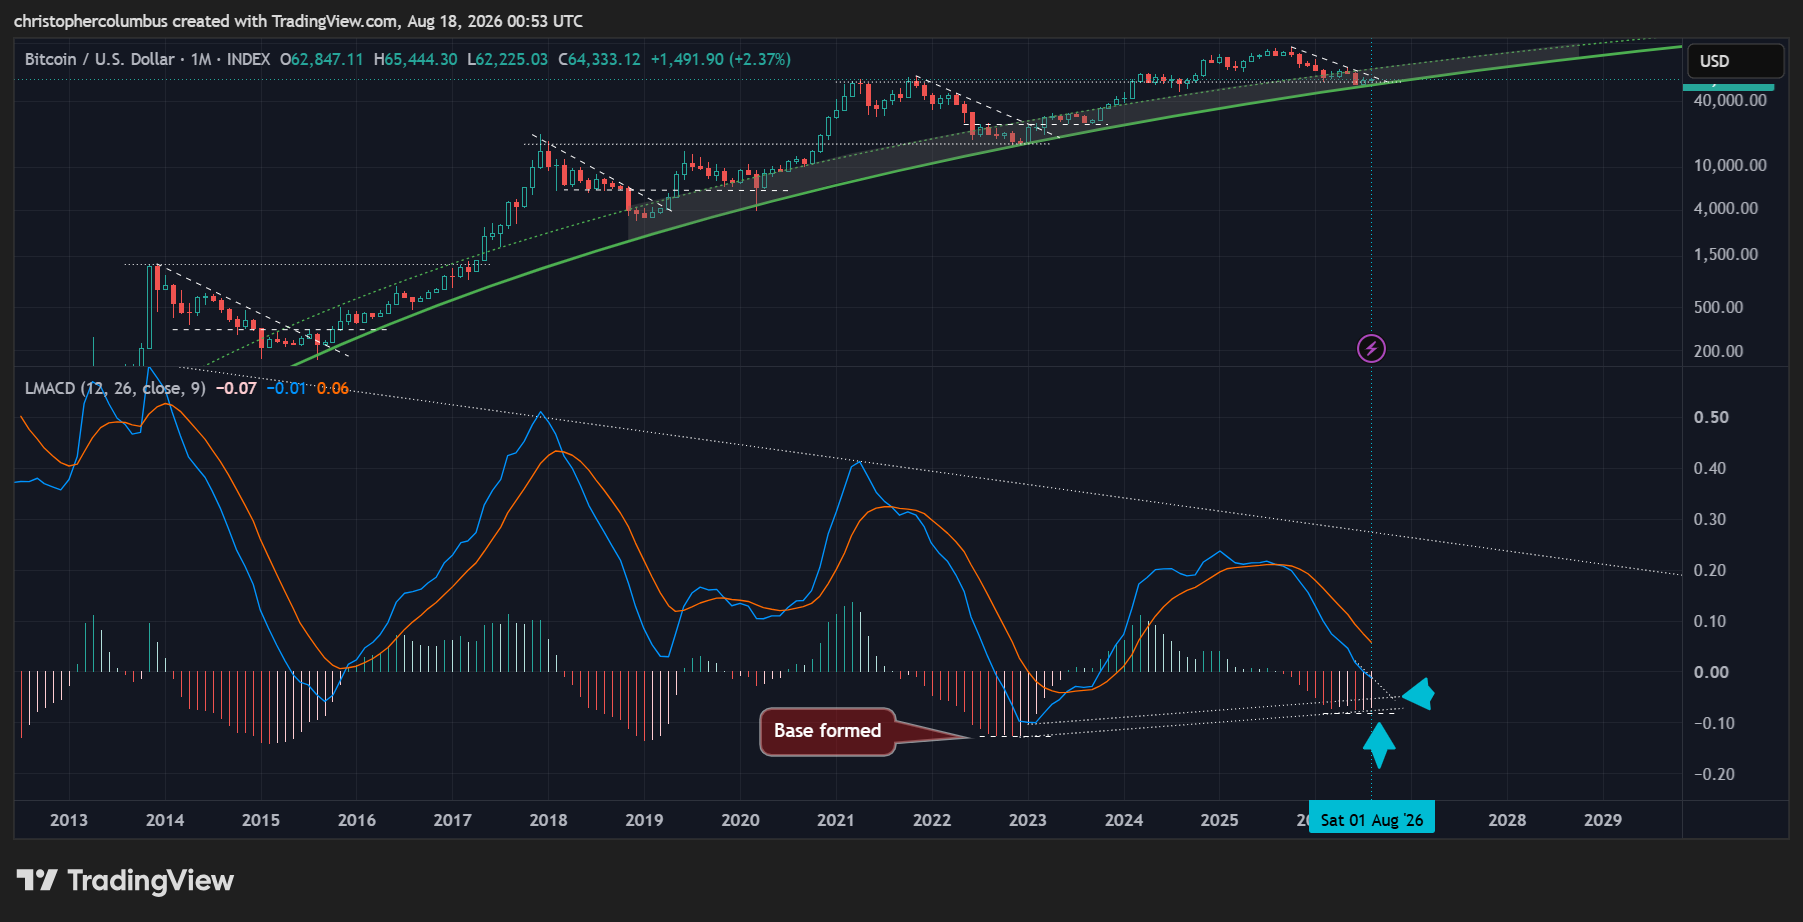
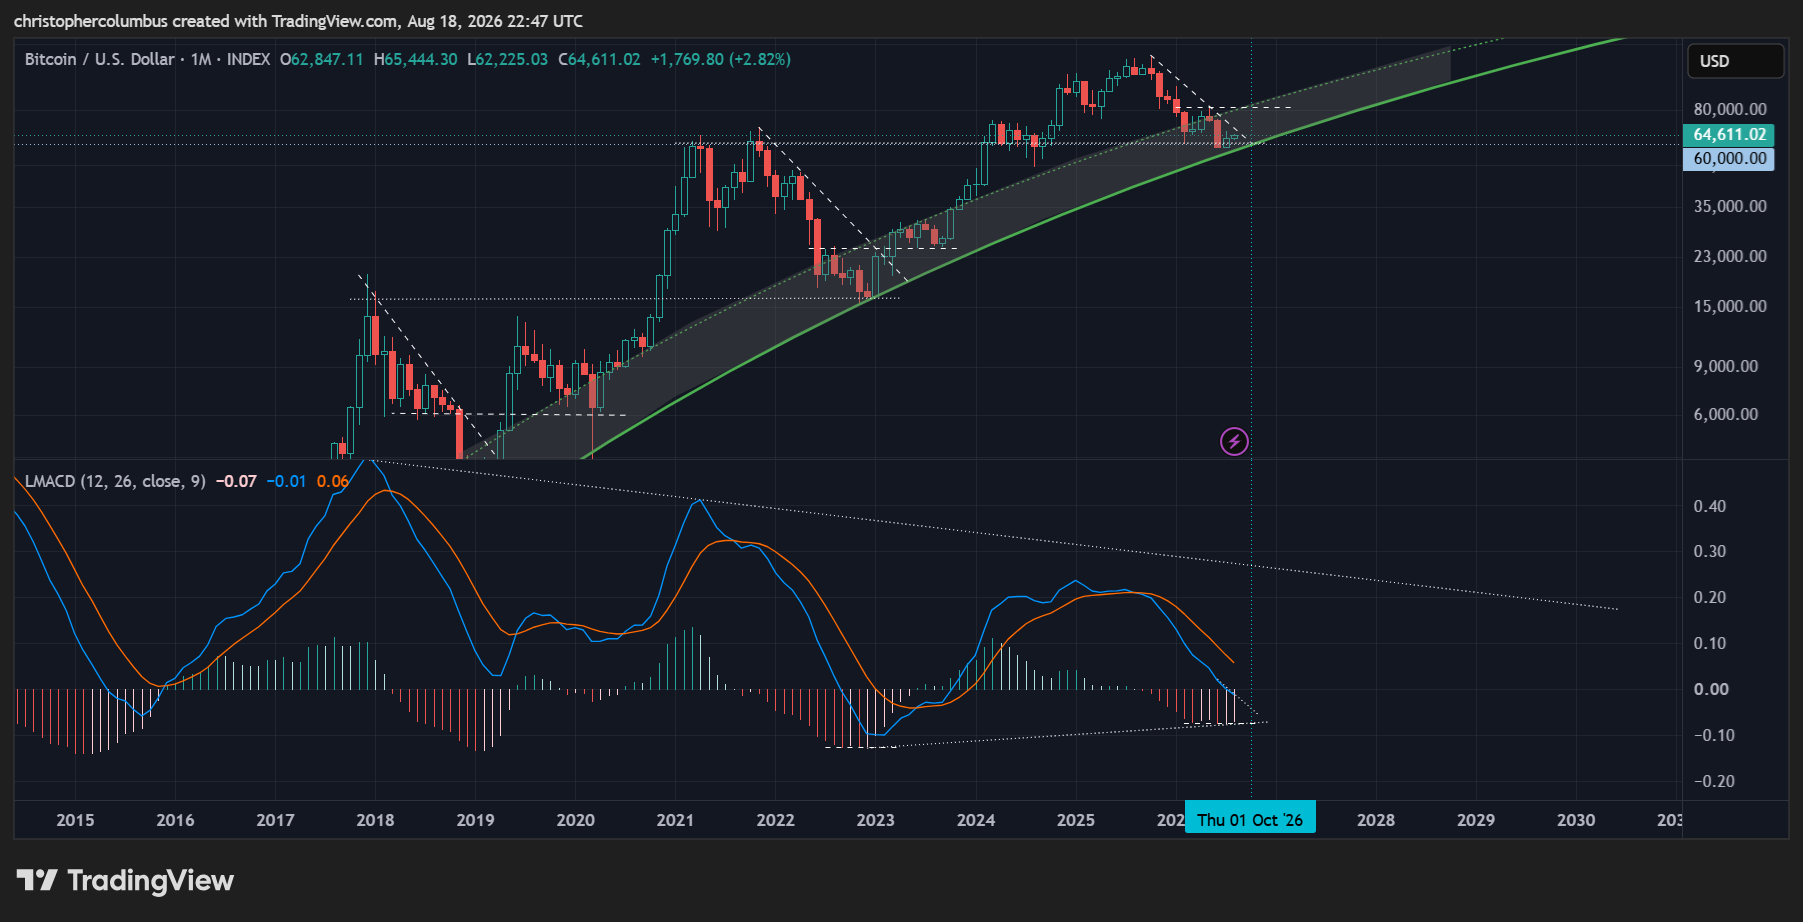
In summary, October looks like the month to watch where various technical factors line up with the MACD bottoming below the zero-line, with the longer-term diagonal of resistance meeting the base of the log growth curve, and with a solid base forming in the MACD histogram.
Until next time,
Stay [relatively] safe out there,
Dave the Wave.