
BTC Breakout?
Dear Readers,
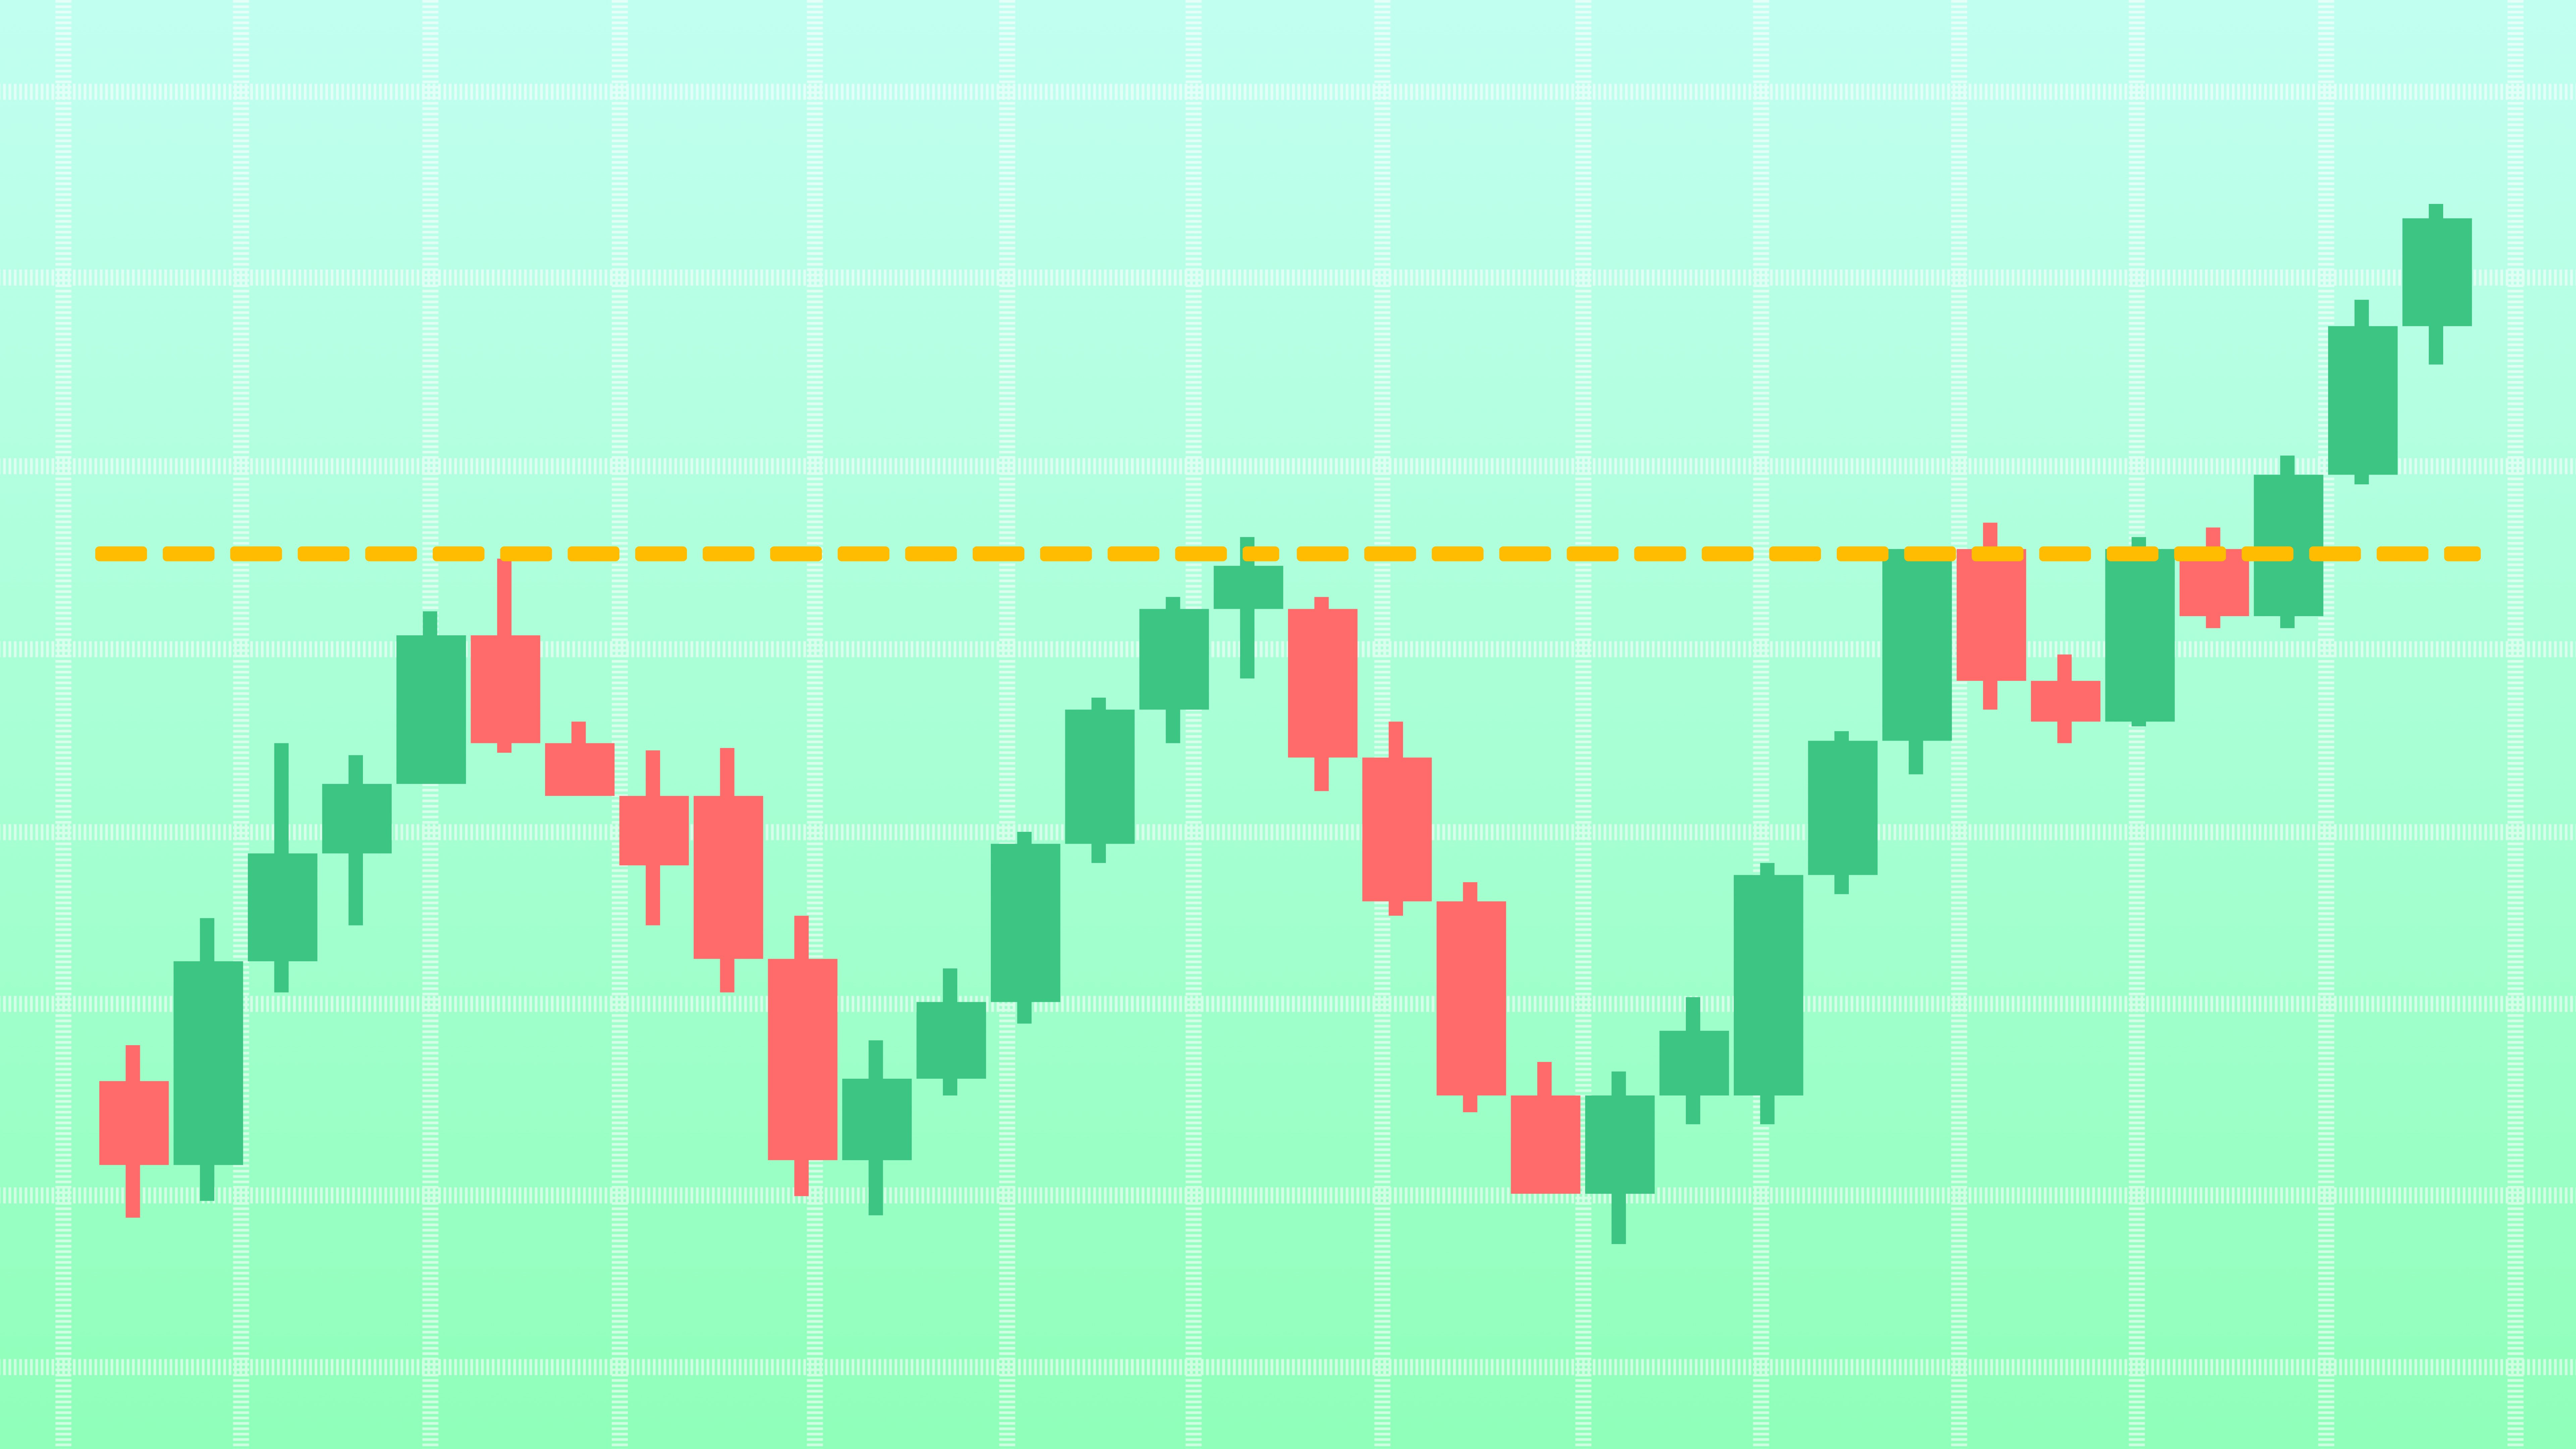
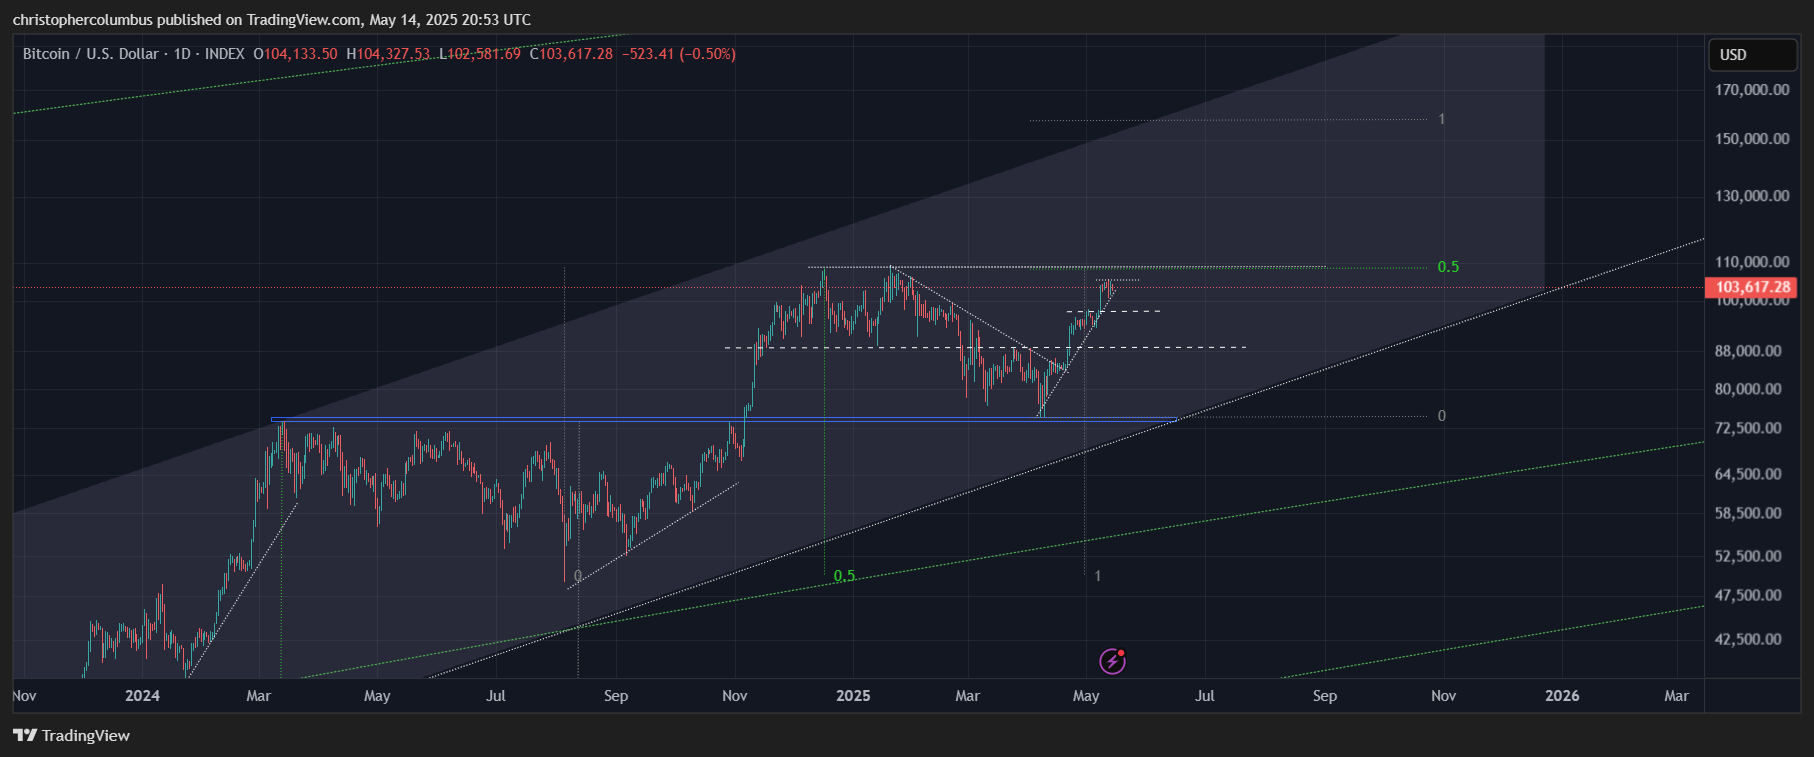
These days it seems that with every fortnight comes a new breakout in price. And this is typically the way where they say price takes the elevator up and the stairs down - price increases tend to happen rapidly, where the consolidations take place over an extended period of time. Take the following chart for example:
The consolidations create negative sentiment after the initial enthusiasm of the previous run-up wears off. And this is a process that takes place over time. Duration on the chart requires endurance in the trader/ investor. And of course, this is where the contrarian aspect comes into play - where most will allow the general market sentiment to affect their own, the contrarian sees instead opportunity in the way in which markets typically operate.
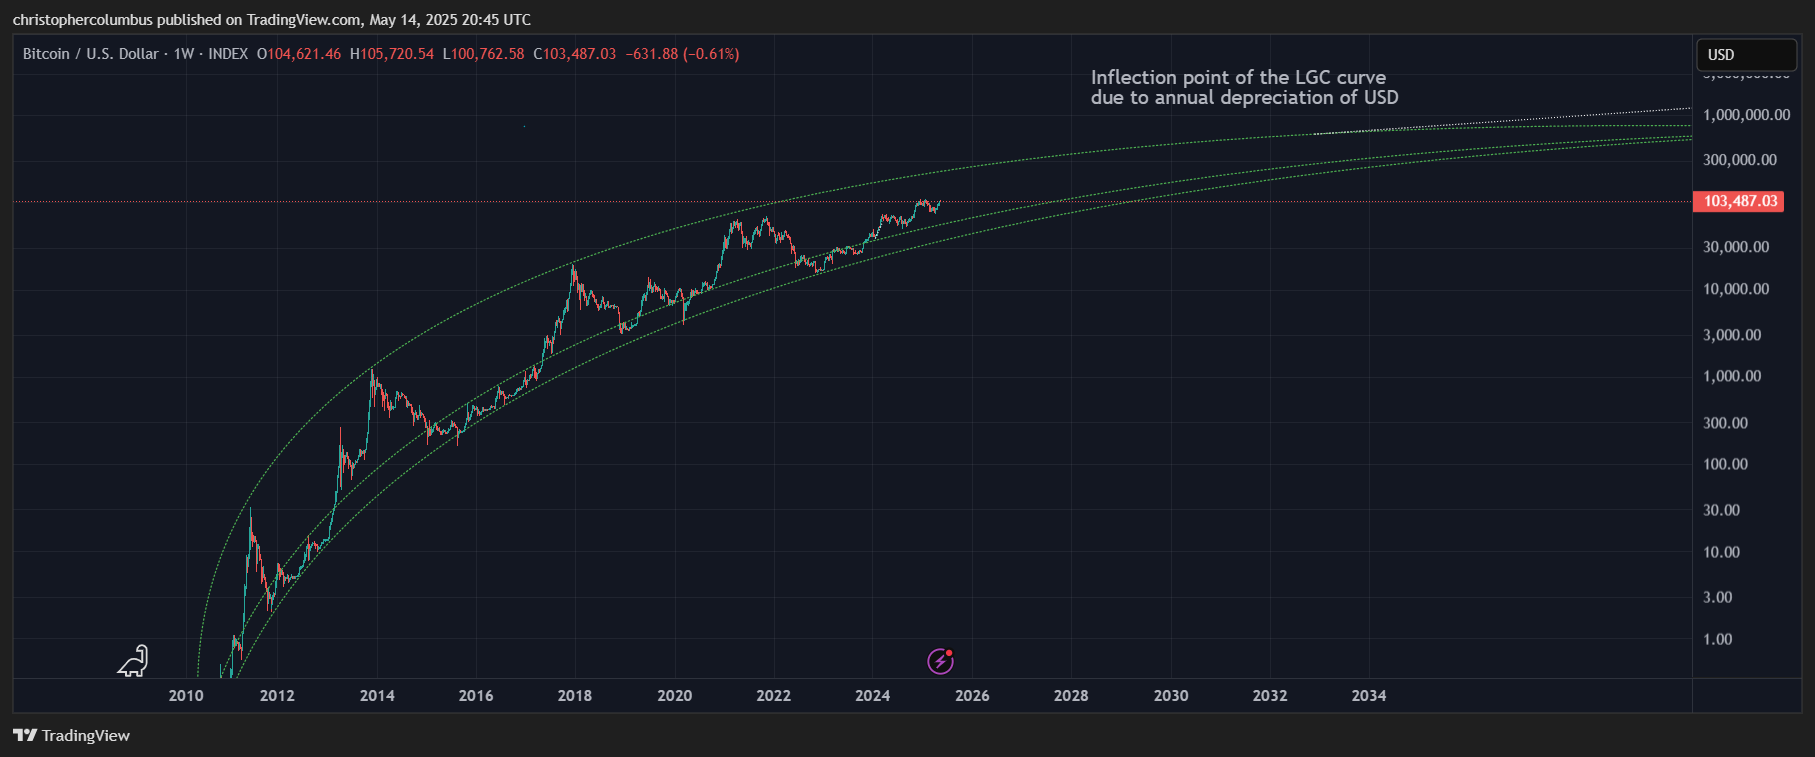
And so the run-ups come quick and fast. These are to be expected for the medium-term investor with a multi-year cycle in mind, and for the longer-term investor with the LGC [logarithmic growth curve] model in mind.
But back to the more immediate term. Of course we all want to know what is essentially the unknowable - what will price do in the short term here. All TA can do in predicting the more random movement of price in the immediate term is sketch scenarios that might make sense. In this respect, the trader is going to be more interested in shorter-term moves as opposed to the investor with either multi-year of multi-decade projections in mind.
Shorter-Term
Scenario 1
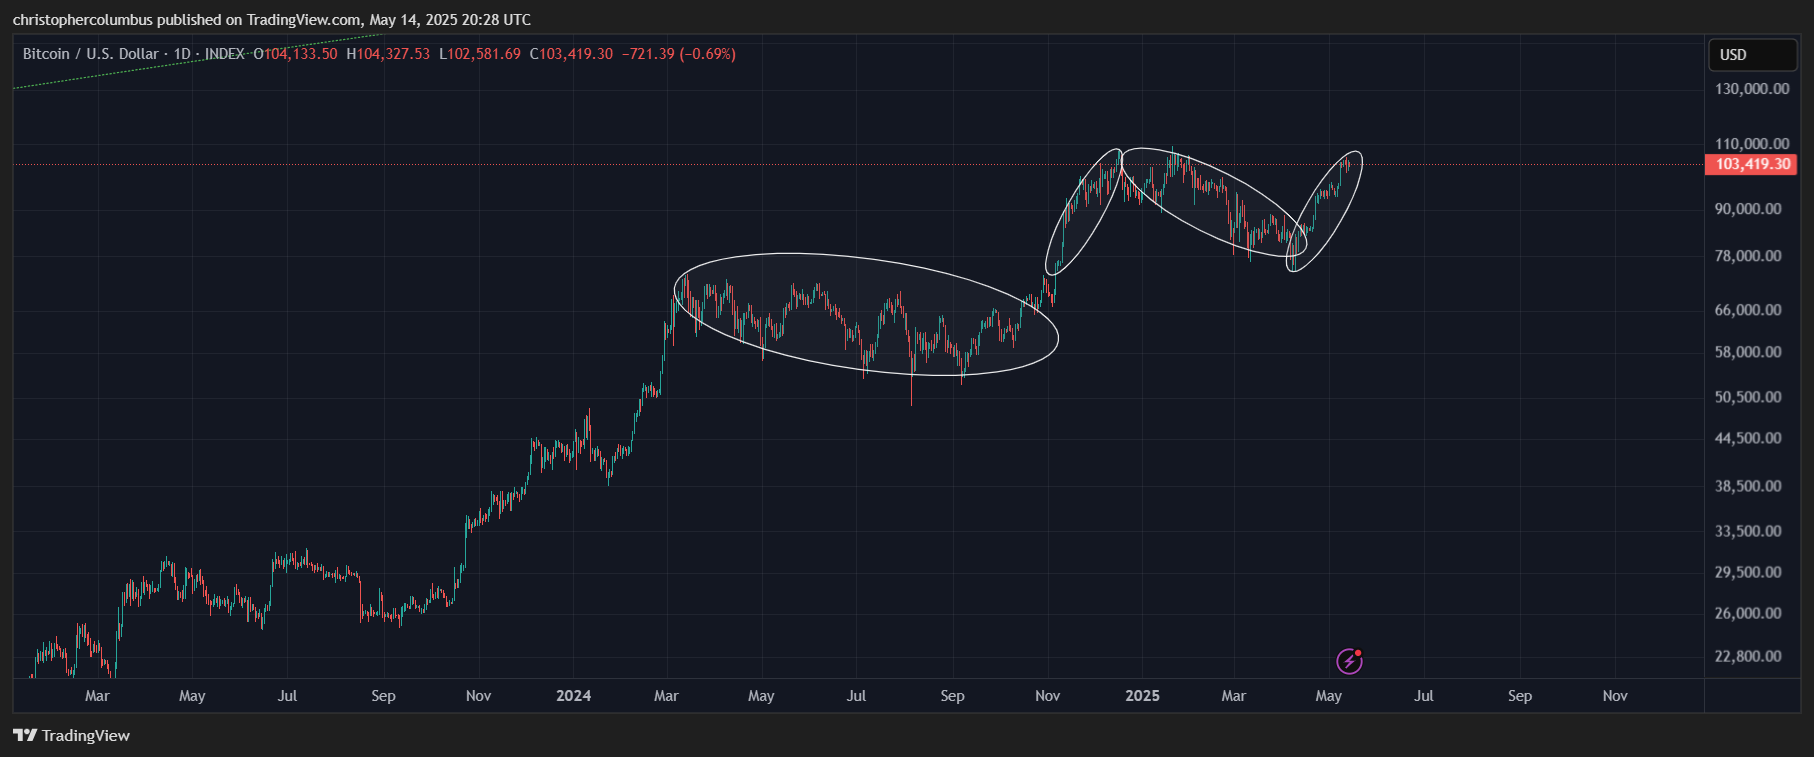
The first thing of note here is that in terms of a multi-year cycle, price is getting near the endgame - we are already half way through the year, and a 4 year cycle repetition would see it culminate at the end of this year… just a six month period going forward.
The second thing to note is that price, having moved up very sharply [taking the elevator], is now at a level of resistance [previous highs]. The big question is whether we see higher prices now or in a few months.
With resistance in mind, the dashed lines show levels of support. If price were to consolidate from here to say the second lower line of support, this would create a powerful extended multi-month reverse head and shoulders pattern that would set up nicely for that final explosive move to new highs later in the year.
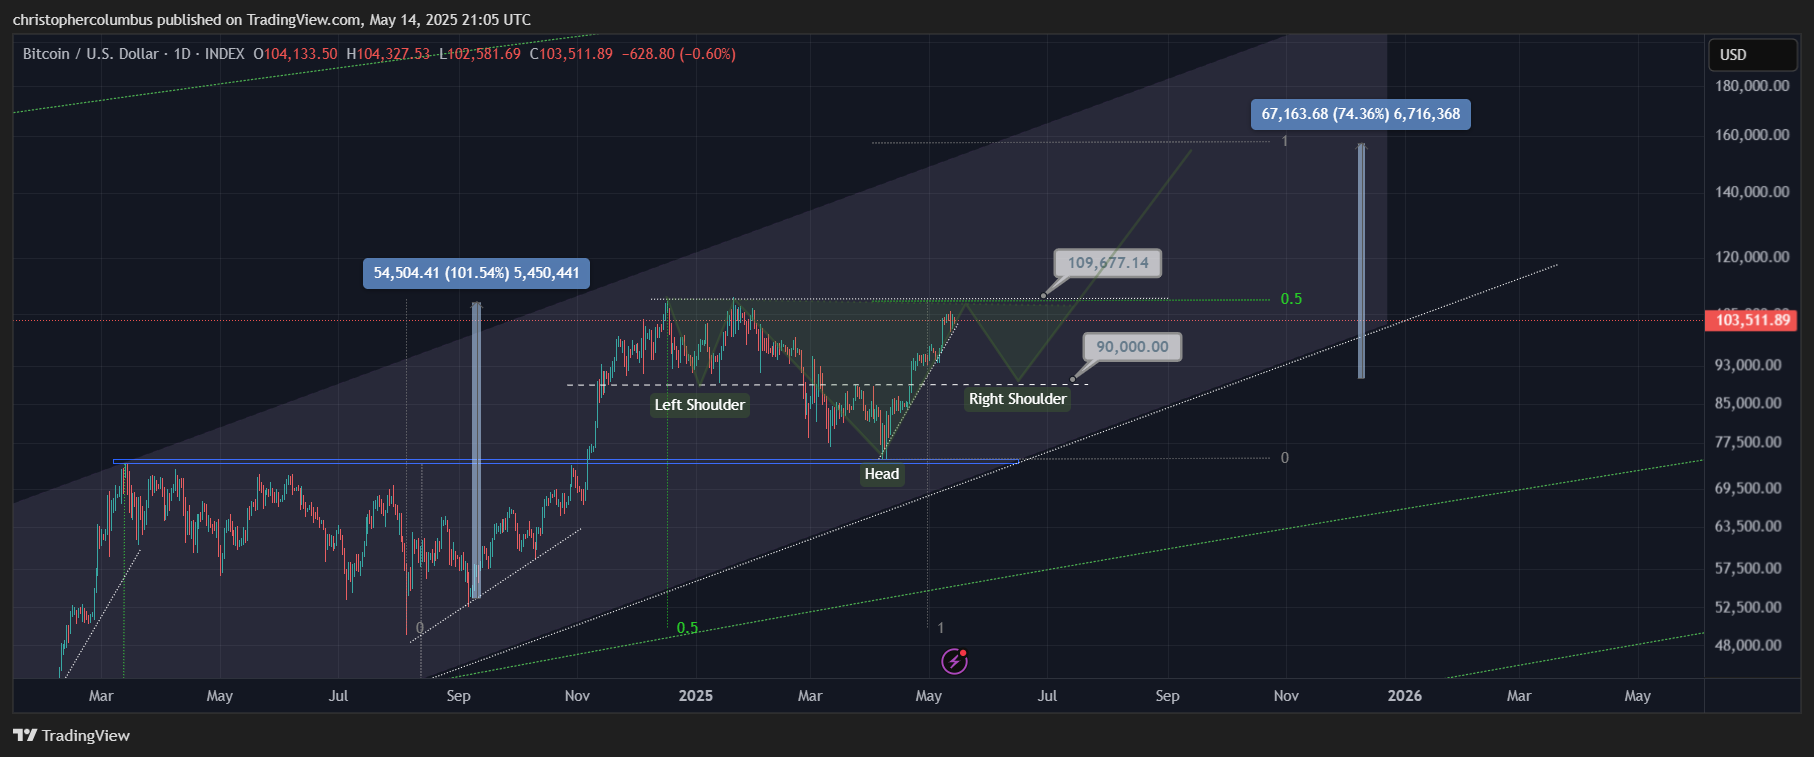
As a practitioner of TA, this would be my favored scenario, where market price would build a solid platform for that large move going forward. Also of interest to note here is that it is a purely technical move not involving a parabolic manic spike [a maturing market]…. though a move like this would no doubt create some excitement. The 160K target as projected is only a 74% increase from 90K as compared to the 100% move late last year. Very doable.
Another point to keep in mind is that bull markets climb a wall of worry, and this scenario would be the most frustrating one for those looking for higher prices in the here and now. From a contrarian perspective, a positive.
Buyers of the alts may no doubt be a little alarmed with this scenario, but though the possible nominal decline is large in numerical terms [13K odd], in percentage terms it is quite modest - 10%. This would have an effect on the alts, but not a devastating one in my opinion. With the alts already seeing a solid move up, there is plenty of room where a right shoulder formed in BTC [to 90K] would see many of the alts re-testing their lows, i.e.; the lows would already be in. This would be a good time to layer into positions should you want to add an extra layer of speculation to your Crypto investments/ trades.
Scenario 2
If scenario 1 was the ‘bad news’ scenario, scenario 2 is the good news one - higher price here and now front-running the more technical scenario of a reverse head and shoulders. Once again half expect the unexpected. Just as the market tends to take an overly extended period of time in the consolidation as relative to the run-ups, exhausting market psychology, so too do the run-ups happen quicker than most expect. Before you know it all time highs are registering, and by the time most market participants are finally on board with it, the market is becoming over-bought and over-extended.
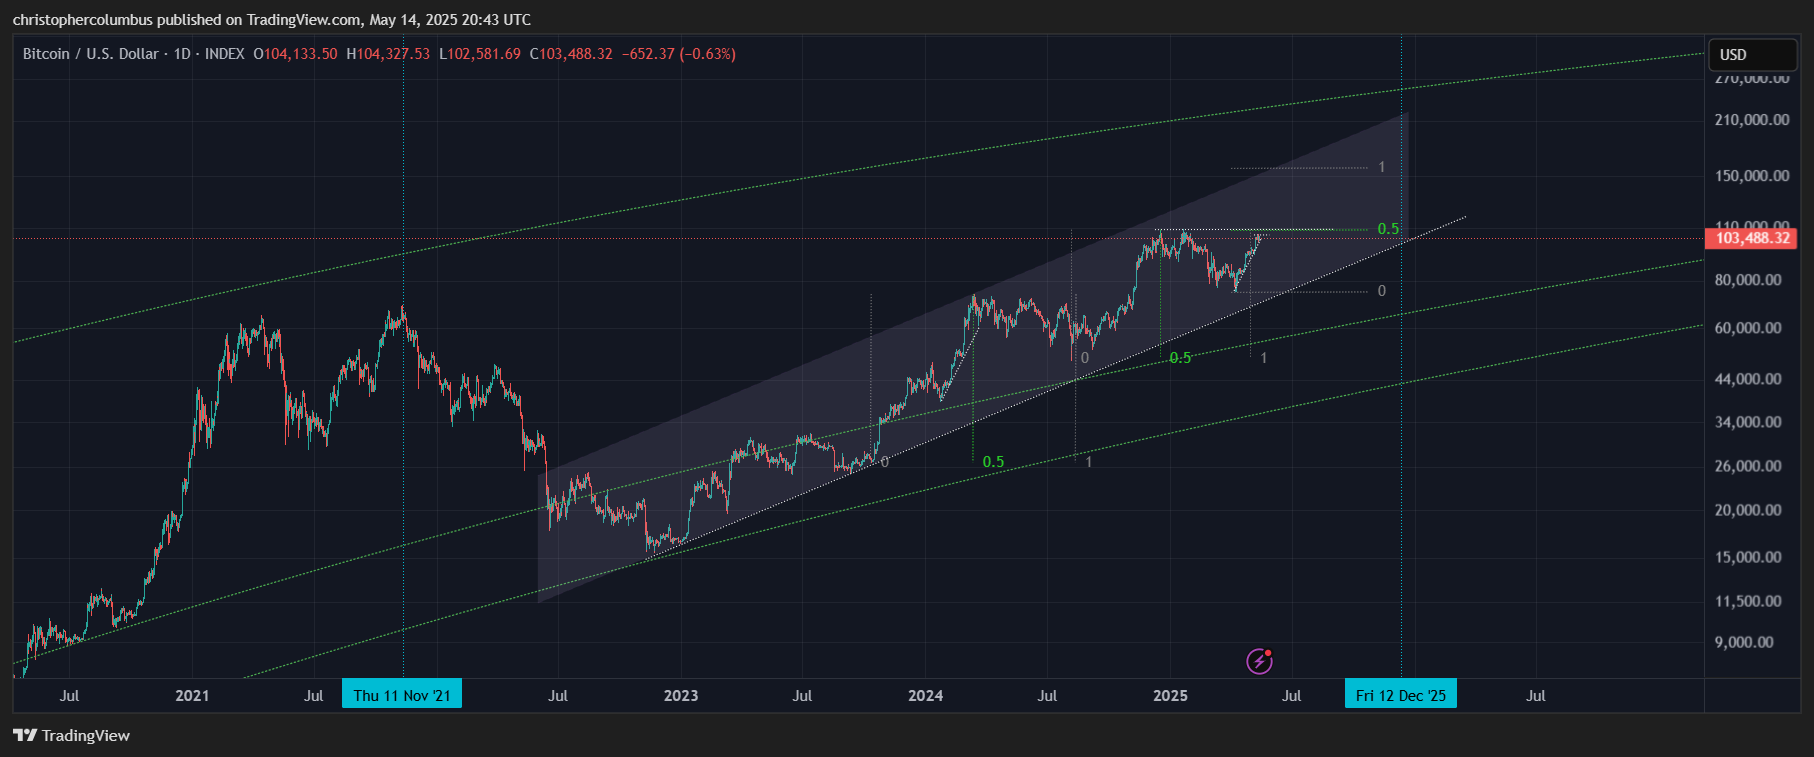
In this scenario, price would stay relatively strong and on breaking resistance at previous all time highs, go on a technical run to that 160K level [the extended fib].
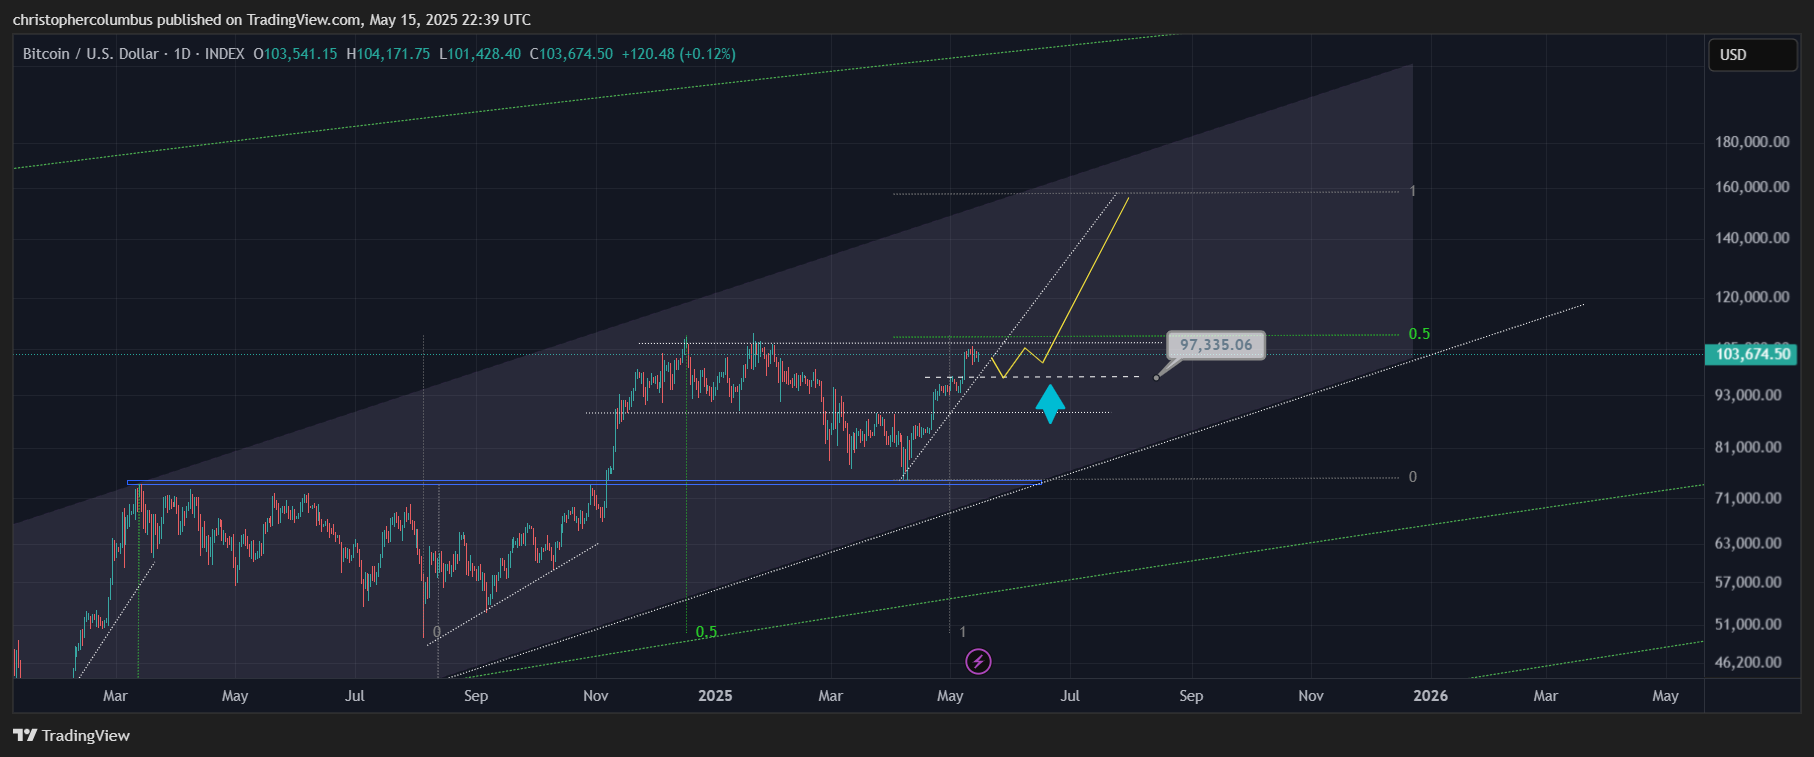
In this scenario, the market would largely be taken by surprise. It has only been a month since price was at 75K after an extended grind down. the negative sentiment created has hardly worn off… even with price now pushing the highs [just consider that enthusiasm is not what it was on the run up to these levels in late 2024 - we have got ‘used to’ the price] . A further run from these levels is perfectly feasible, and could well culminate in a couple of months.
Indeed, it pays to keep an eye on previous runs in this multi-year cycle. Ones that would be commensurate with a run to 160K from here.
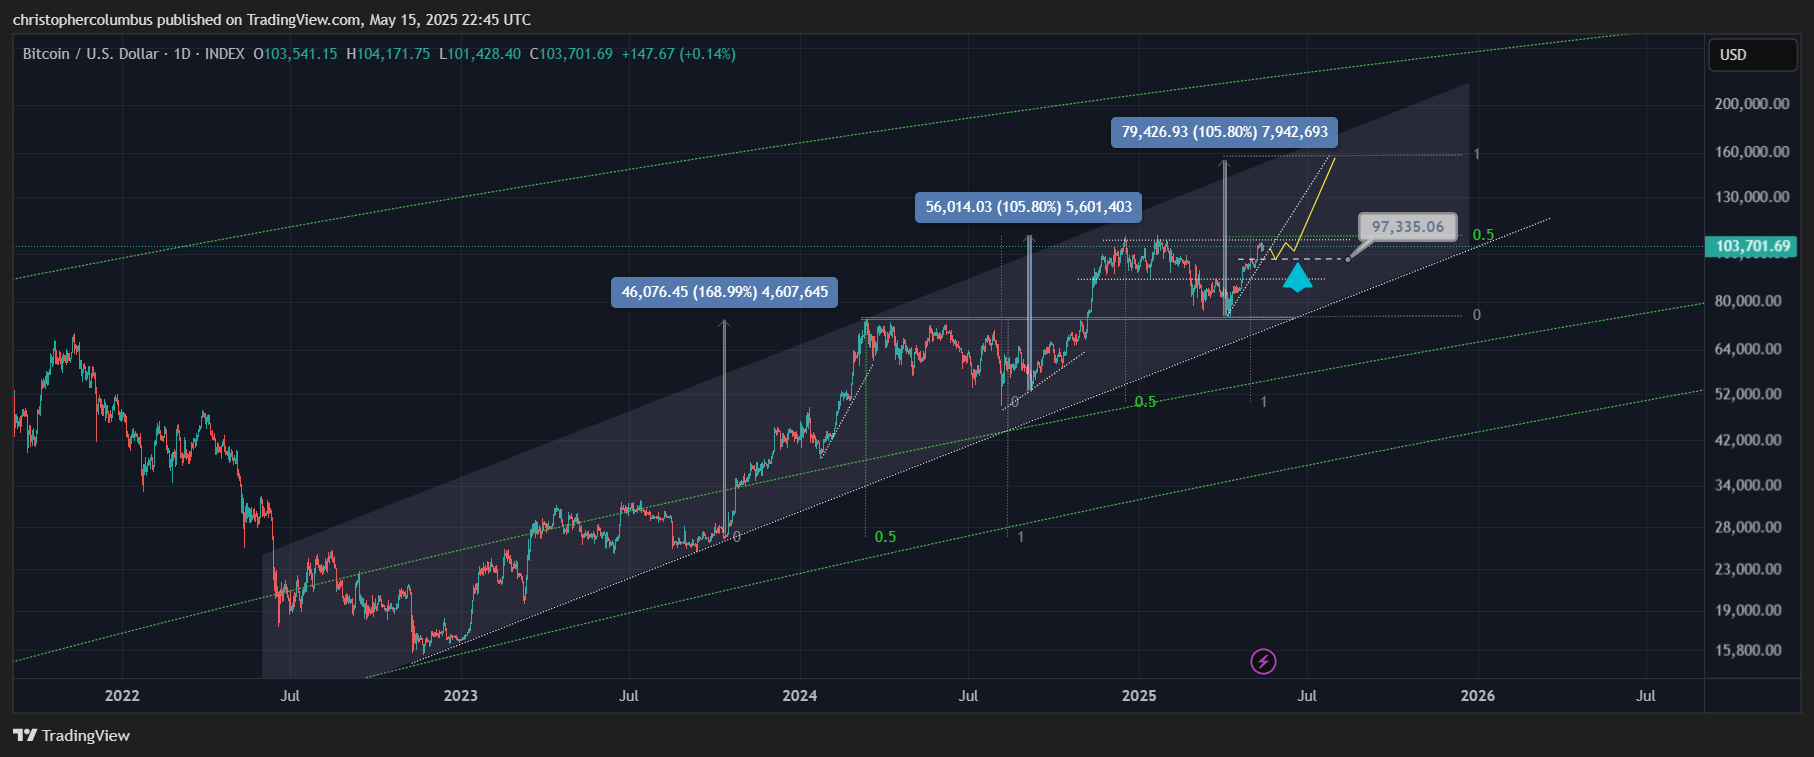
In sketching the above two scenarios I’ve sought to give some plausible outcomes in a continued bullish market. This obviously does not exhaust all scenarios, where price could either break the upward channel to the upside, or break down altogether toward the base of the logarithmic growth curve model, the ultra bullish and the ultra bearish scenarios.
Rather, I’m looking here to provide two likely and moderate outcomes that take as their basis the continued default position of a multi-year bull market. There is as yet no reason to be bearish both from the technical perspective, and a multi-year cycle perspective. Indeed, on the basis of those, price is right where it has been predicted to be since some time back now. Given that those earlier predictions have performed well, some confidence can be given to these present day predictions in my opinion. I say some confidence for as trader/ investors we should also always hedge.
Until next time,
Stay [relatively] safe out there,
Dave the Wave.