
BTC Chart Update
Dear Readers,
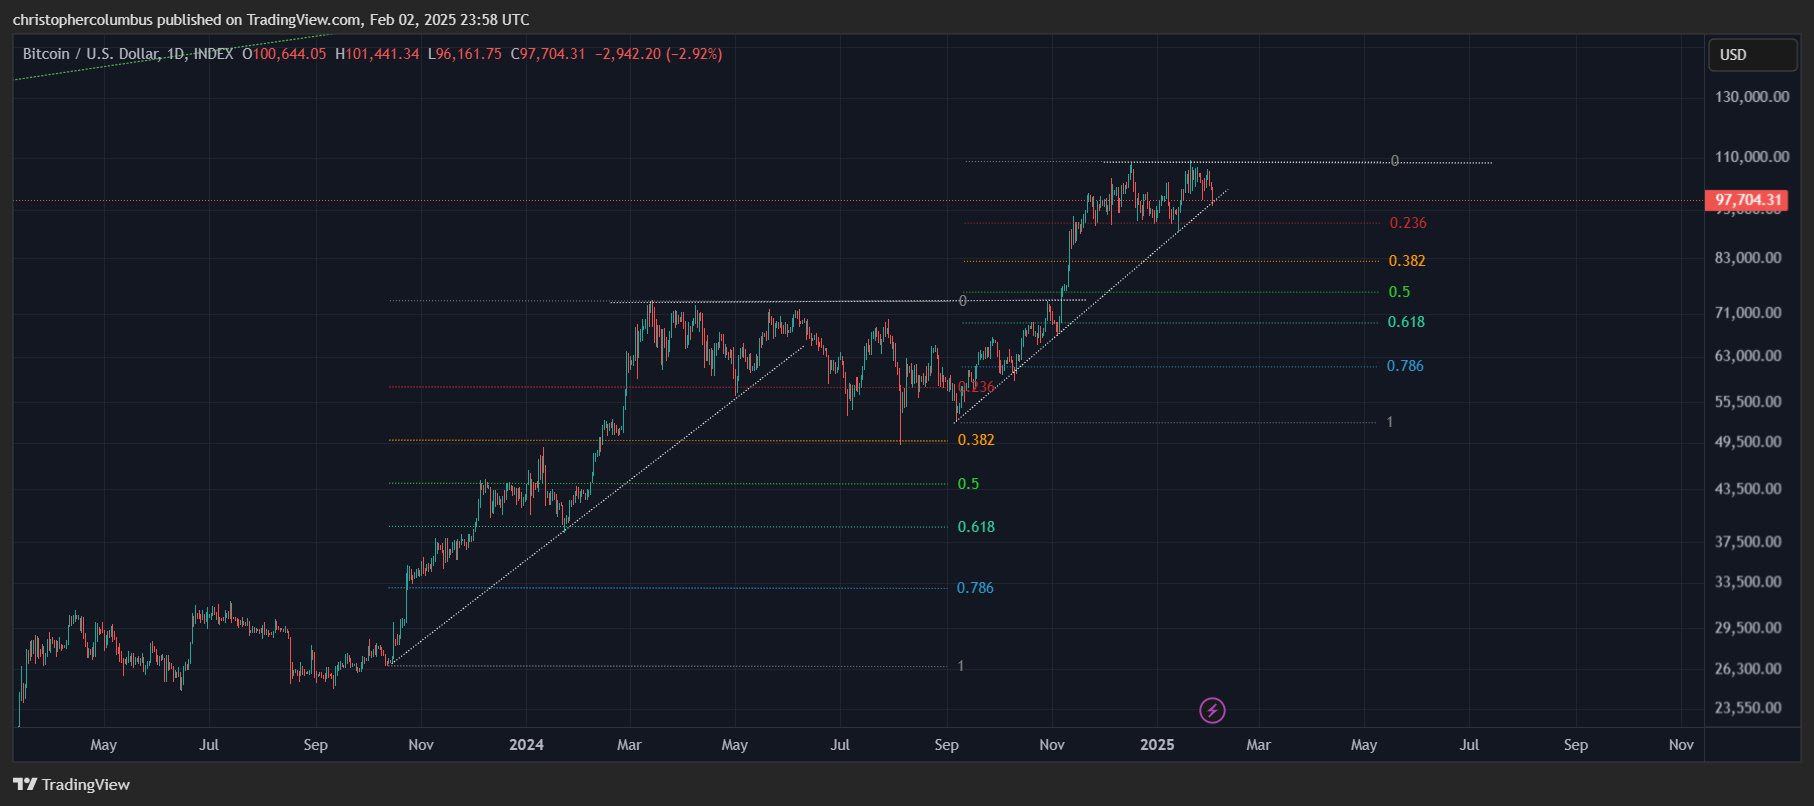
It seems an interminable age as we wait for BTC to complete its cyclical high. Time and again, the upper range is tested only to meet further resistance. In terms of the immediate desire to see higher prices, it is frustrating. Yet in technical terms, where market time moves at a snail’s pace as comparable to our perception of time, all is Bitcoin normal - a multi-month range, as per the previous, still looks to be the order of the day.
But Dave, the reader might ask, what about the abnormal political/ economic environment that seems to be developing. And this would be to raise an interesting point.
On the one hand, I consider the chart to have an autonomy, a separation and logic of its own, that brackets out all the ‘news’ that all too often serves to distract. On the other hand, one eye is always kept on the larger macro-economic picture, and all technicals are hedged against… given the uncertainty principle where anything can happen.
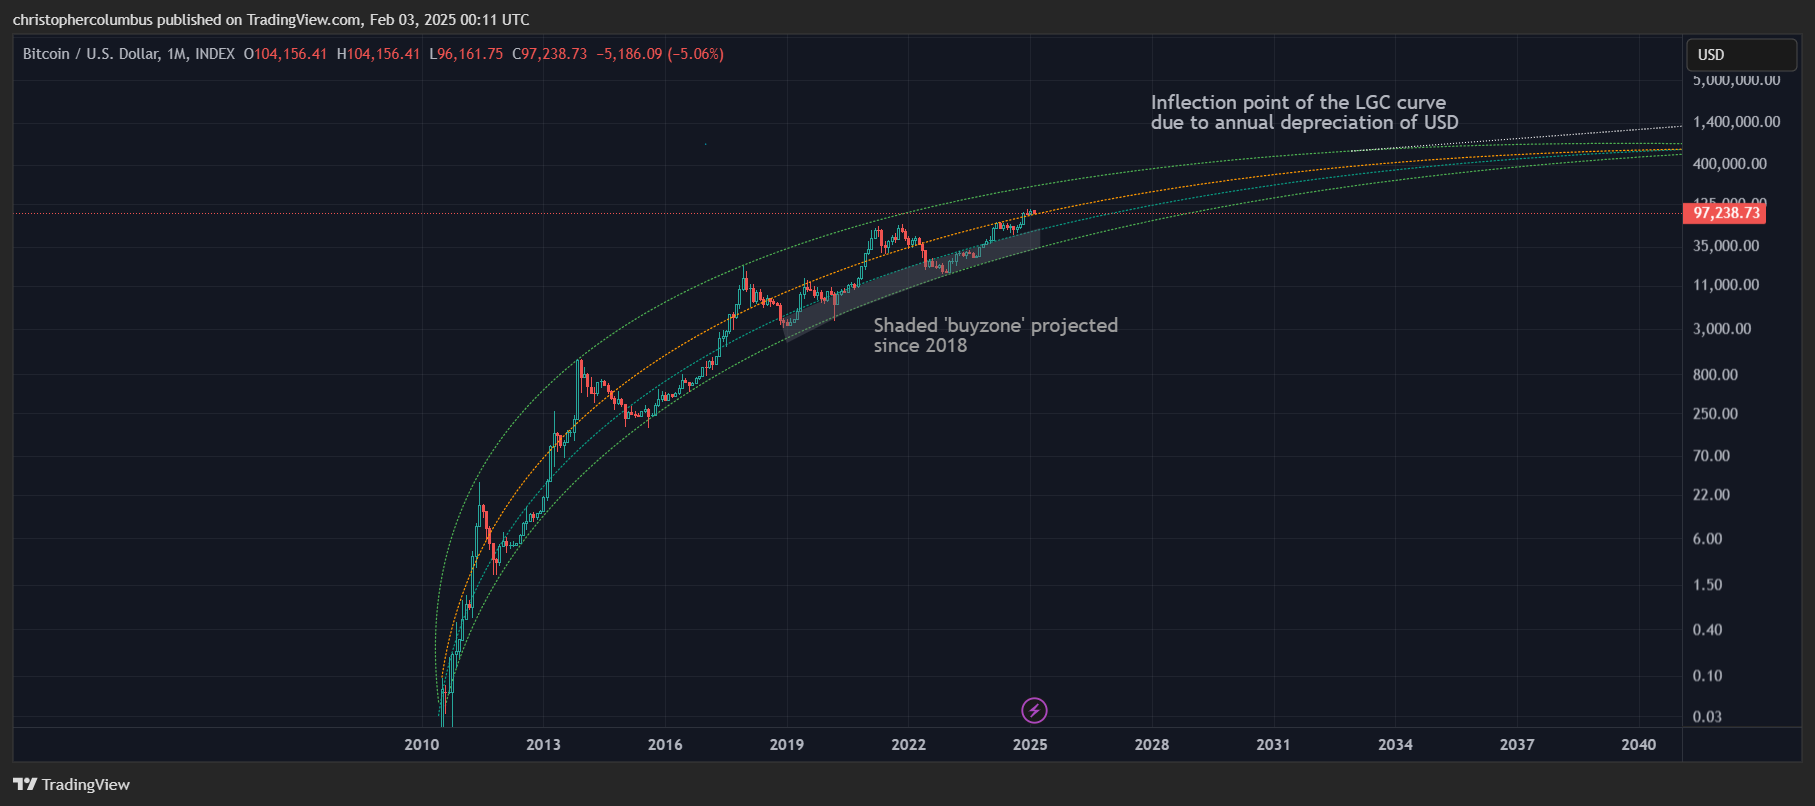
But even in this later scenario, Bitcoin as digital gold, is itself a hedge. And when bought as a hedge, volatility to the down side in some liquidity event should only prove temporary. The investor in Bitcoin, or the hedger that buys it as they would gold [insurance] has the long term chart before them. where BTC is in the process of capitalization as an alternative currency…. something with which to hedge USD itself.
But of course, most readers are going to be interested in what price will do in the more medium term, as opposed to shorter term volatility on the one hand, and longer term capitalization on the other. For in the medium term, in the not-too-distant future, most are looking to take some profit. And so the shorter-term is in turn overlaid onto a multi-year cyclical chart.
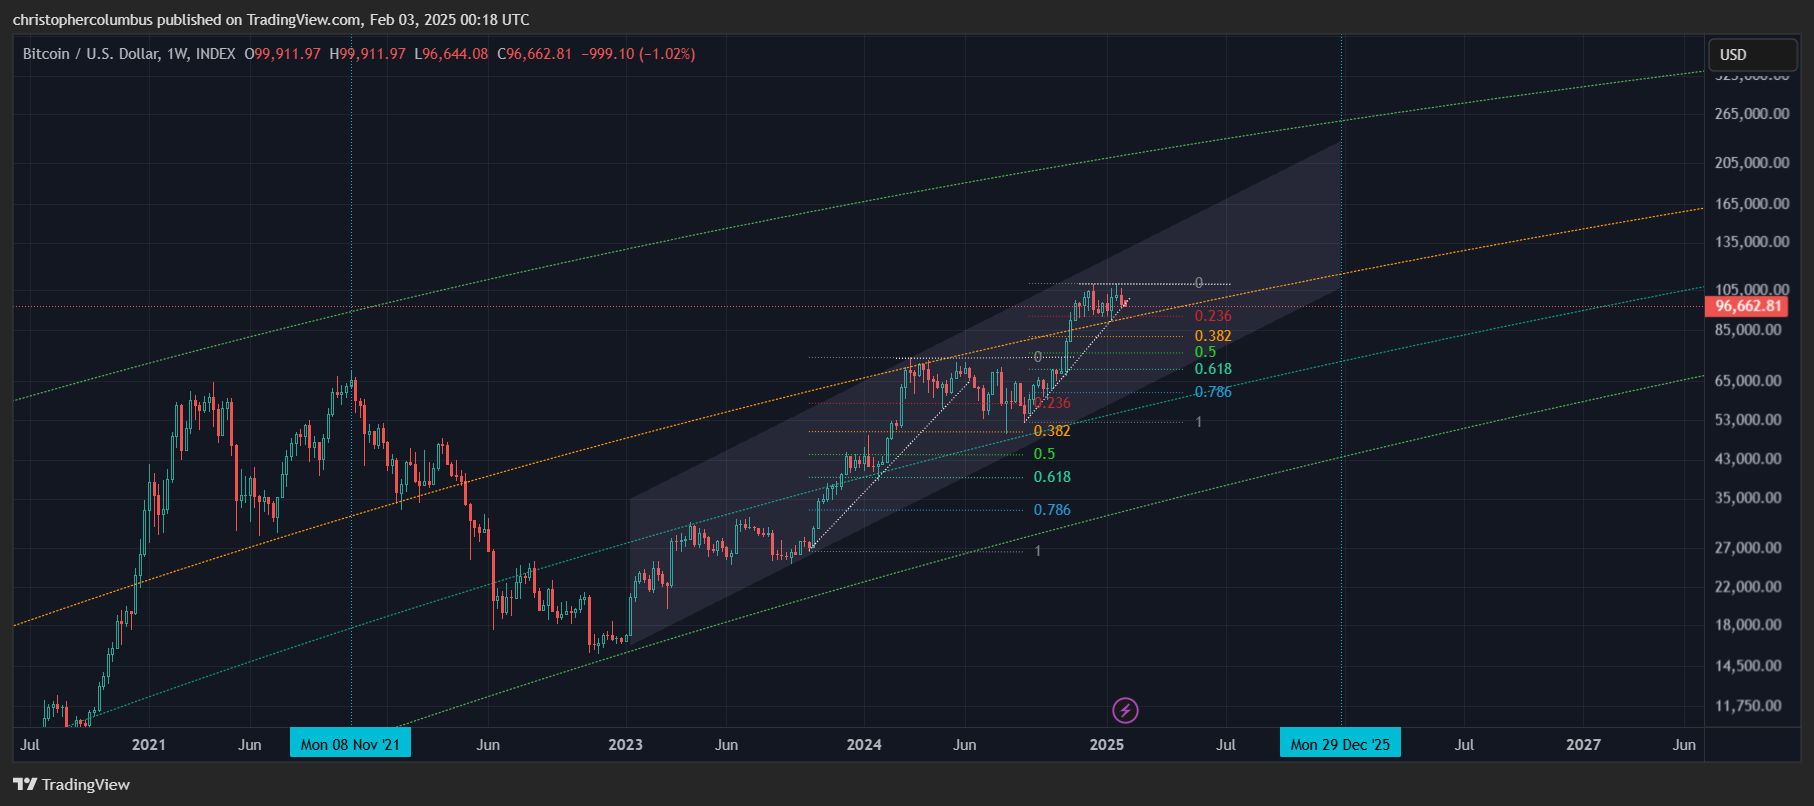

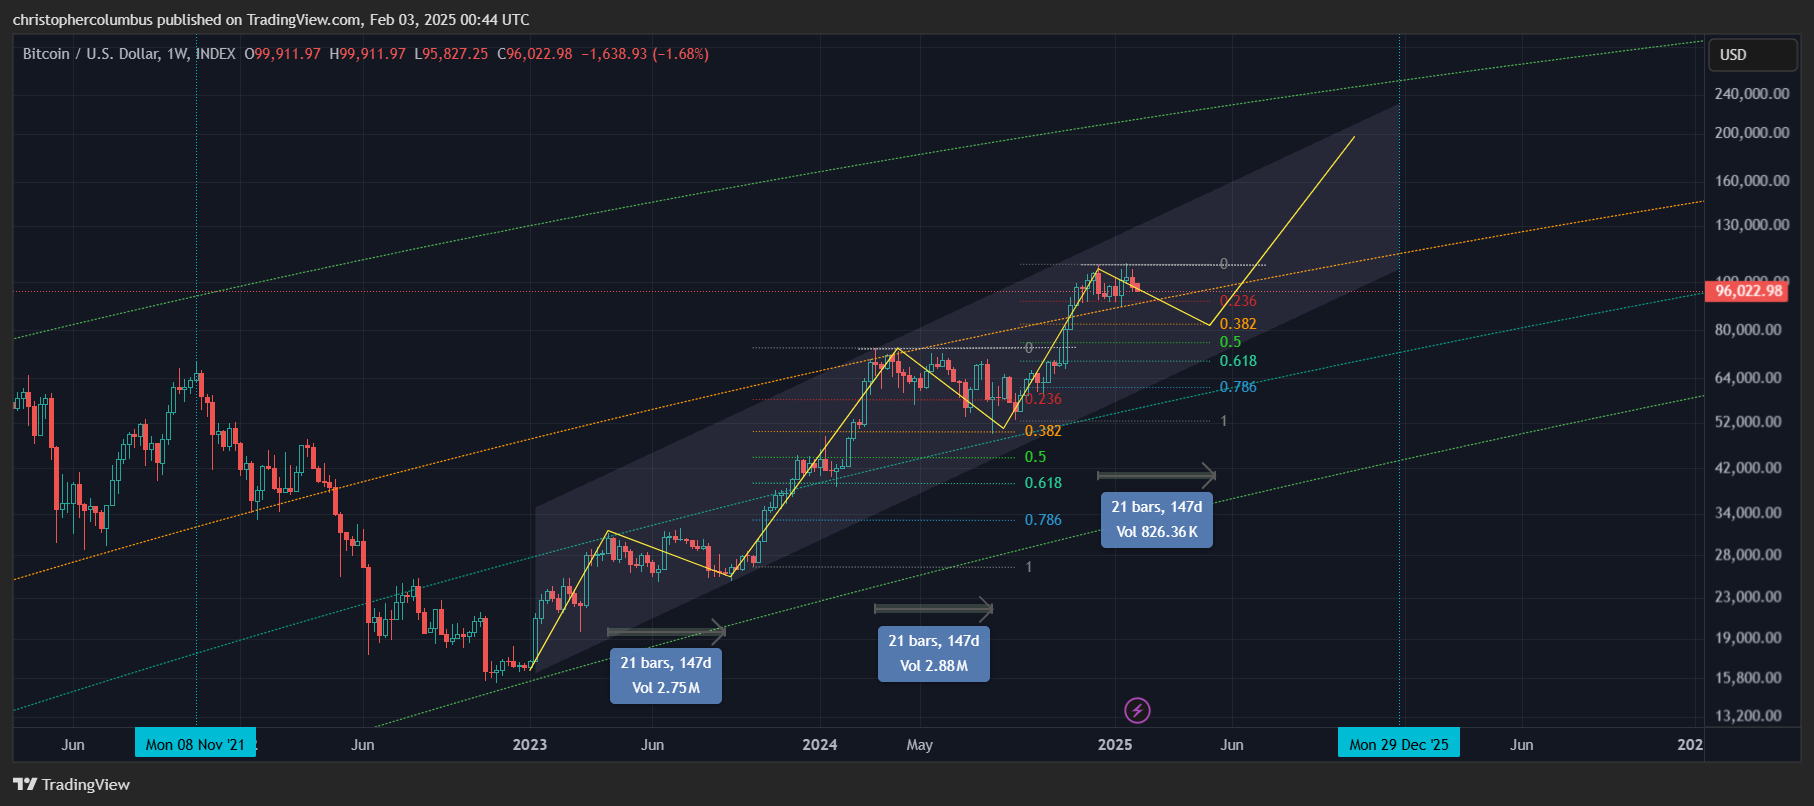
The primary technical consideration here is the shaded multi-year upward channel [itself overlaid on the long-term LGC channel]. The upward channel is appreciating at near 2x per annum in the aggregate, where, typically, most of gains come quickly followed by multiple months of consolidation. From the technical perspective this is excellent as it leads to a more technical stability in the pace of appreciation.
Given the technicals, a continued multi-month consolidation of price should be half expected as per the blue boxes below. Why half-expected? Because as we all know, price can turn on a dime and explode to the upside at any time, which is why you want to keep some exposure.
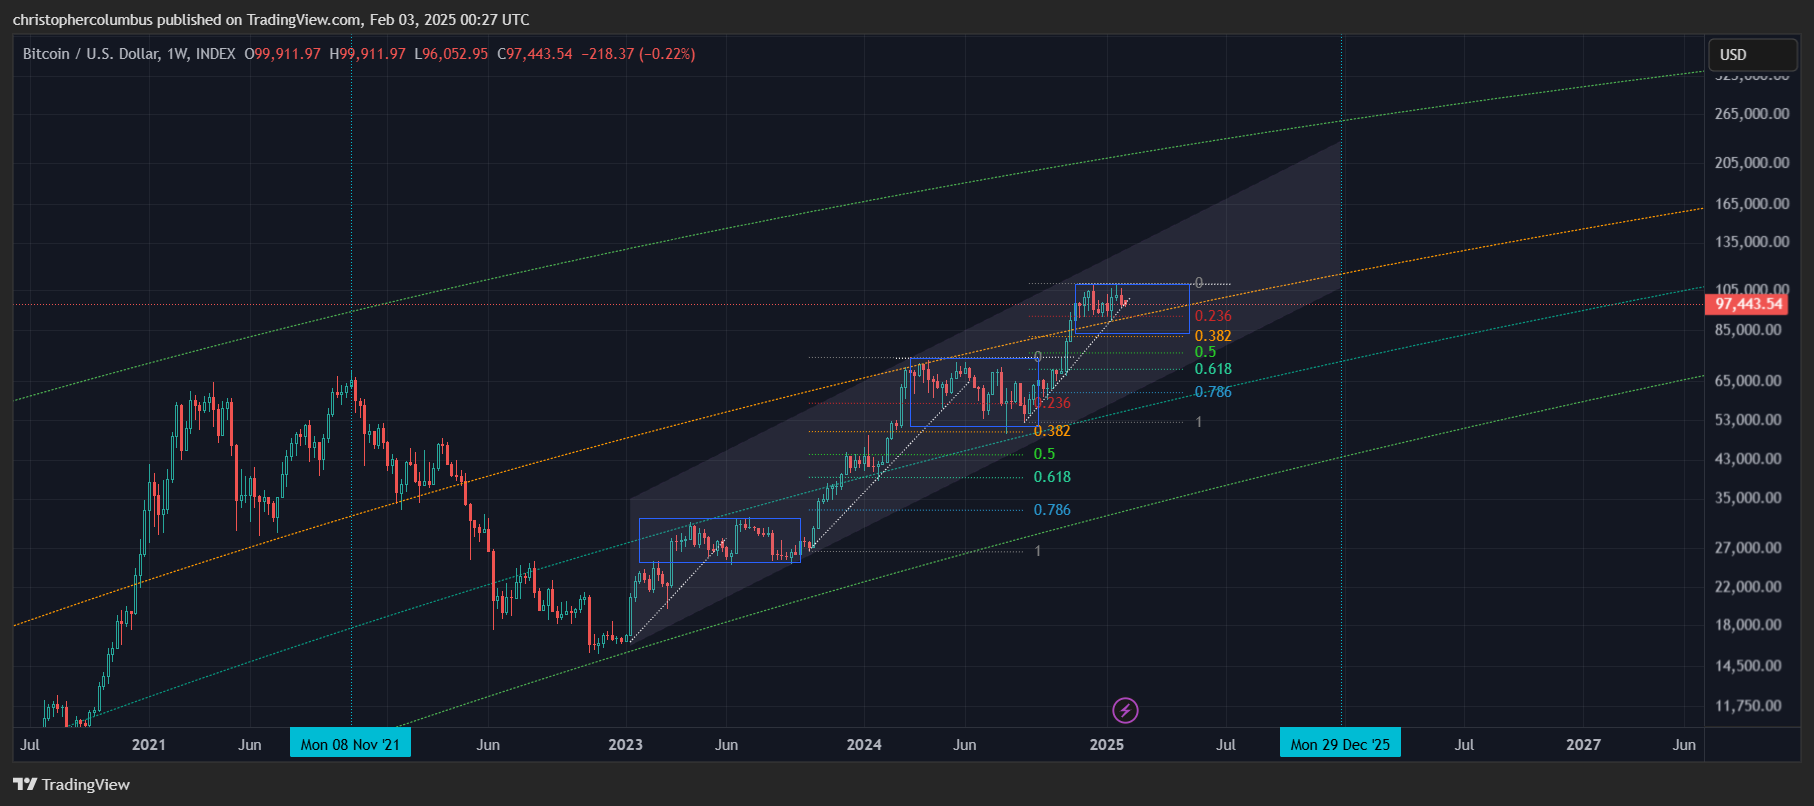
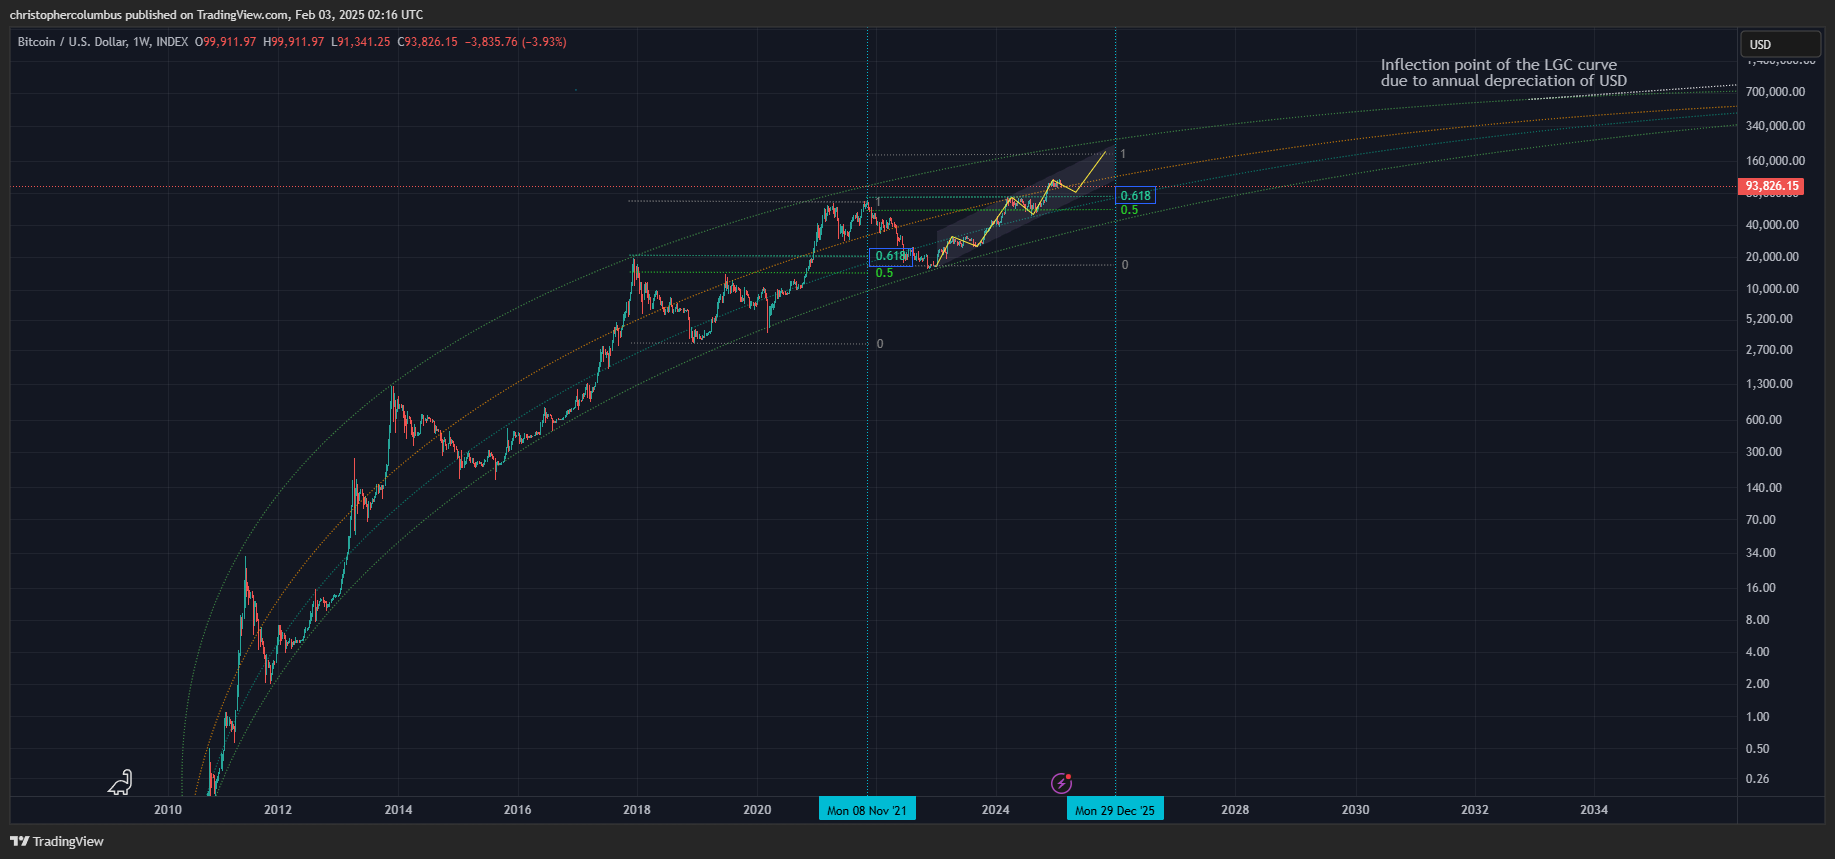
Technically, the current consolidation is well situated both in the LGC Logarithmic Growth Curve], where it is situated midway in the channel, and in terms of a multi-year cycle. Even though I think the 4 year cycle has to break at some point… in a maturing market, given the previous 4 year pattern in price it makes sense to provisionally maintain that outlook for now.
Also something to keep in mind, when talking of a maturing market, is the explanatory value this notion has for why price has so far kept a remarkably technical structure over multiple years. The question has to be raised - will this be the first purely technical multi-year bull market in Bitcoin, where a parabola is not required?
And lastly, back to the longer-term LGC chart to once again show the possible peak. Once high up in the channel, another year long correction in price is likely which is why you’d want to consider taking a portion of you Crytpo balance in profit, one way or another, while continuing to sit on that core BTC position for the longer haul.
Until next time,
Stay [relatively] safe out there,
Dave the Wave.