
BTC Contingencies 2
Dear Readers,

I thought it would make sense this week to continue on from the last newsletter that looked at various contingencies with the then parabolic trend breaking down. From that time two weeks back to the present, price has indeed continued sideward, where neither a continuation of the recent trend on the one hand nor a complete collapse in price on the other has eventuated [as of yet]. Rather, price has remained relatively solid within the upper fib level of the large move up as per the following chart.

Two weeks back, the chart suggested continued consolidation once the steep trend was crossed. While at that time being susceptible to a correction, I think it fair to say that the recent geo-political event was the catalyst for that correction taking place. What’s interesting is that the sell-off has stayed within the bounds of the initial sell-off in March as marked by the arrow. Also of significance is that price has so far remained clear of the 0.38 second fib level that I was looking at as a primary contingency in the previous newsletter. Currently we see a horizontal range formed, where price, even though down in multiples of thousands, is in relative terms still looking solid.
Regarding those nominal thousands, it’s a significant fact of our psychology that this kind of volatility can play havoc with our emotions. The initial and rapid move up to new numbers astounds and excites us, and yet those new numbers soon become ‘normalized’. The subsequent move down in turn alarms us as the digits lost [the nominal values] are now larger than ever. Here the function of technical analysis comes into its own - in scenarios that on the face of it appear chaotic, it brings a semblance of order to the chart. It enables us to become more proactive, predictive and strategic in our thinking as opposed to being purely reactive to those seemingly random fluctuations of price.
Instead of focusing on an $11,000 decline, which was only a few years back the total price of a Bitcoin, we see a 15% nominal decline [from peak price], which is well within the range of Bitcoin normal. Add to this that the fib measurement gives just over a 23% real correction [relative to the recent move], and this also is not too alarming. The TA provides a sense of proportion to what without it would look grotesque with no shape or form, rhyme or reason.


And so zooming out further [first chart above], we see price currently midway within the channel of the LGC model. The model performed well in predicted the area to buy [shaded area] for the late investor that has come relatively recently to the market. It predicts a policy of a continued hold. As for the more immediate prediction of which way the current ‘holding pattern’ or range will break [that interestingly is oscillating around previous highs], TA must also observe its limits with longer-term trends being more amenable to analysis. That said, the holder/ investor has confidence in continuing to hold, even if there be a further correction, on the basis of the greater LGC trend… something that has performed very well since 2018 [second chart above]. On the other hand, the late potential buyer is in a position to see which way the current range will break.
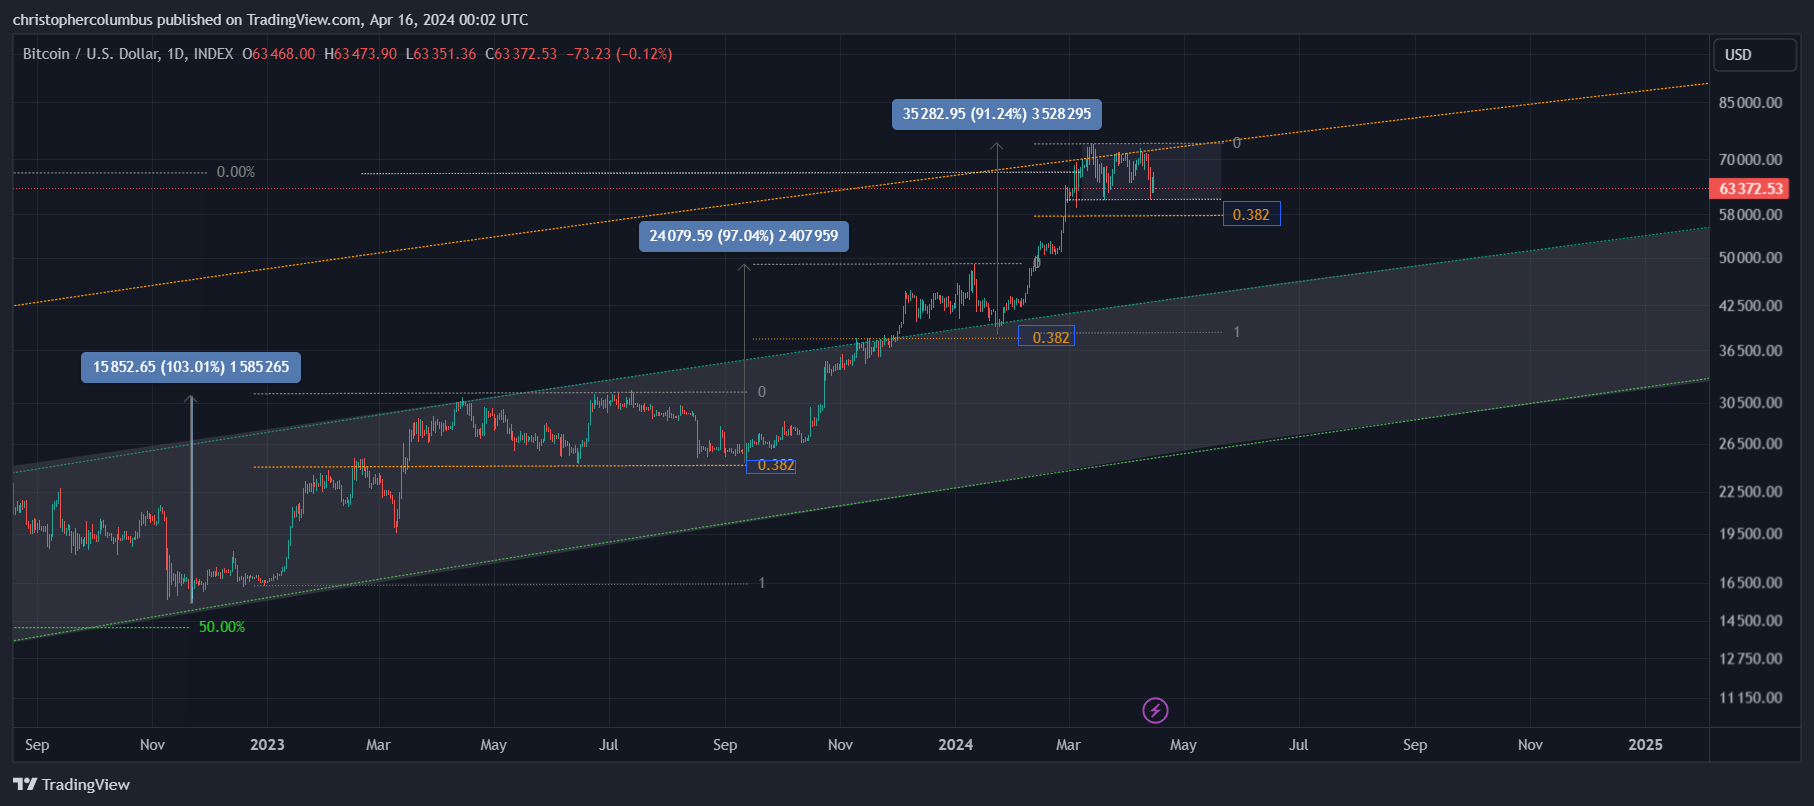
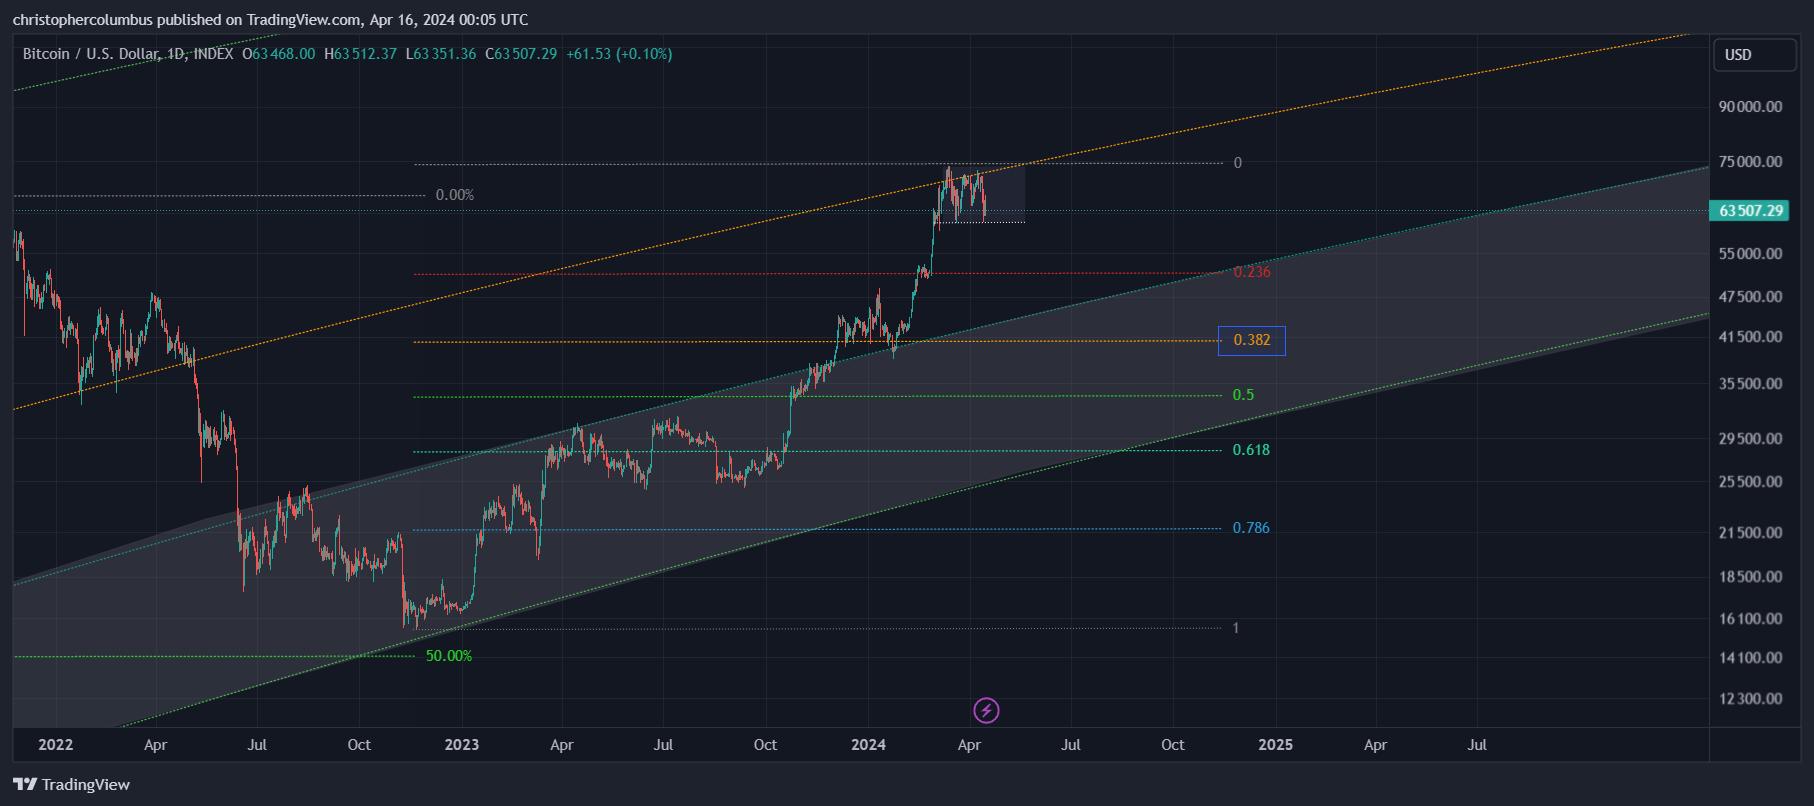
Finally, cycling back to the shorter-term [and fallible] prediction, further consolidation to around 58K would see a continuation of the fib series. Failing this, we could well see an extended multi-month correction of the whole one year move up from the lows, an unwinding of the most recent move and a 38% real correction of the total move of the lows [2nd chart] back toward the buy zone and the 40K range. This would then set up for the potential of a similar move up next year [the speculative reverse head and shoulders here reflects the idea that a maturing more liquid market becomes more susceptible to technical analysis beyond that of a general model on a multi-year timeframe].

Of course, to bring it back to the present, watch this range and that 75K tag at the top, which a convincing break of would see the market back to the races with a ‘front-running’ of the traditional 4 year cycle that many are only too familiar with. The point here in outlining the alternatives is a practical one for the trader/ investor yet to establish a position: what is a truism in theory for the armchair critic gives rise to a concrete strategy in practice for the actual trader/ investor - no necessity to buy until that upper tag be broken…. in order to cover risk to the upside.
Until next time,
Stay, relatively, safe out there,
Dave the Wave.