BTC: Expect the Unexpected
Dear Readers,
I thought first an overview of the macro development in price [multi-year] might be helpful for in turn asking how price will develop going forward in what now looks to be the corrective phase. The main idea will be to show that just as previously price did the unexpected to what was expected by the mass of participants, so too price is likely to once again do the unexpected… that where we expect too much on the upside, we tend to also expect too much on the downside.
But first a quick look at by how much price fell short of my projected target. When speculatively predicting a top for this cycle, I’d mostly been sketching something like a 160K top with various posts [as per the below chart from March].
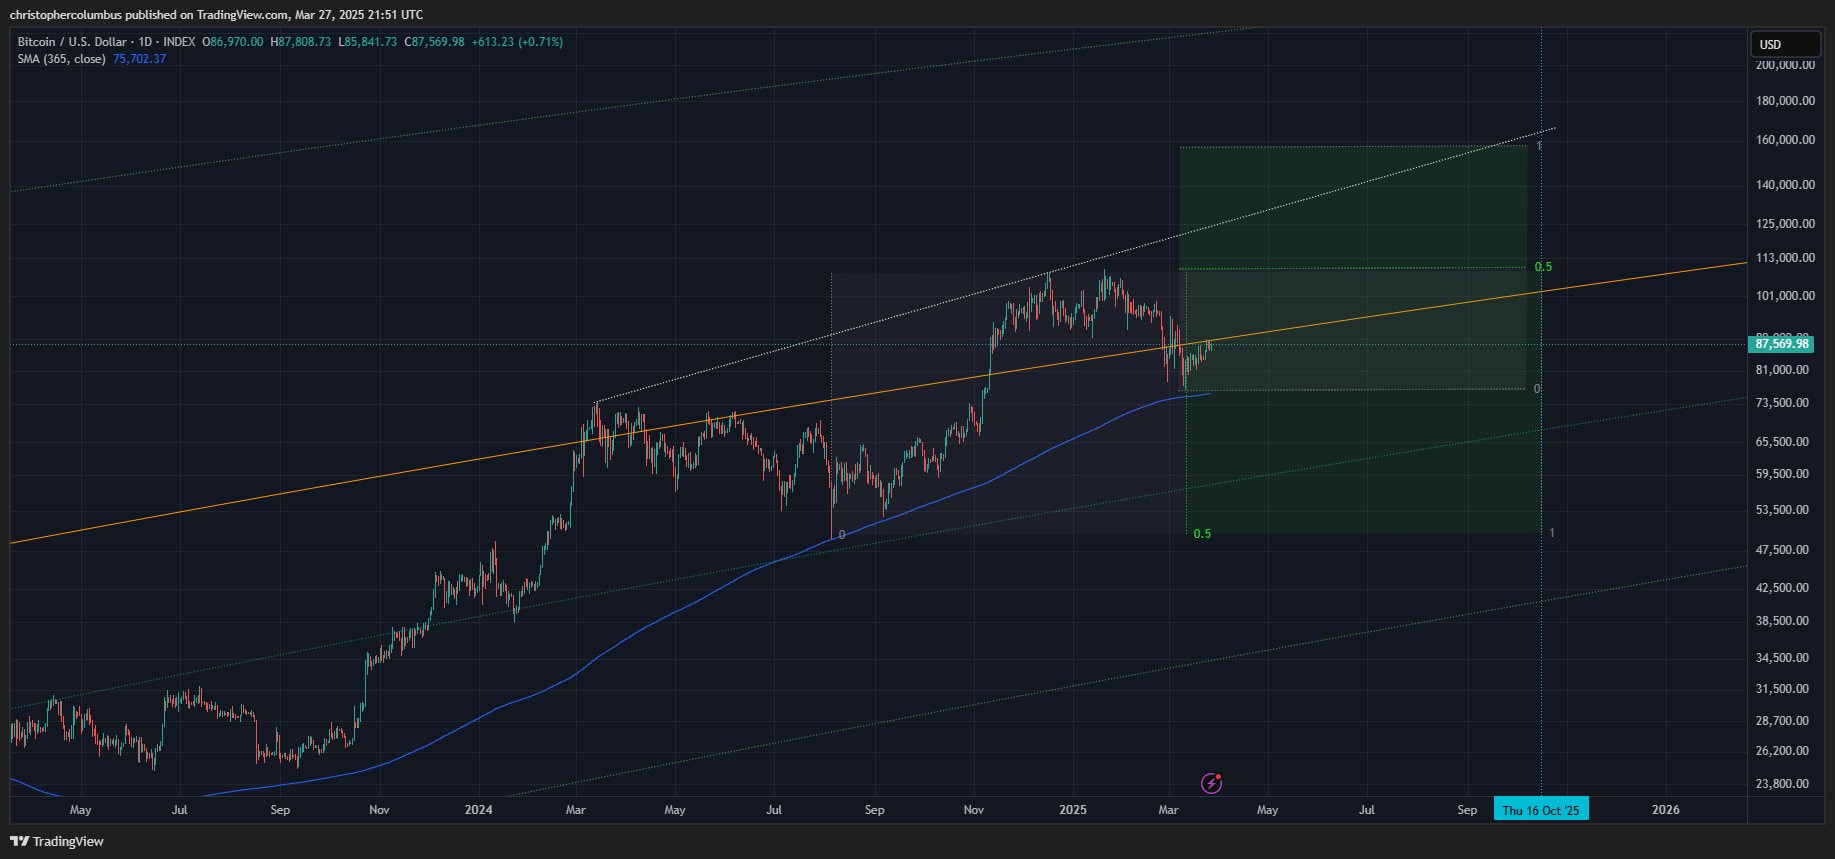
With that kind of target not eventuating, price peaked out at 124K… falling 10% of the target as measured in real terms from the bottom to that target. But back to our overview of the macro development in price,
Macro Overview
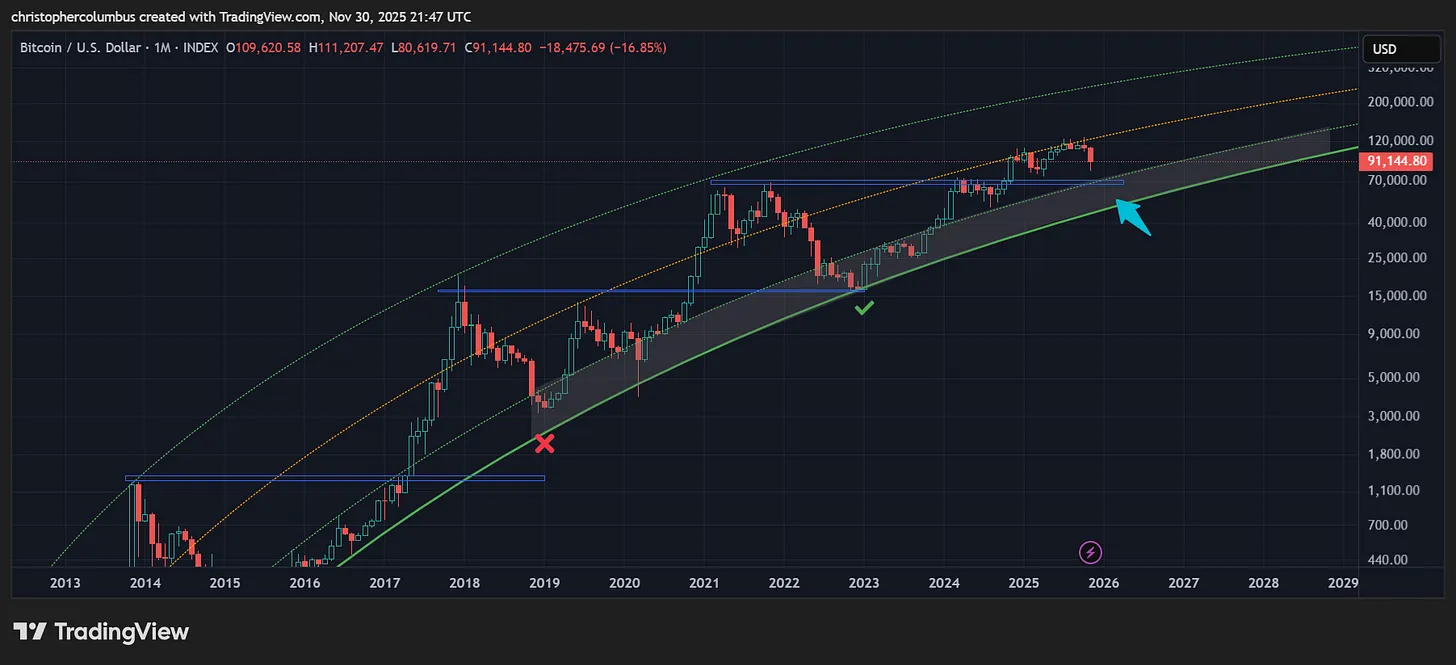
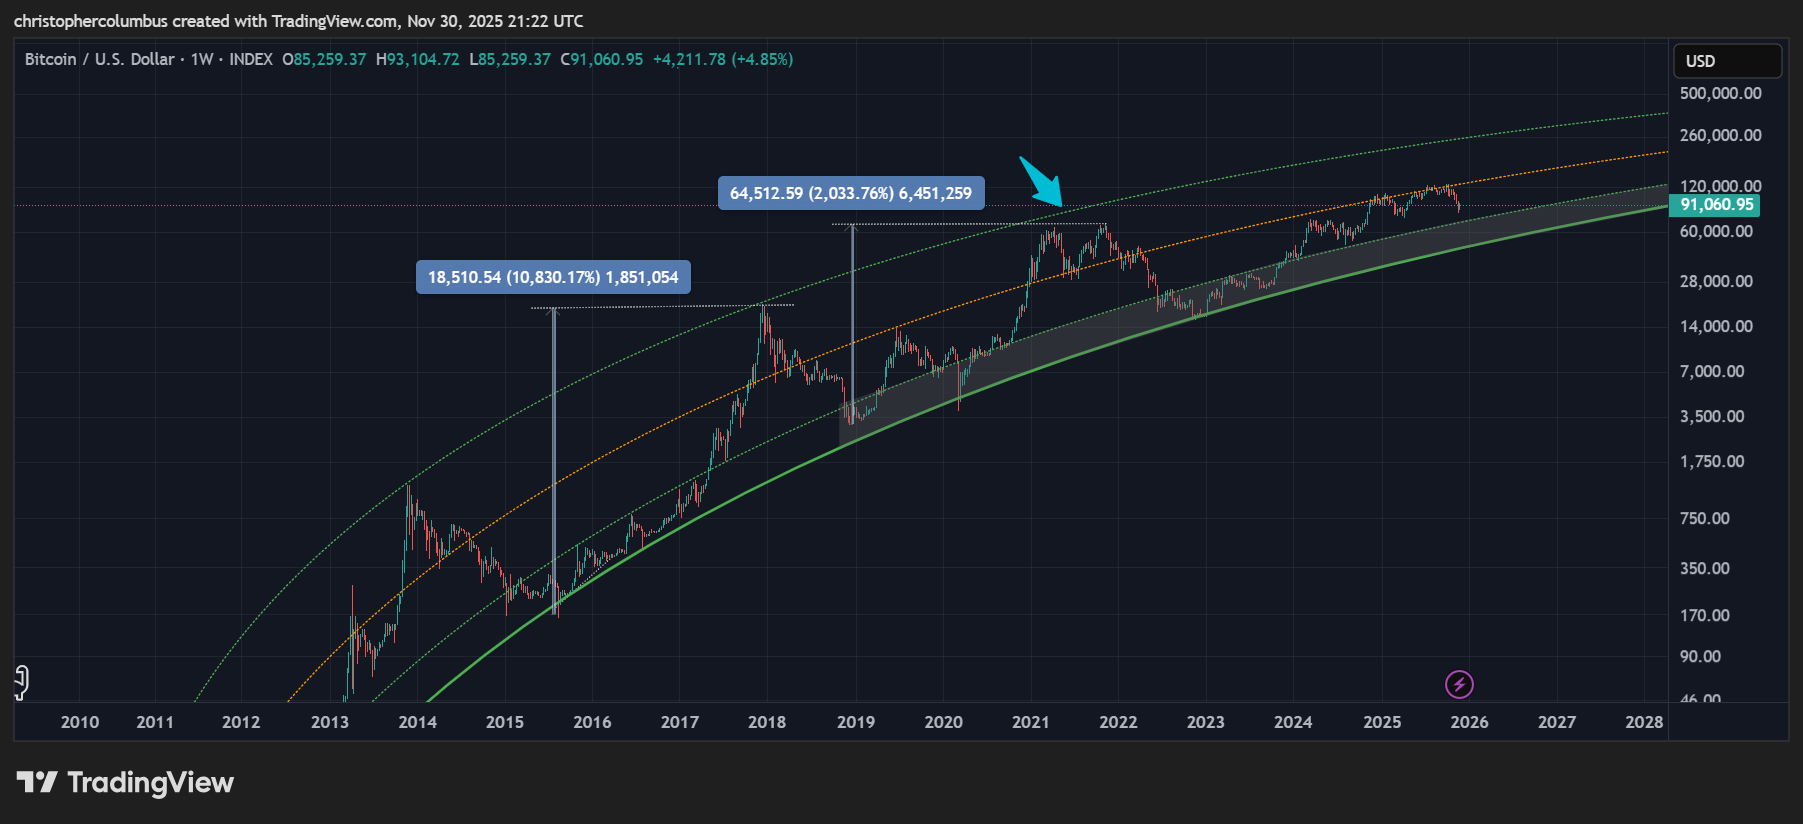
The timeframe I’m focusing on here is one that stretches back to the last cycle. The reason being that in qualitative terms, in terms of market maturity where price action is becoming less parabolic, this is the comparison best to focus on in my opinion.
Though the correction, or corrections, marked by the arrow now seems normal, at the time it was anything but. Though the LGC channel was suggesting the price was topping, most market particpants in the mass expected much higher prices. The eventual double top was the most unexpected outcome. The expected ‘blow-off top’ never came. Instead, we were left with a chart that looked like the aftermath of Mount St. Helens, where the double top [crater] looked like it had quite literally had its top blown off in that other sense.
The point here is that now, yet again, where this unexpected stalling out of price has eventuated, this unexpectation can almost be taken as a principle: market price will do the opposite of what most most market particpants expect. Of course this contrarian principle has been known for a long time: ‘the market likes to frustrate the many’.
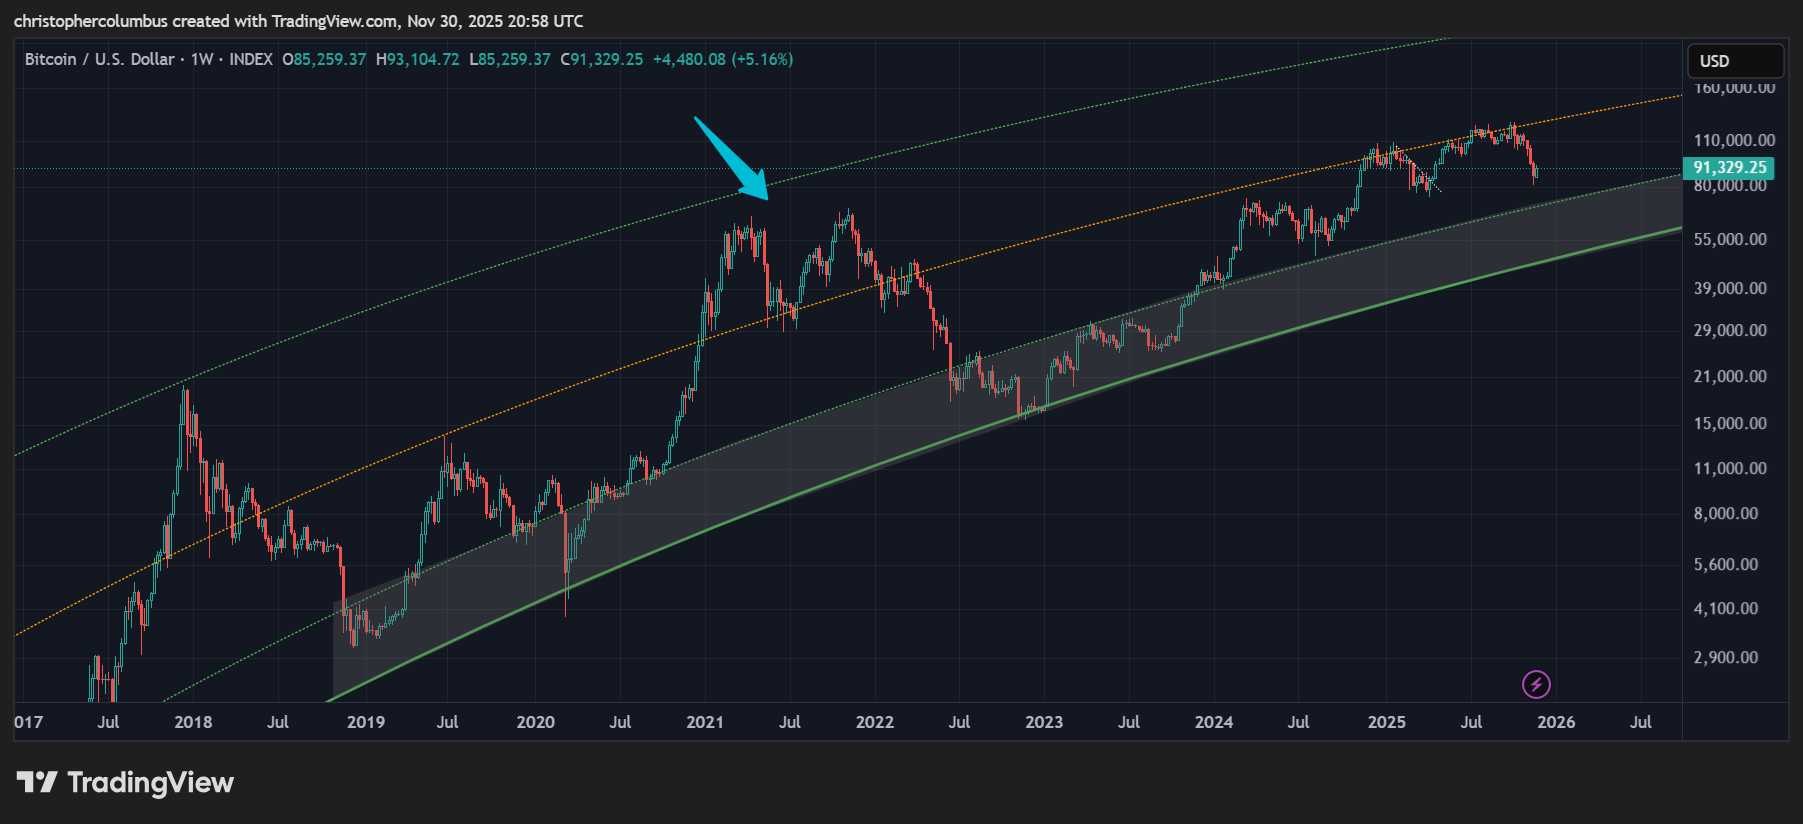
Going forward, with this principle in mind, with an overly bearish sentiment increasingly coming to replace the previous overly bullish sentiment, it is likely that price will not go as low as the many expect. But Dave, the astute reader will ask, what about the previous macro correction, at the highlighted years, which corrected a full nominal 77% [and interestingly to the bottom of the LGC base/ buyzone]. And a good question it is that requires a response.
The Previous Correction
Given the double top, I think it fair to see the previous cycle as a transition between a parabolic market and a technical market [a maturing one]. Though the peak was a full 21x off the bottom, it was nothing like the 89x of the previous cycle to that…. and looking at today’s peak [if indeed that is the peak], we once again have a lower return, and a stabler price action.
Coming back to a focus on the more recent correction as compared to the current one, the question raised has to be whether it will be that full 77% [the previous macro correction to that was 86%].
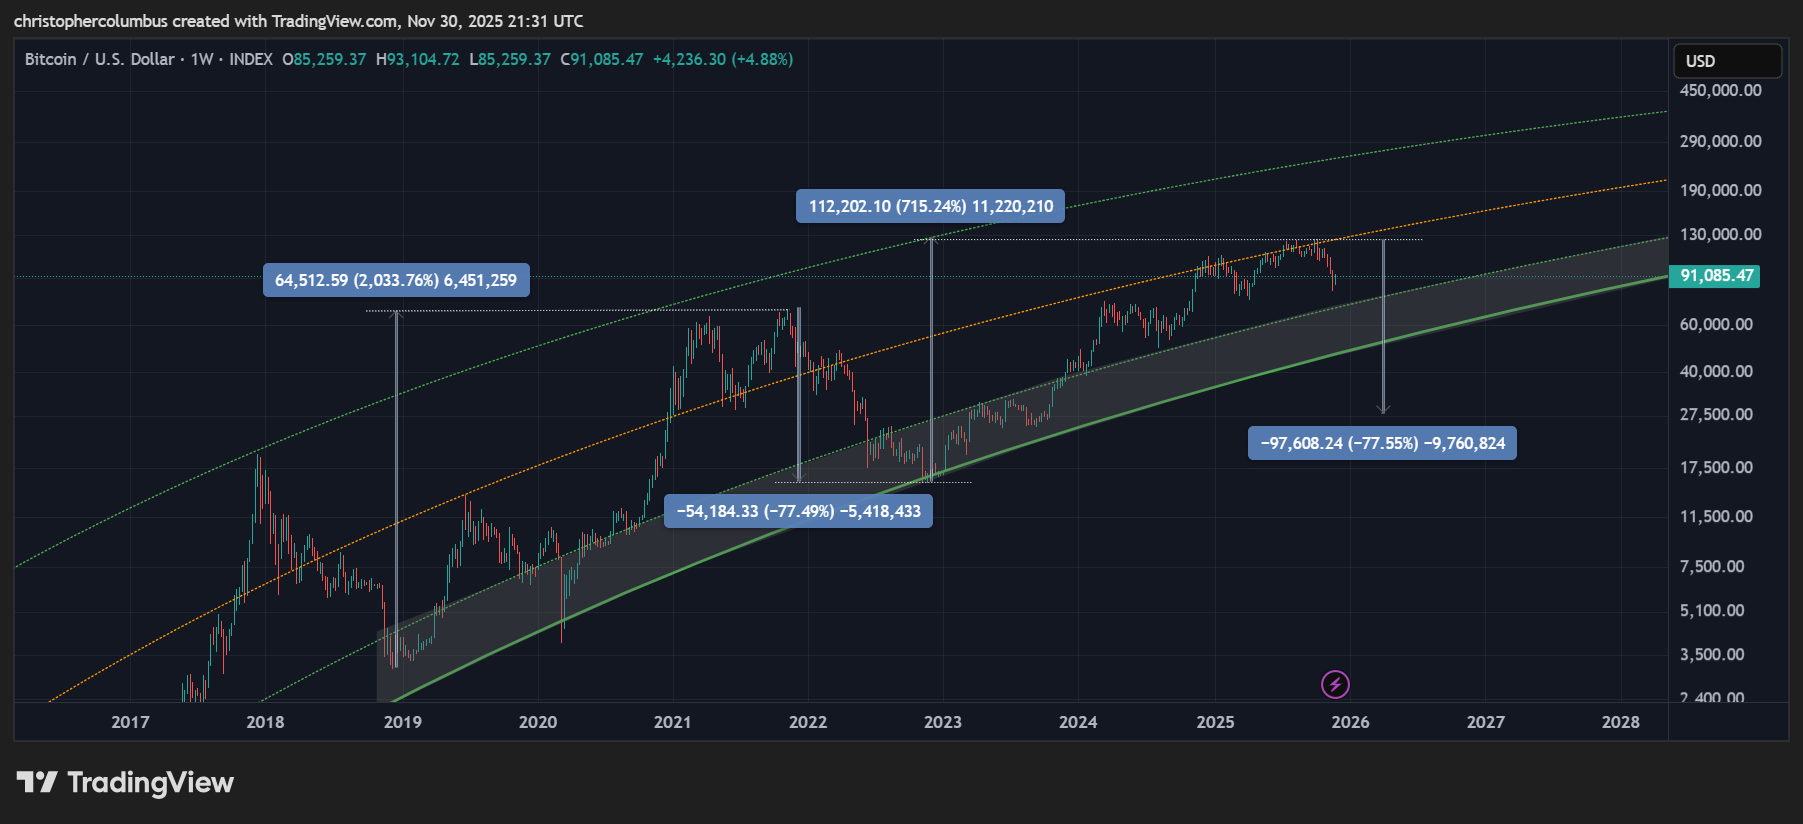
Such a correction I find highly unlikely, which would put price well below the LGC basing range.. a range that has held good since 2018 and based on the very principle of a maturing plateauing market with diminishing returns. Though the many, becoming increasingly bearish are likely to expect such lows, I highly doubt they would eventuate [the added strength of the contrarian principle]. The question that we turn to now is what could be a more realistic expectation of market lows.
Realistic/ Technical Expectation of the Lows
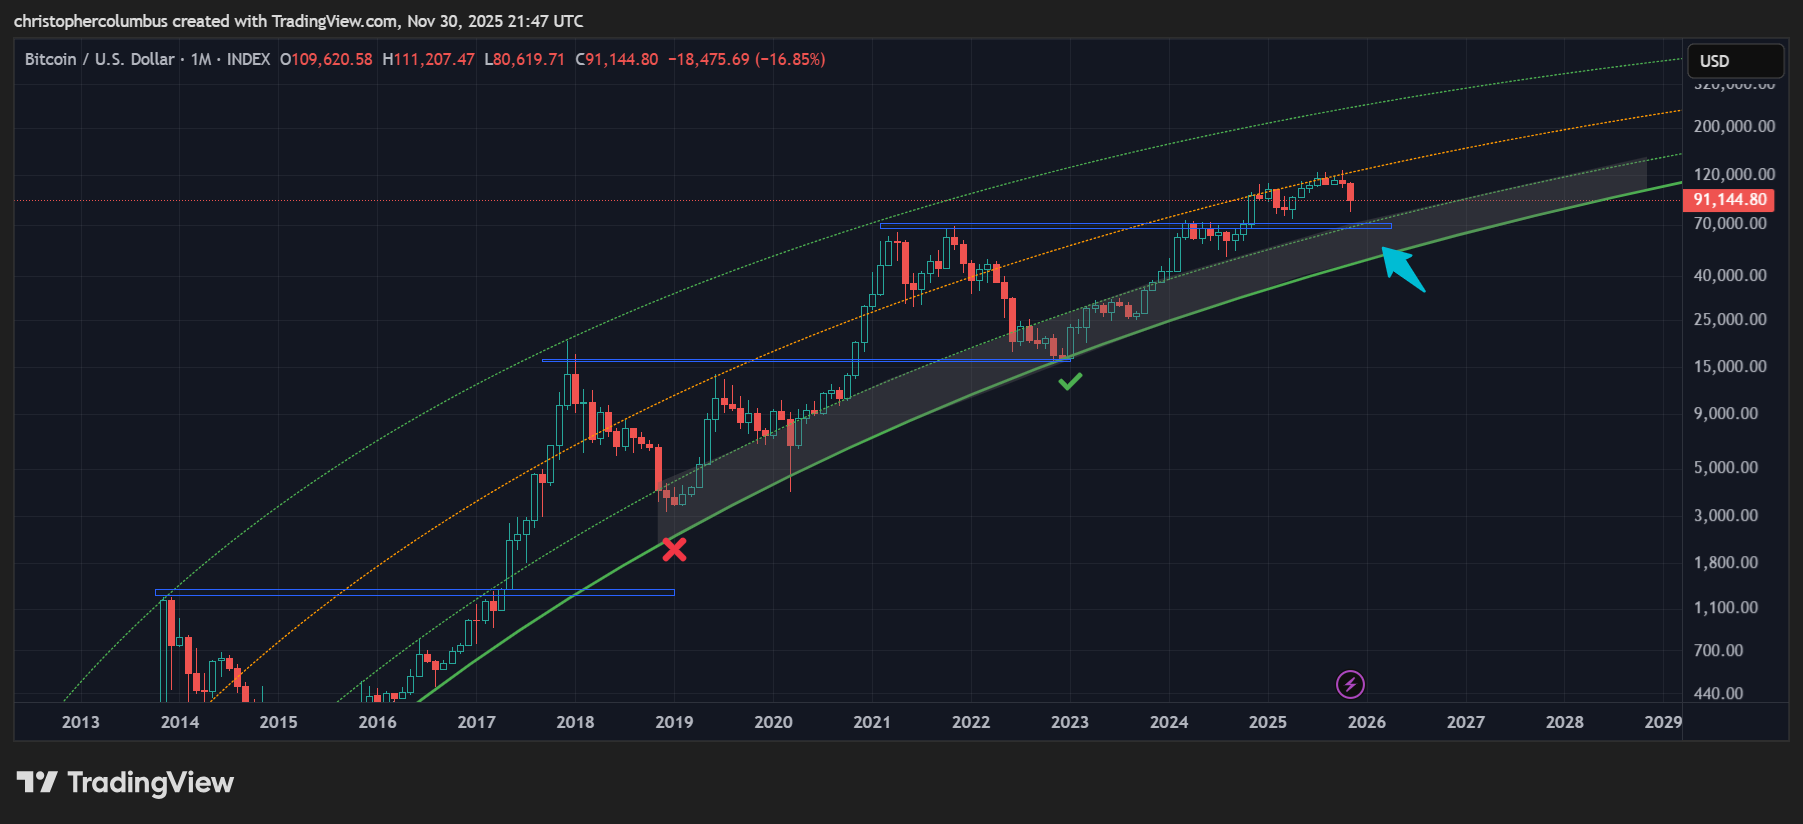
First of, with the idea of the double top cycle as being a transitional one between that of a parabolic market and a more technical one, it is significant to note that whereas the macro low previous did not meet it’s previous peak, the low of the double-top cycle did. In my opinion, this serves to signal a more technical outlook toward price action where we previous resistance [the peak] becomes support. That the 2019 mini peak could also be said to meet macro resistance at this level strengthens the argument [and yes, I am giving an argument here to say that there is a rationale to the develop of price as opposed to being completely random].
On the strength of this, we can predict [not state] that price is likely to meet support at 70K odd, or just below, as this is the area of the previous macro peak of 69K [which interestingly would also be the top of the LGC buyzone as seen on the chart].
For the disinterested chartist, that the price action of a previously parabolic moving market is coming more into alignment with the technicals, not to mention in keeping with the LGC model, is a huge positive…. even as we would want to see higher prices here and now. Lastly, a review of the technicals as applicable to this cycle only.
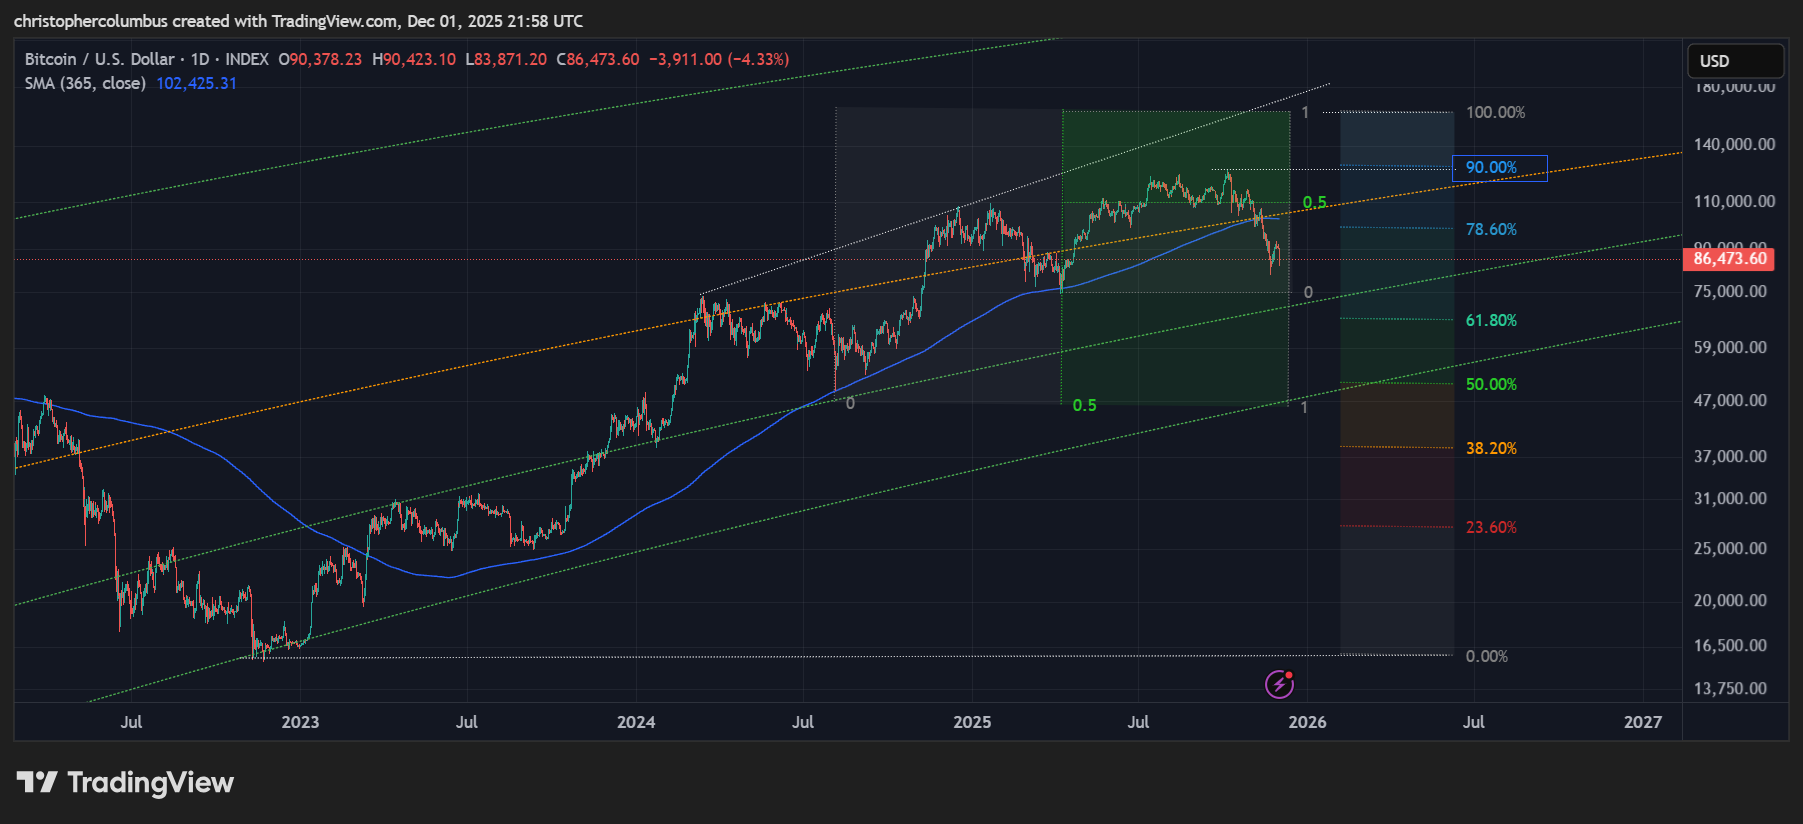
The Technicals of this Multi-Year Cycle
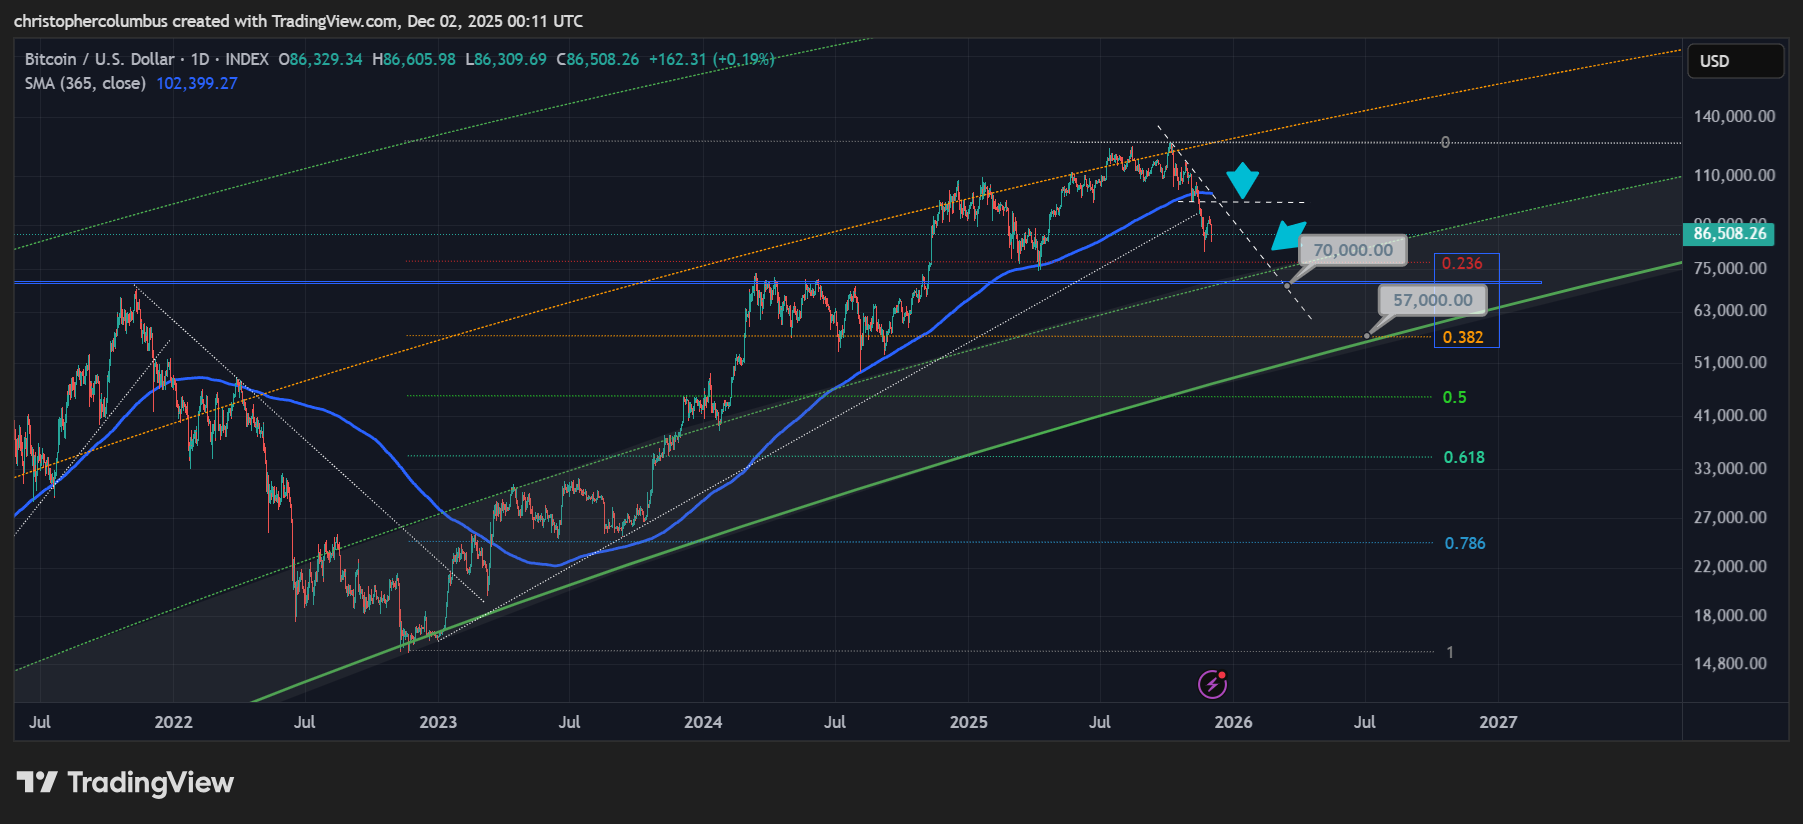
Clear lines of resistance have now formed with price now remaining below the 1 year moving average and that significant 100k level. Resistance come support at 70K lies between the first and second fib levels… with the first level at the top of the LGC buyzone and the lower second level [0.38] at the bottom of the LGC buyzone to provide to bottoming targets. I favor the higher one as we have not seen a parabolic rise in price but instead a steady technical advance that has been punctuated at even intervals by corrections.
Until next time,
Stay [relatively] safe out there,
Dave the Wave.