
BTC MACD Review
Dear Readers,
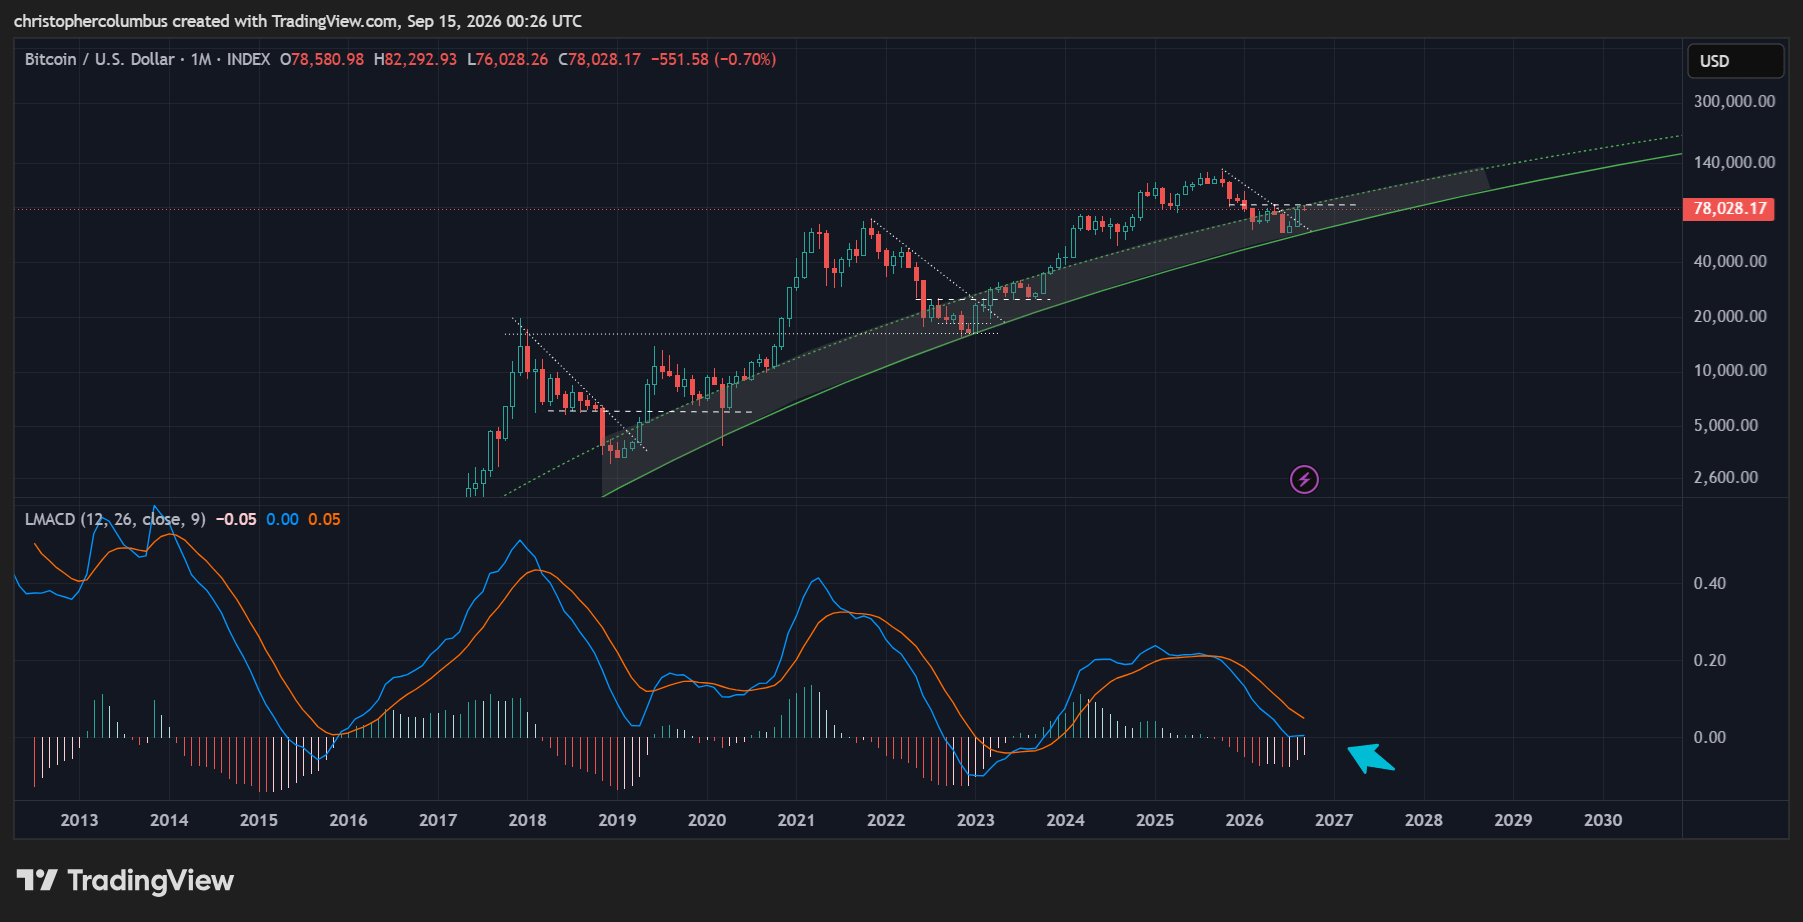
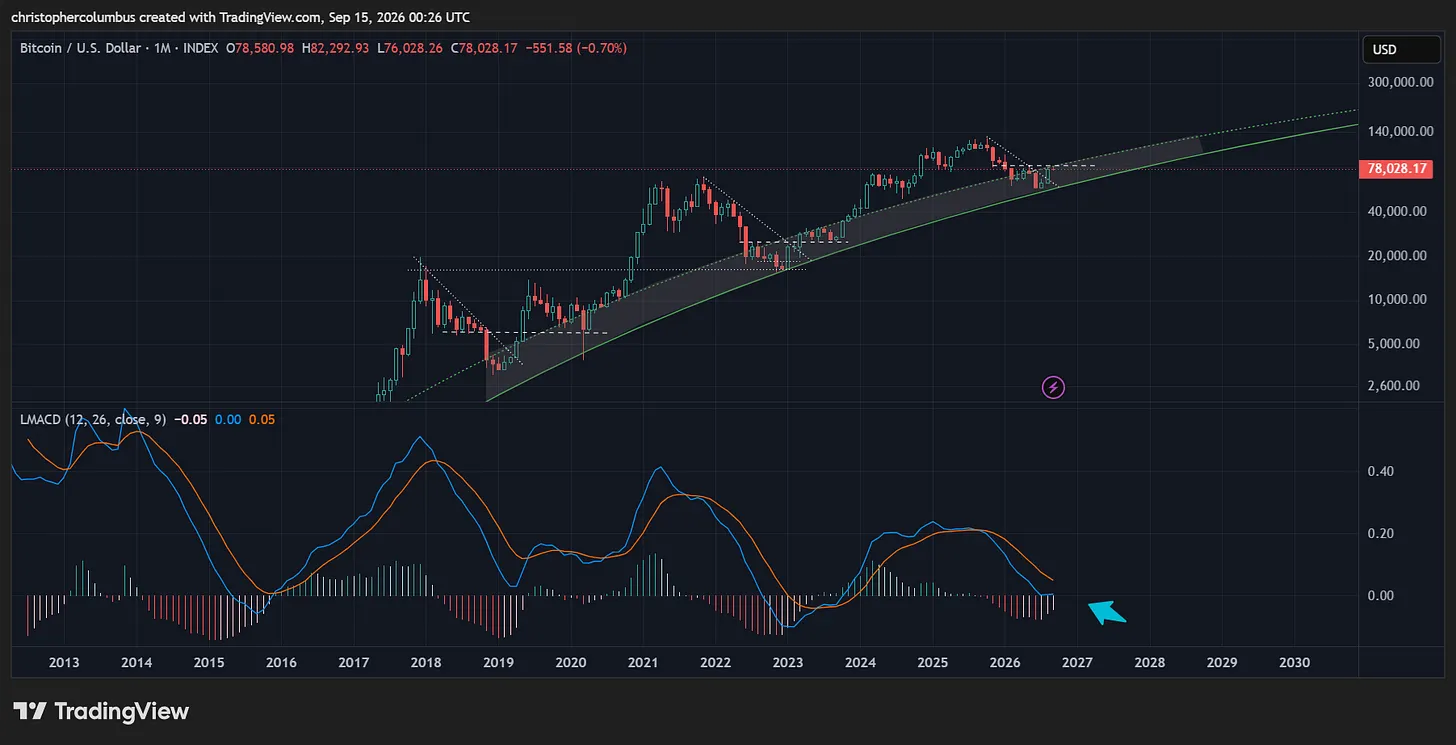
Given that technical analysis is most conducive on the longest term time-frame, this has to be the most significant chart in my opinion.
The MACD, on the monthly chart, has fully rebooted to the zero line, and has been sitting on that line for 3 months now…. with a series of contracting histograms showing the MACD re-approaching its signal line.
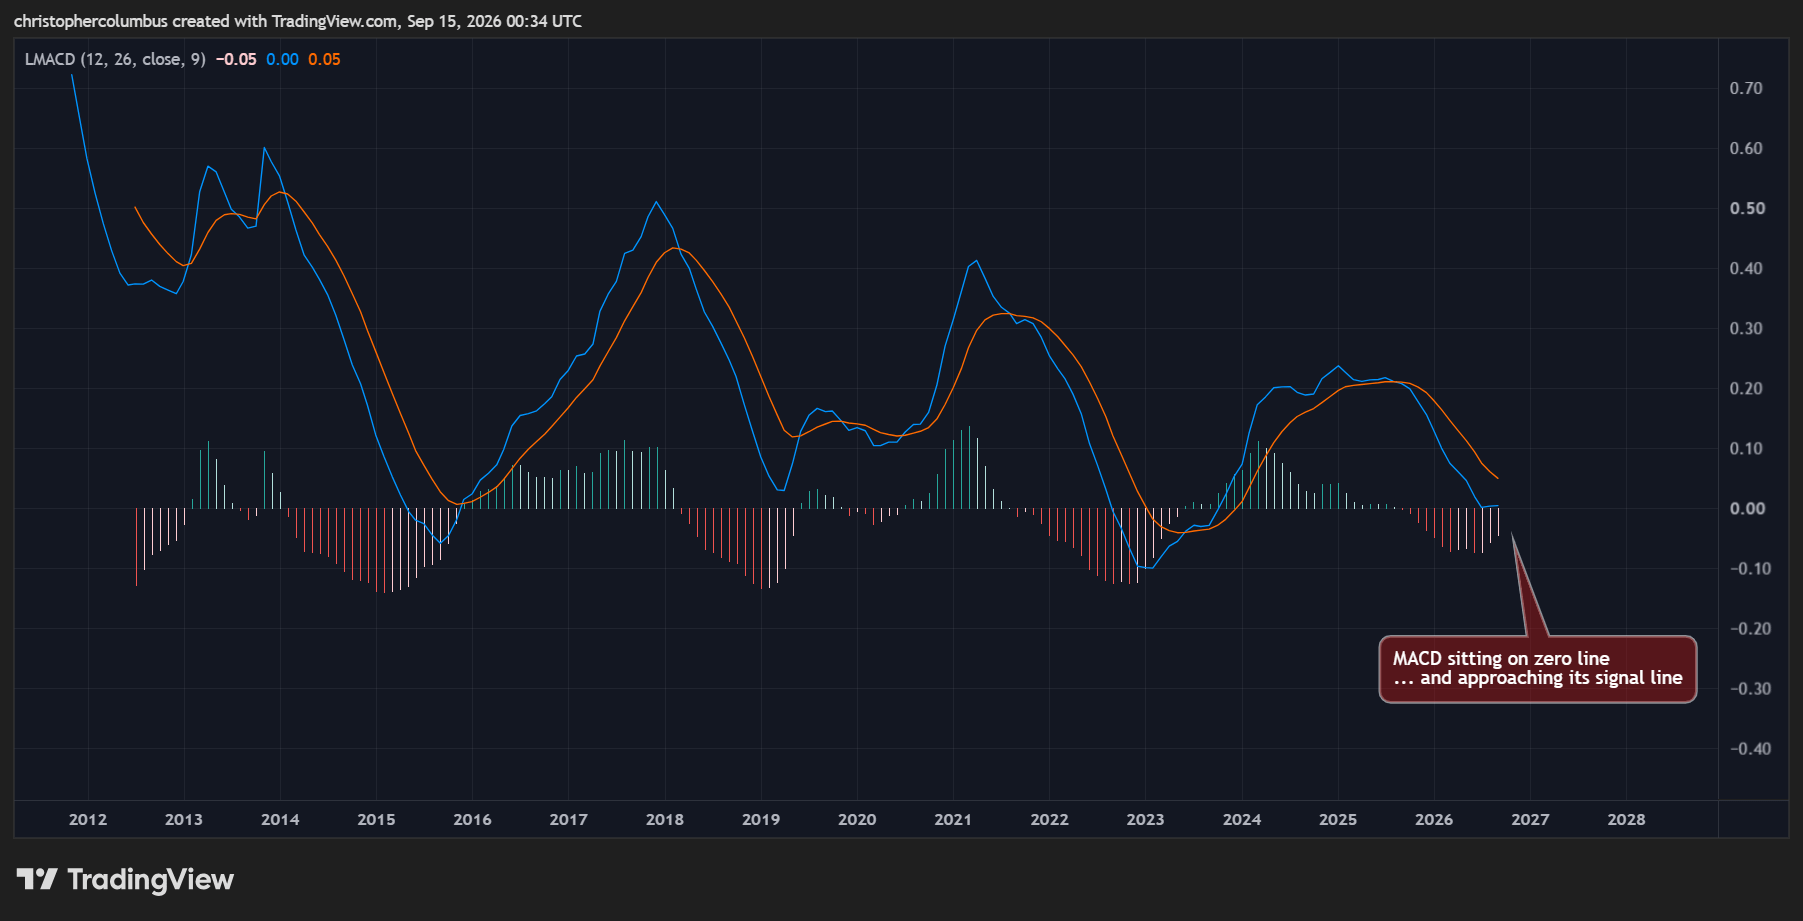
Once the MACD crosses, given the previous record, the new bull market cycle is on, signalling renewed bullish momentum.
In extrapolating the trend on the histogram [below], the MACD cross is shaping up for December this year. Looking at the chart, you can see the lows each time were well and truly in by the time the monthly MACD crossed.
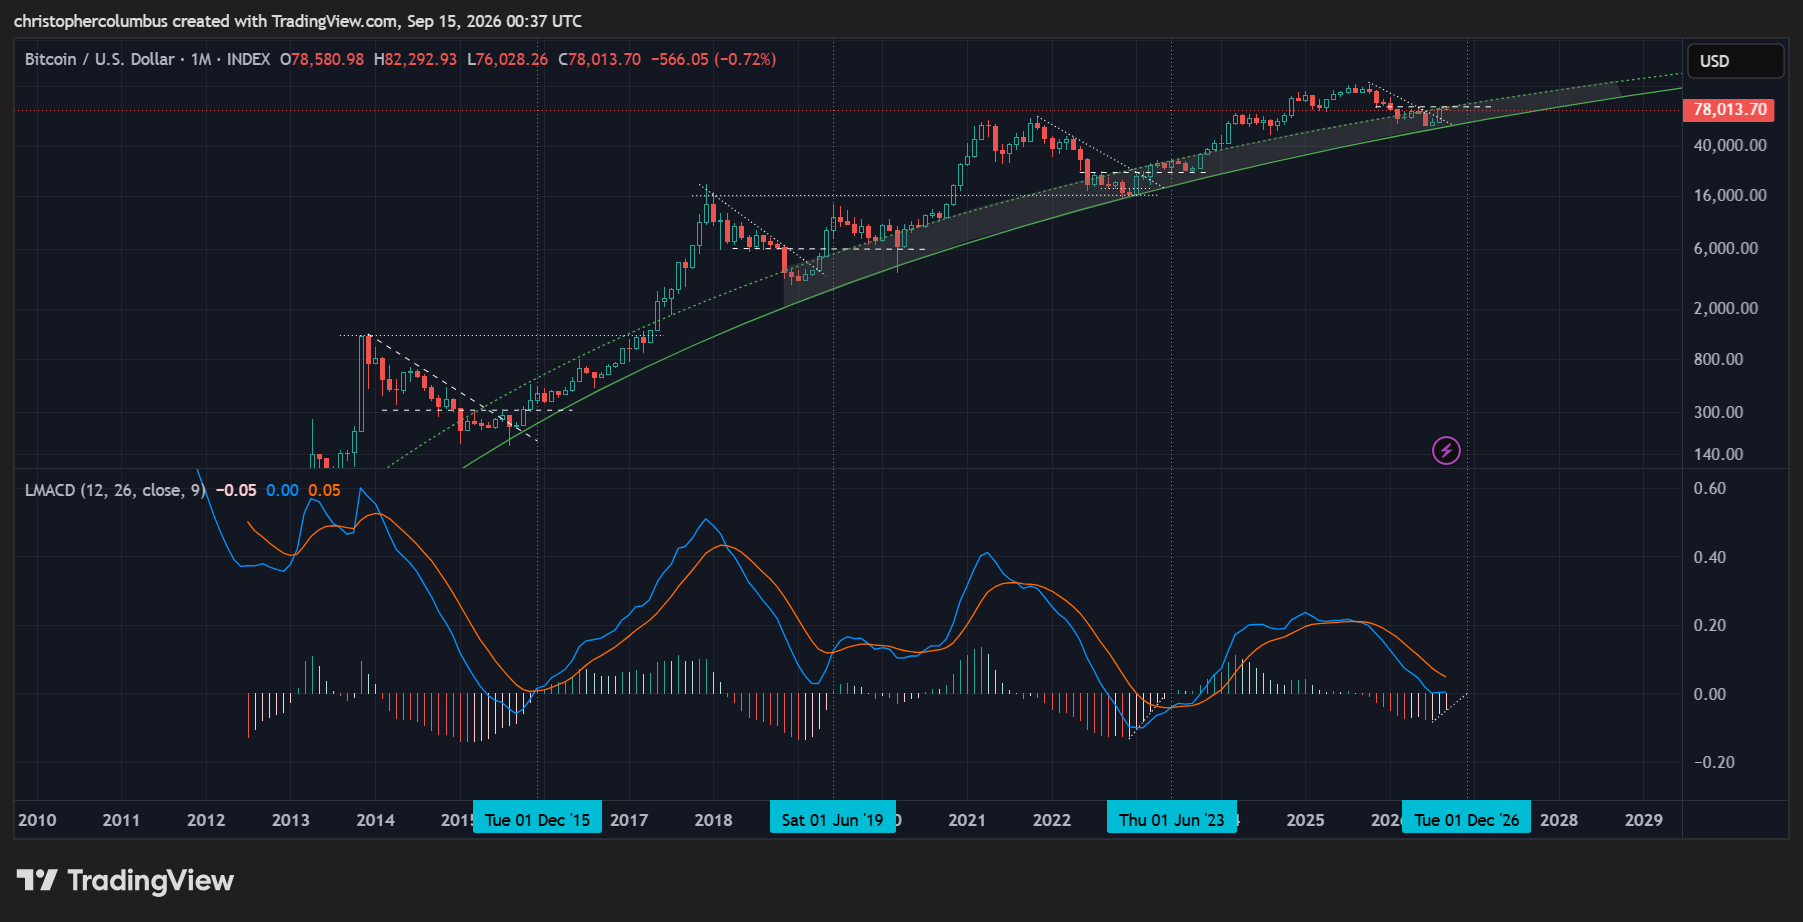
Factoring in a One Year Correction
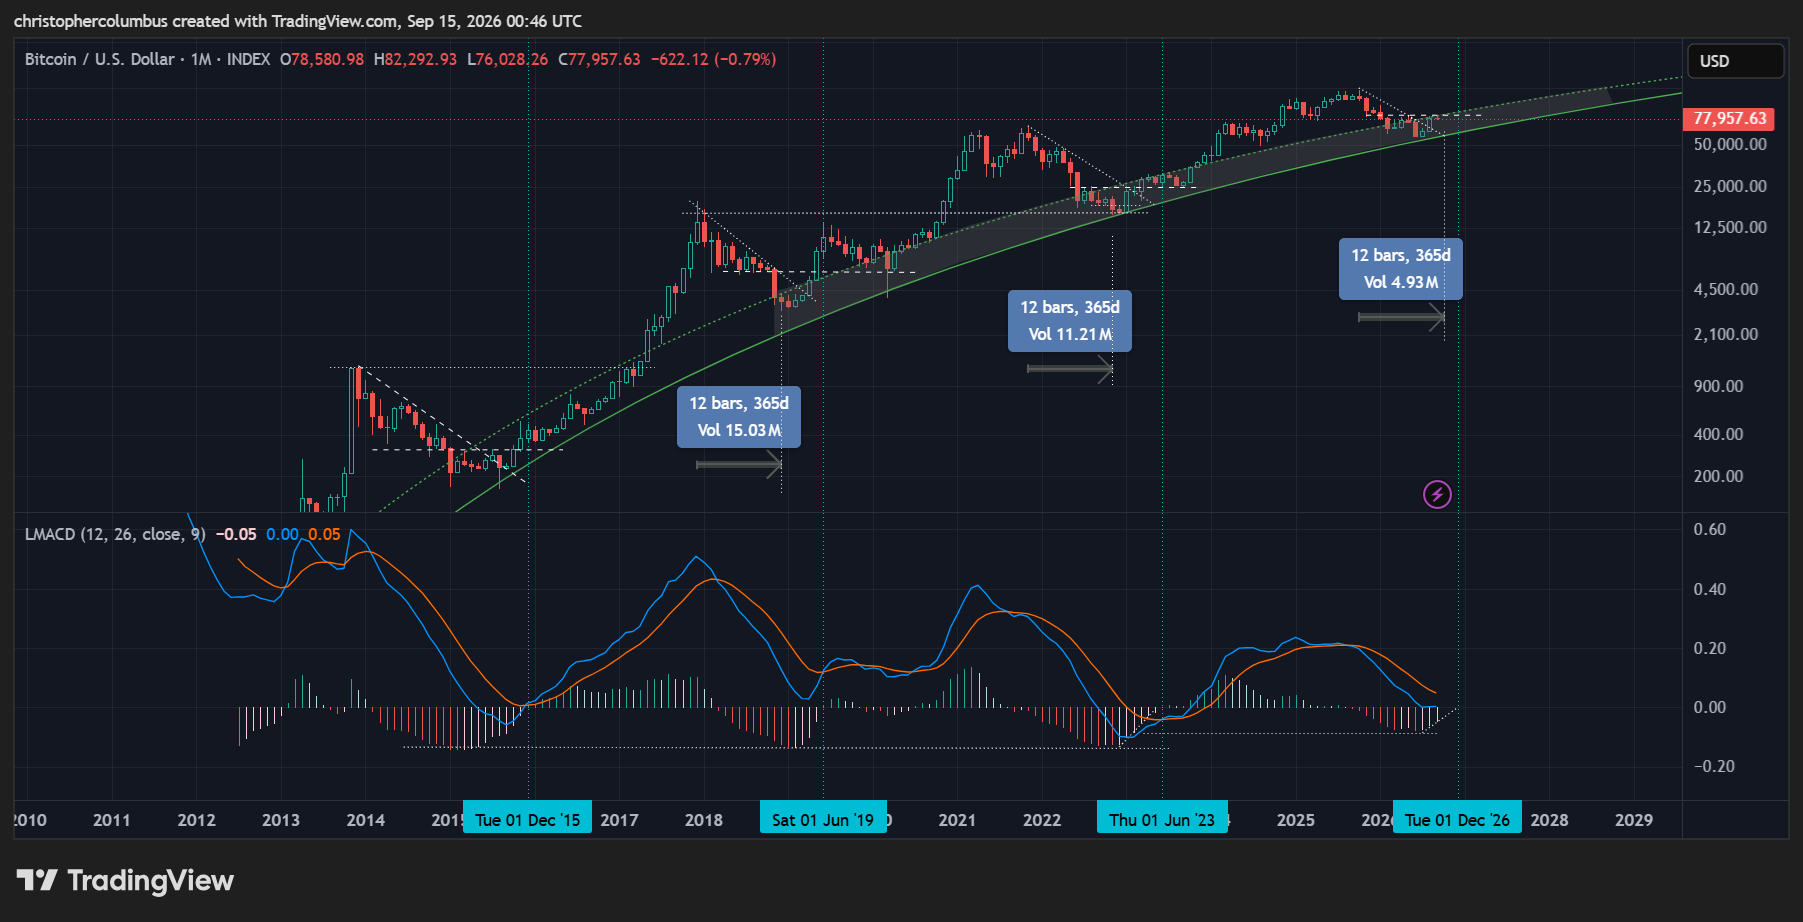
When a one year correction is factored in, where the lows were to be found in previous cycles, the possibility of the low could be next month [the 12th month].
I think more likely though is some consolidation [with the low already in in June], where it is currently meeting resistance to form that basing pattern of a reverse head and shoulders often to be found in technical markets.
Also significant in the chart above is the reducing macro volatility of this cycle [increasing price stability], which is seen in the lowered height of the MACD, and the shortening extension on the histograms as compared to previous cycles.
Below is the possible reverse head and shoulders that I’ve had an eye on for some time now:
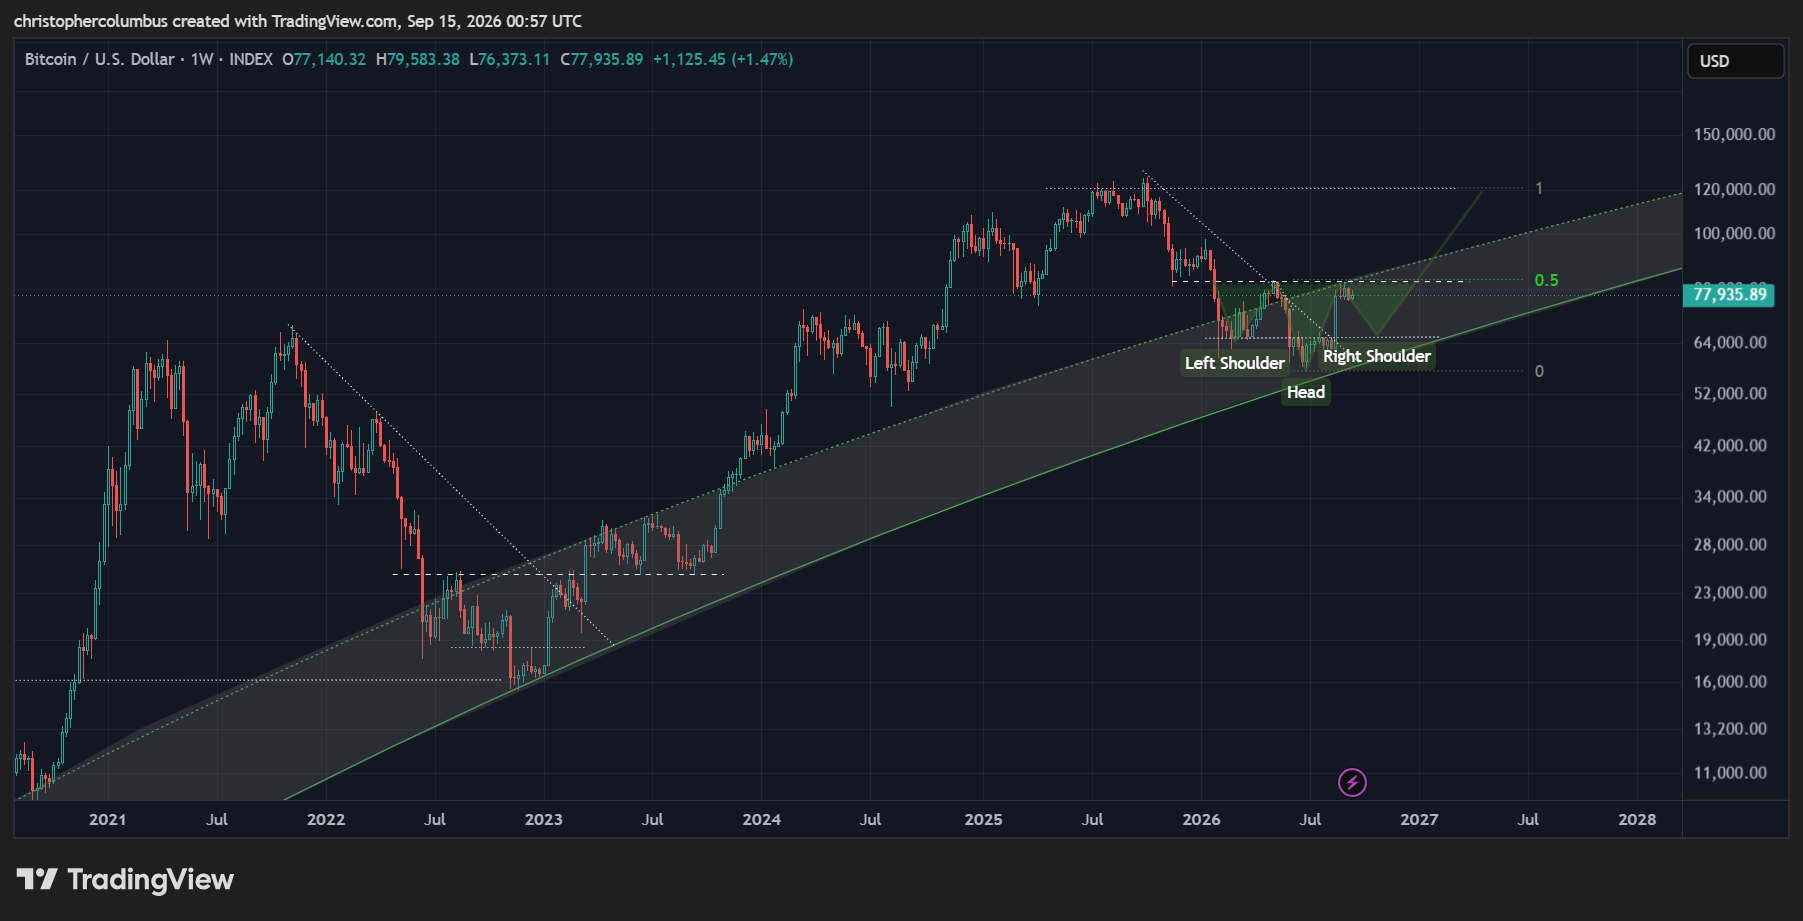
Such a move would see price pushing all-time-highs again next year [on the basis of the fib extension]. Also significant is that basing reverse head and shoulders pattern taking place in the investor’s ‘buy zone’ [on the basis of the Logarithmic Growth Curve that has held good since 2018].
Weekly MACD
Next we could turn to the weekly MACD and see if it corroborates the outlook I’ve projected on the monthly chart.
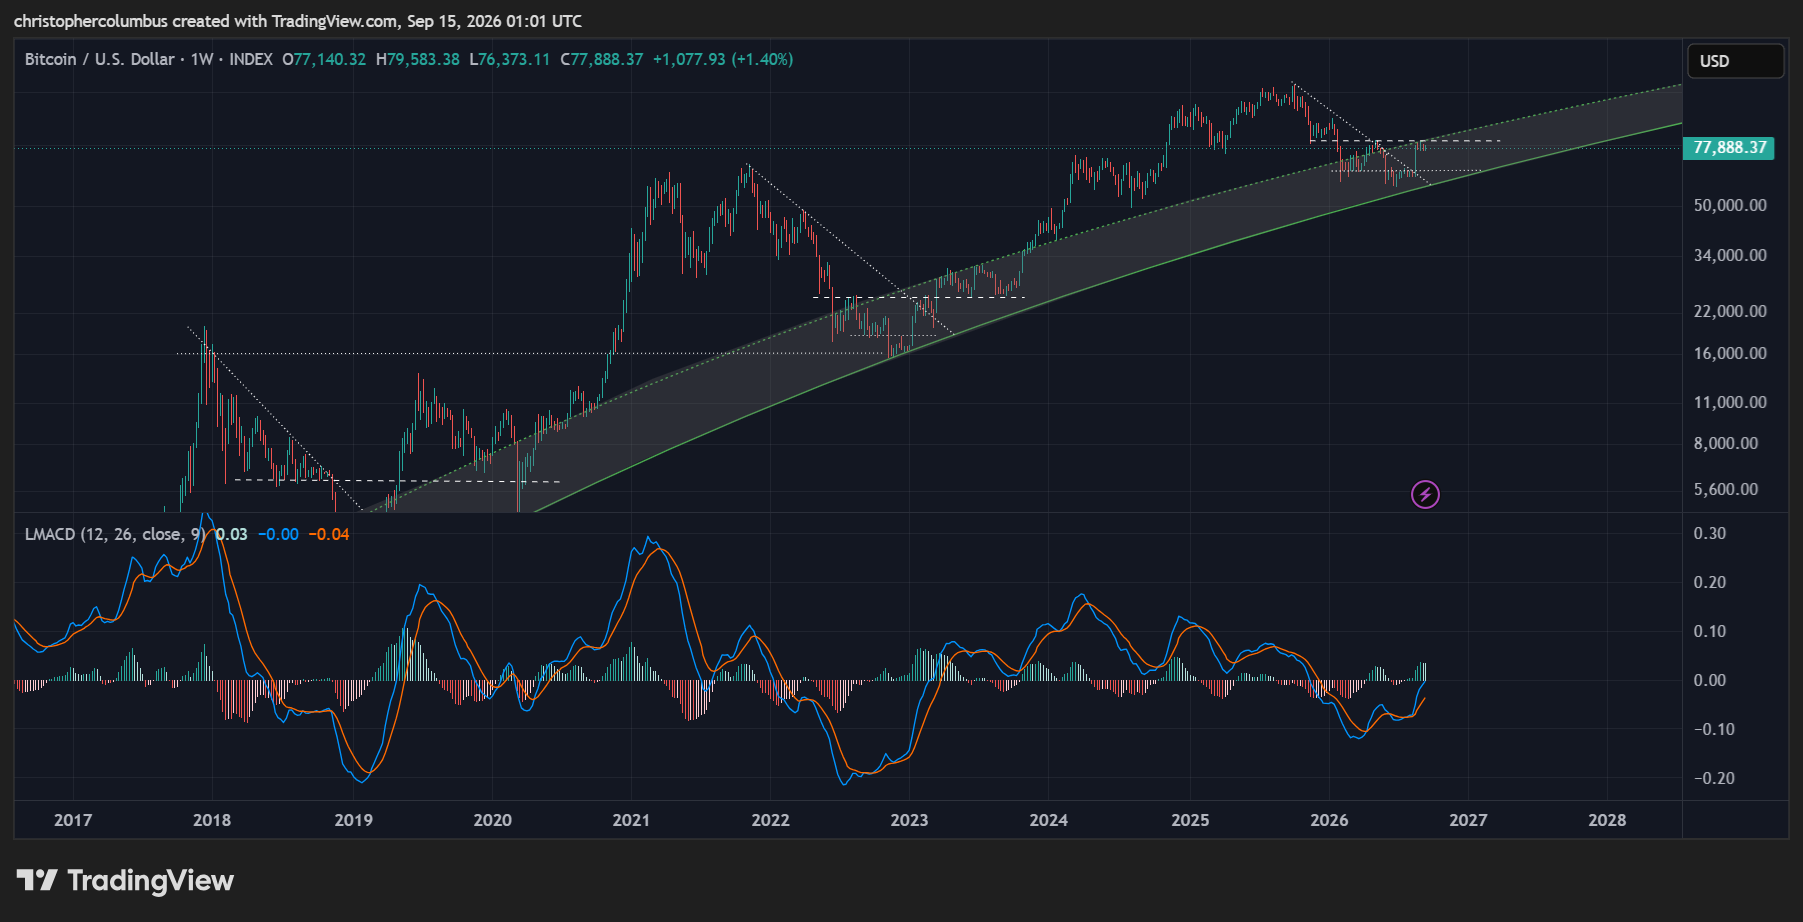
On the face of it, the weekly MACD is also looking positive. It has come back bullishly to the zero line after a period of selling followed by the recent move up, and is currently meeting technical resistance at the line drawn.
The question is whether a bullish MACD could absorb some consolidation as the right shoulder of a reverse head and shoulder is formed. And so to the comparison on the following chart:
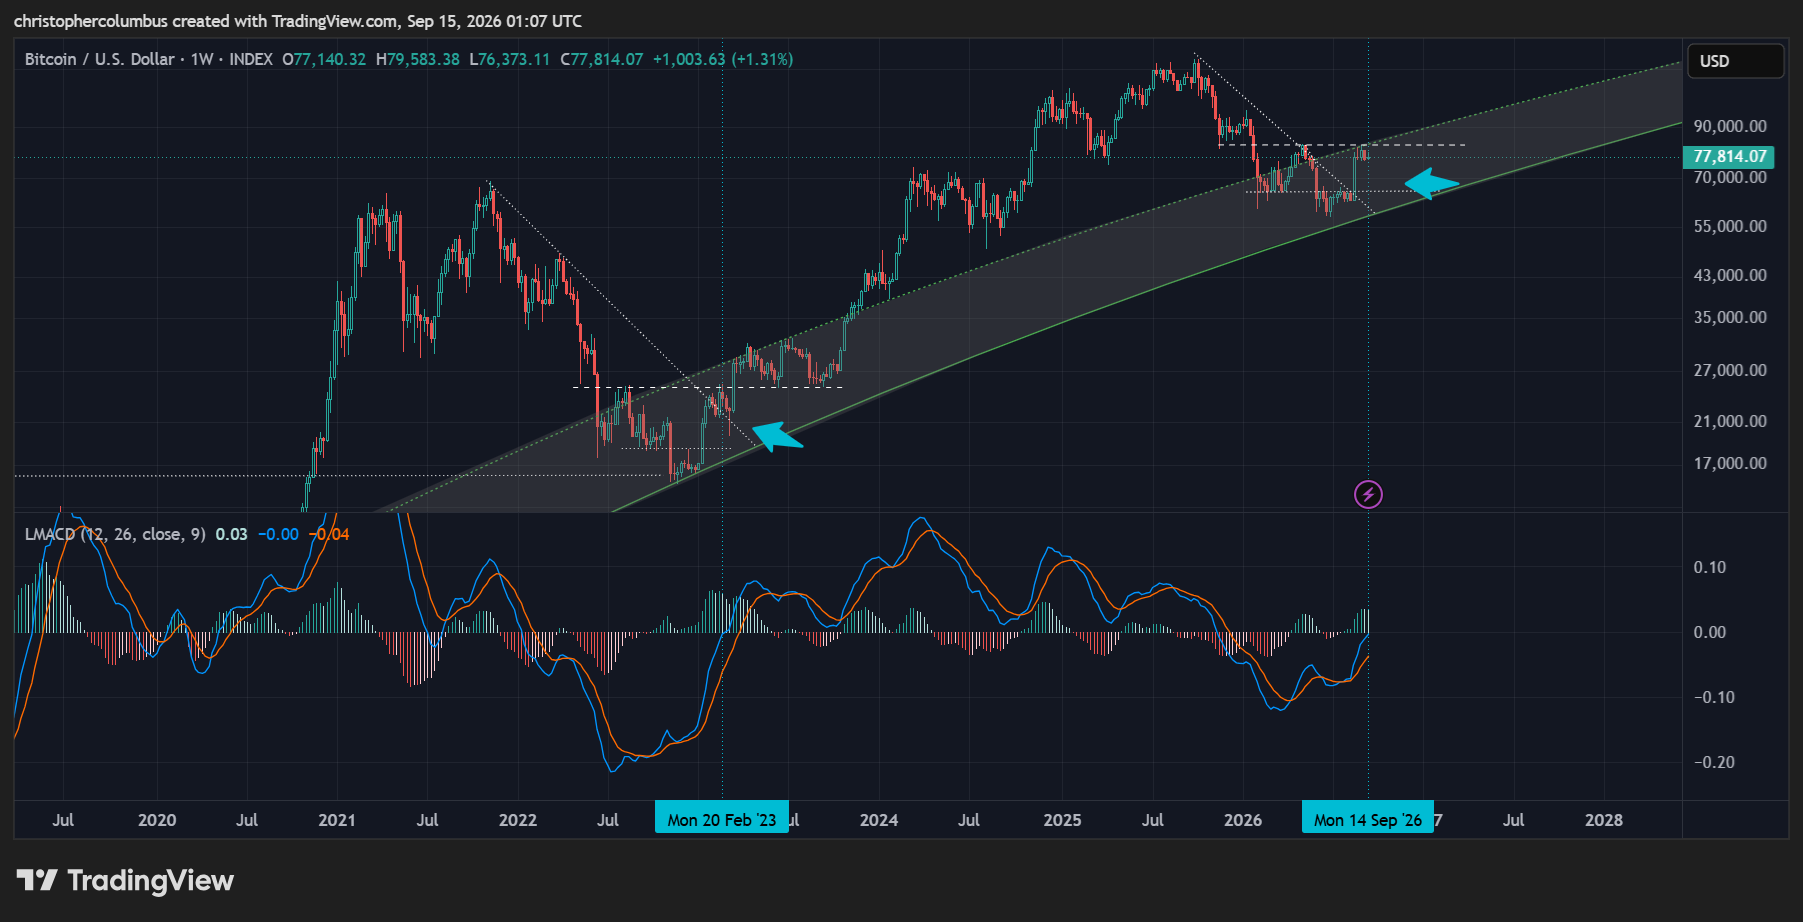
And this has to be of interest. The time line is drawn to show the current weekly MACD meeting the zero line as compared to that meeting in the previous cycle. And yes, there is consolidation over the next few weeks at resistance… and where price though going lower did not go quite so low as to form a shoulder commensurate with the left shoulder formed earlier.
Finally, another chart looking at the 20% nominal drop in price from that level of resistance previously. Interestingly, it lines up with the right shpoulder as sketched.
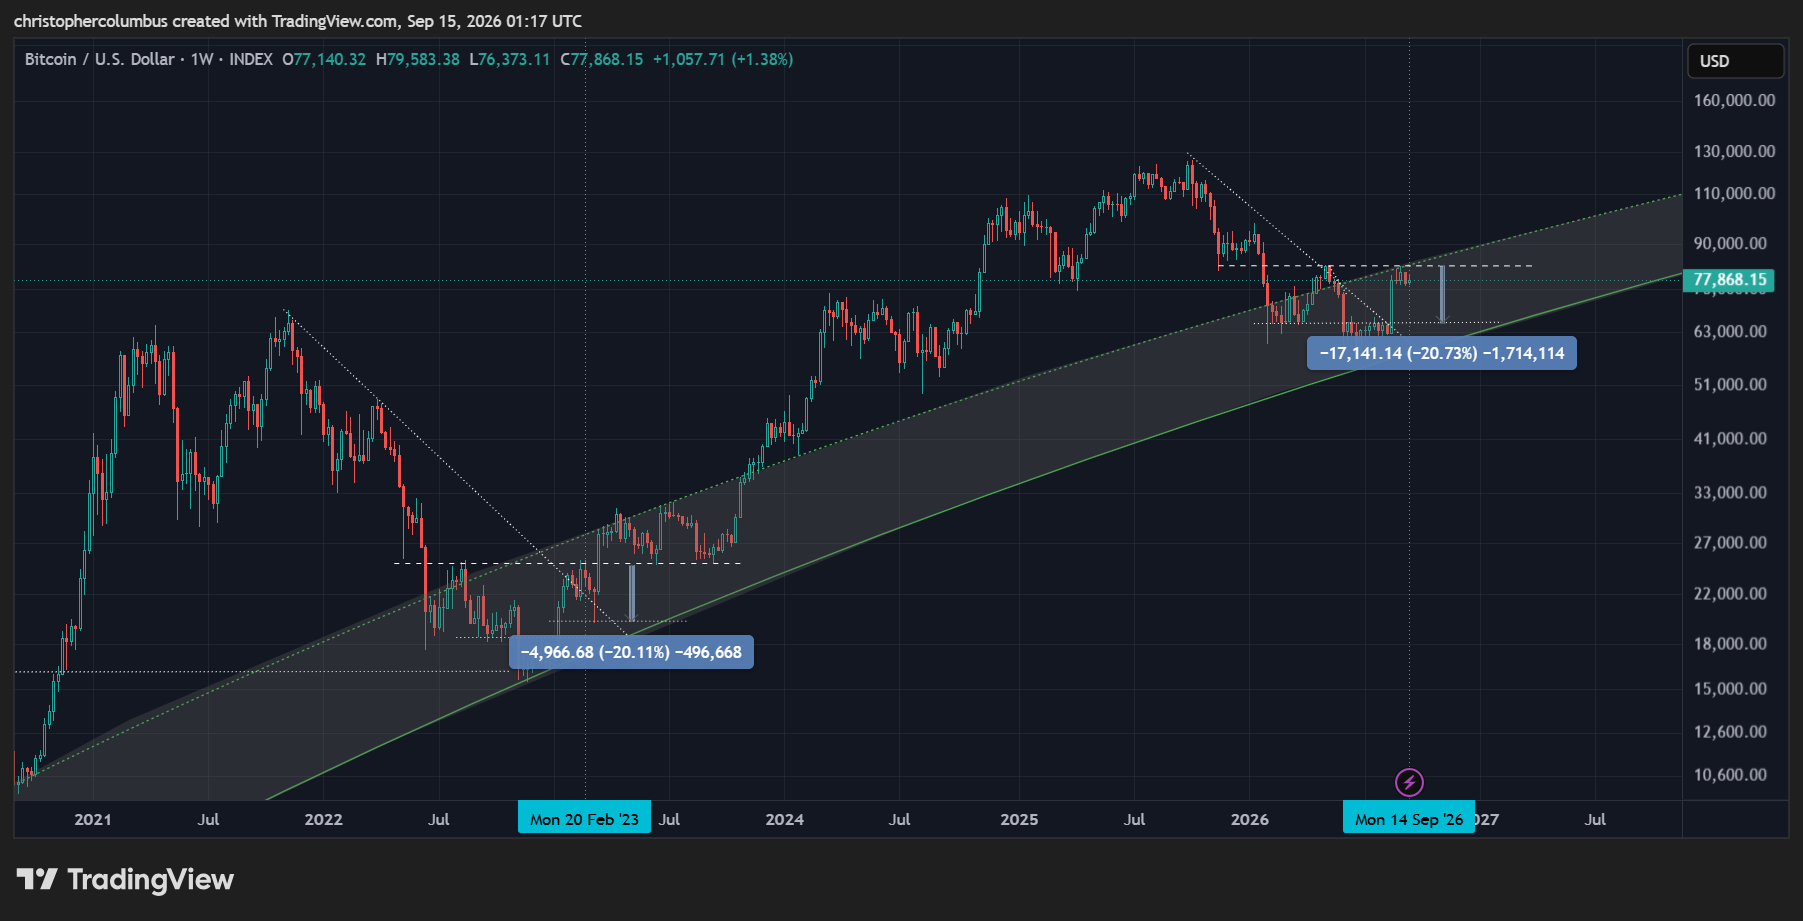
Whether price consolidates to a right shoulder of around 65K or instead consolidates above that price, we can have some confidence based on the technicals that the bottom is in. And with that we should see shortly a renewal of the Bitcoin bull market. The 50K range looks to me like something that now belongs to history.
Until next time,
Stay [relatively] safe out there,
Dave the Wave.