
BTC Price as Relative to the Gaussian Channel
Dear Readers,
Time to zoom out on the BTC chart and look at the Gaussian channel on the longer-term charts in order to get a sense of where market momentum is taking us. I’ve been a great fan of this indicator over the years as I think it enables both holders and longer-term investors to see the developing trend as it relates to the past. On the basis of this, we can extrapolate that trend into the future. If this is the focus, then shorter-term volatility, that is inherently near unpredictable and more random, becomes much less of a concern, where one has more confidence [while never a certainty] about price projection over the medium to long term.
The Weekly Gaussian
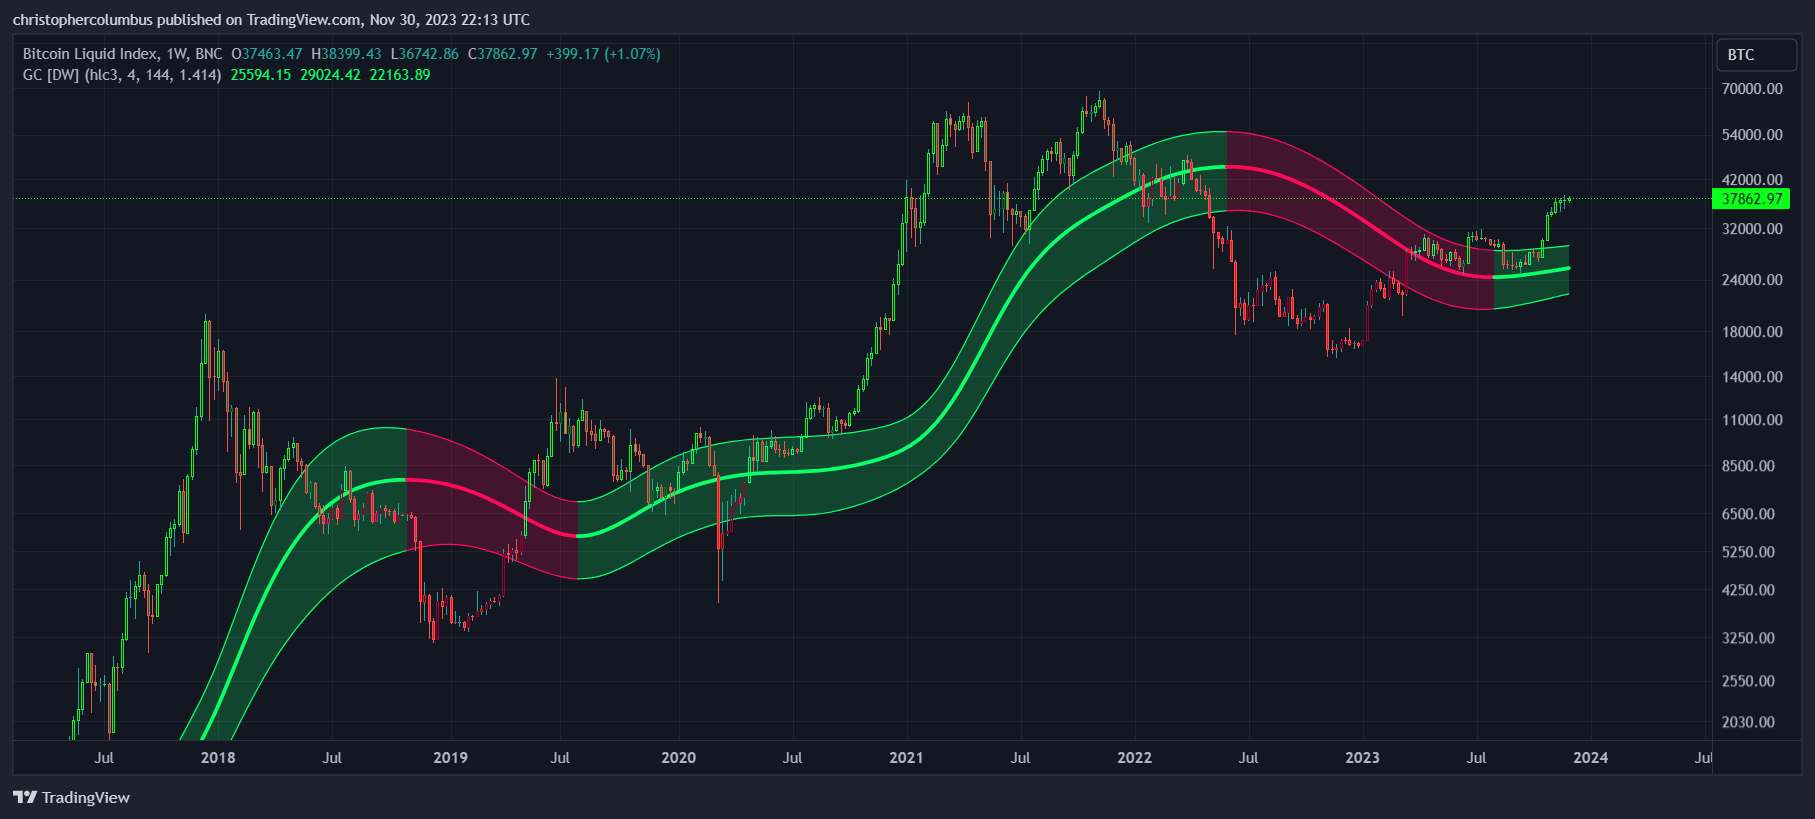
At first sight, the viewer might be slightly alarmed to see price so far extended beyond the Gaussian channel [which serves to effectively function as a median of price], for previously price only went on to capitulate and slice straight through the GC [Gaussian channel]. Yet on further analysis, predicting a simple repeat of this is problematic.

As seen in the above chart, 2019 saw a much shorter, sharper, steeper parabolic rise in price [at the time I referred to this as ‘mini-parabola’ and predicted a sever correction]. This involved half the time period [as comparable to now], a 4.3x rise as compared to a present 2.4x, and a more than doubled rate of appreciation as measured by the degree. In short the run-ups are quite dissimilar. This is turn suggests that, from a technical perspective, any correction that might ensue would also be quite dissimilar. On further zooming, further comparison is ascertainable on this momentum indicator.
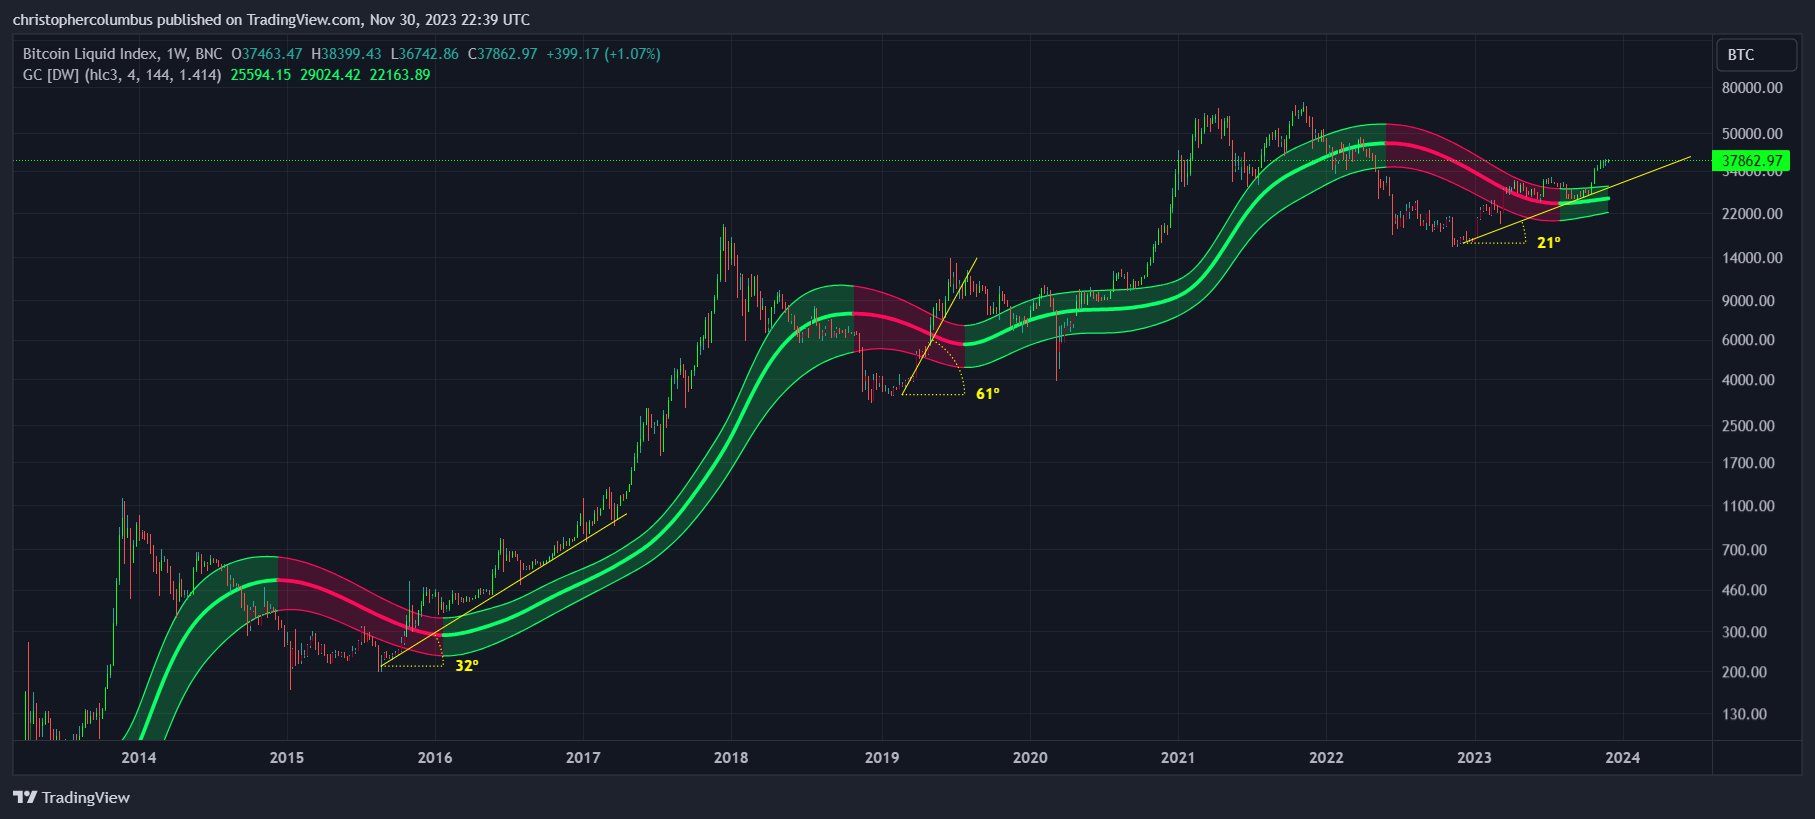
Here we can clearly see that the rate of appreciation is relatively subdued as compared to both the previous run-ups through the weekly Gaussian. Whereas the 2016 run-up held its trend to eventually go parabolic, the 2019 didn’t as it was already parabolic as can be seen in the following chart that measures the parabolic rises.

The takeaway on the weekly Gaussian chart: as relative to the weekly GC, the current trend in price is relatively subdued and sustainable as seen in the chart below. If we were to see a move in the short-term to the downside, it would likely be more of a modest consolidation than a severe correction.
On the other hand, there is plenty of room for price to move to the upside on the basis of the relatively sustainable year-long recent trend. That said, if price were to break out of this trend, and go on a run to previous all-time-highs, one would have to start asking whether that price action were parabolic/ sustainable. Personally, in that eventuality, I’d not at all be surprised should price meet resistance at those previous highs.
Keep in mind here that it is not my intention to say what exactly price will do in the short-term [a fool’s errand in my opinion], but to say that price is currently showing strength within a sustainable trend - if it were to consolidate within the year-long trend, this would hardly be a concern for those reasonably investing and gaining exposure for the longer-term.

The Monthly Gaussian
On zooming out, and even before putting the GC on the chart, you can see how close, in logarithmic [and real] terms, current price is to the all-time-highs. This zoomed out view can function as a corrective to the zoomed in view, where the nominal value/ price is seen as tens of thousands of dollar off the highs [the over-emphasis on nominal values in an exponentially moving market I’ve discussed before as a form of money illusion]. As you can see at first glance, price is potentially only a month or two from pushing the highs if the market gets heated.

On the monthly GC chart below, we can see that the top of this channel on this even longer-term indicator of momentum has previously functioned as support. This time around, the central median line of that channel has provided support. I think this development reflects the notion of a maturing less volatile market.

This macro and qualitative difference in the market is something that should also be factored into all technical analysis in my opinion - as BTC continues on its path toward capitalization, the base price should settle on this median whilst the height of the heated runs above the median on heated markets should reduce consistent with the idea of diminishing returns and eventual price discovery/ capitalization as reflected in the following chart. If the sequence of exponential moves off the median line is continued, we could factor in a target on a technical basis. If say, we saw a parabolic run at the end of next year, and it was to be a quartered return of the previous, then this would suggest a target of 120k odd. This may fall short of many expectations, but if you factor in a lessening macro volatility in price, then the correction also should be less drastic. Something also to consider is that these grand 4 year cycles will at some point surely have to break. A maturing and more liquid market would lead to the possibility of more frequent ‘mini parabolas’ such as was intimated by the 2019 run. Such speculations were explored 3 years back in Cycle Theory Revisited

Finally, an overlay of the LGC model with the monthly GC as follows in the chart below. The LGC buy zone for investors, the lower shaded band of the LGC channel, happens to currently coincide exactly with the upper half of the Gaussian channel that functions as macro support. Personally, I find this quite remarkable [and so remark on it] - both the long term Gaussian channel, a technical momentum indicator, and the LGC, primarily a macro concept, corroborate each-other in putting a floor under price.
Given these long-term indicators, I would argue that longer-term investors, and for that matter conservative institutional money, have every confidence in investing a portion of their funds… even if they don’t have a cast-iron certainty, which is always beyond the remit of investment anyway.

Until next time,
Stay, relatively, safe out there,
Dave the Wave.