
BTC Price Location on the LGC Model
Dear Readers,
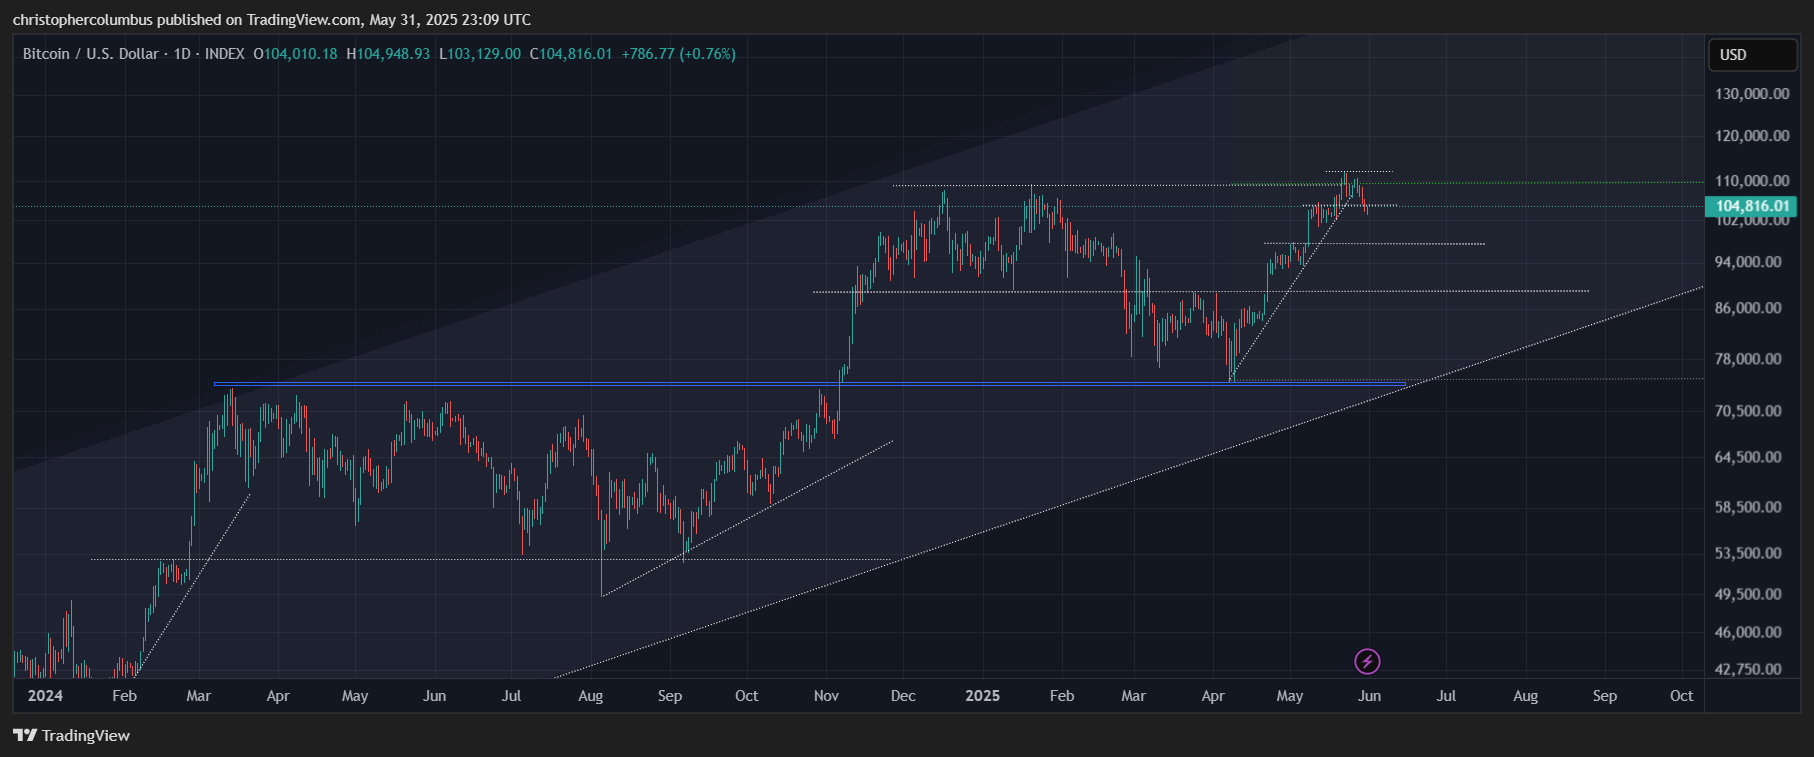
No breakout as of yet with price still around that 100k mark. A price which a year ago would have had the market very exciting, but now, after half a year at these levels, one that the market has got quite used to.
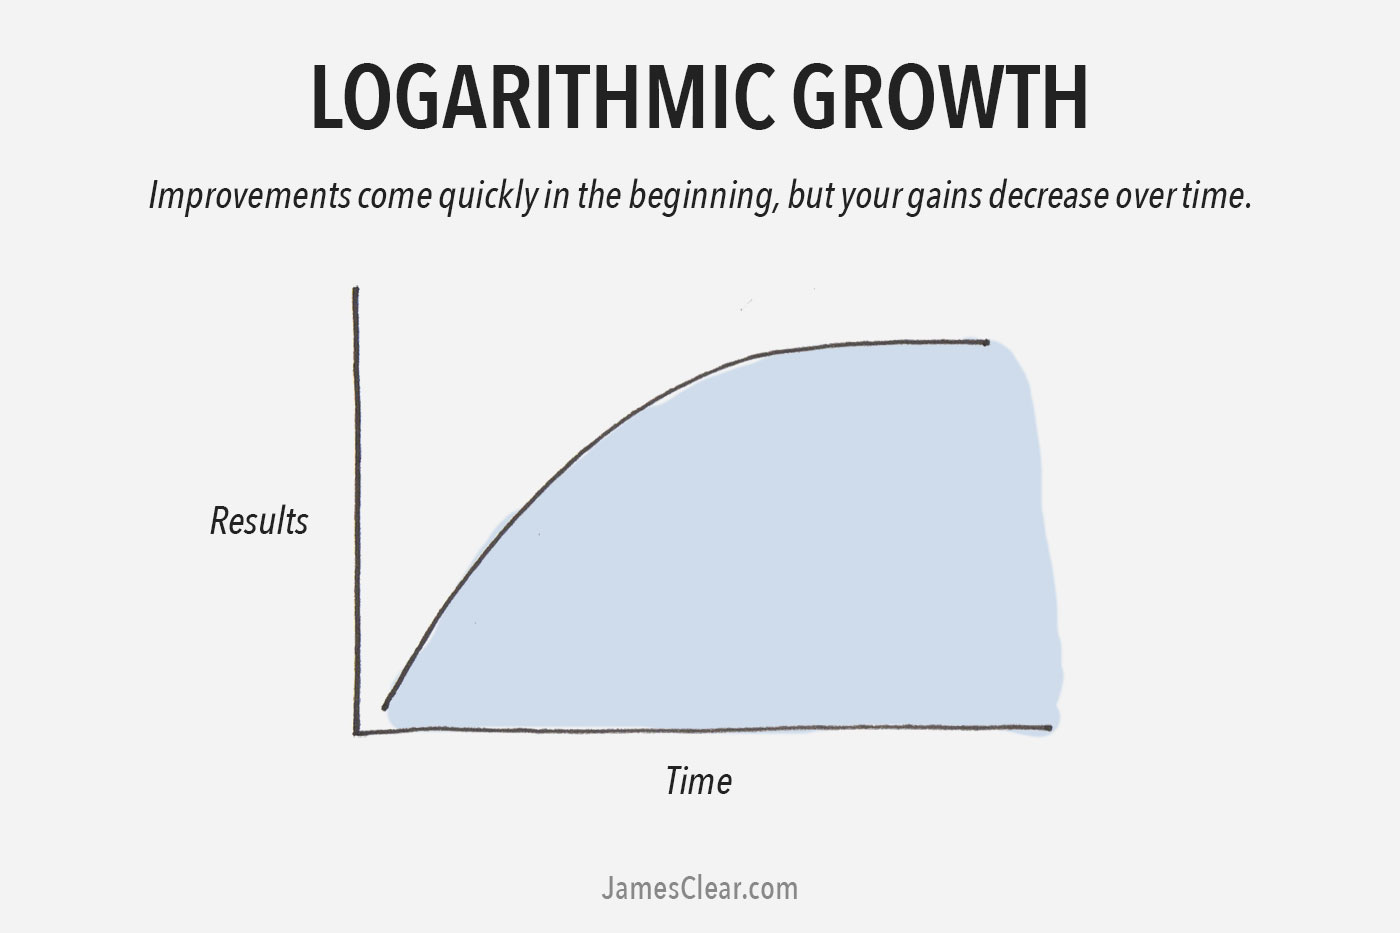
The observer of price, without some reference point, could be left disorientated here - has price peaked, is the cycle over, could it move higher, is a serious consolidation in the wings? In my opinion, the LGC model [which has performed since 2018] serves to orientate the investor in providing external reference points that make some sense of the otherwise random price movement. I say some sense as no model is ever going to provide us with certainty. Rather, it provides a reasonable basis on which to make an investment, where all investment should be hedged.
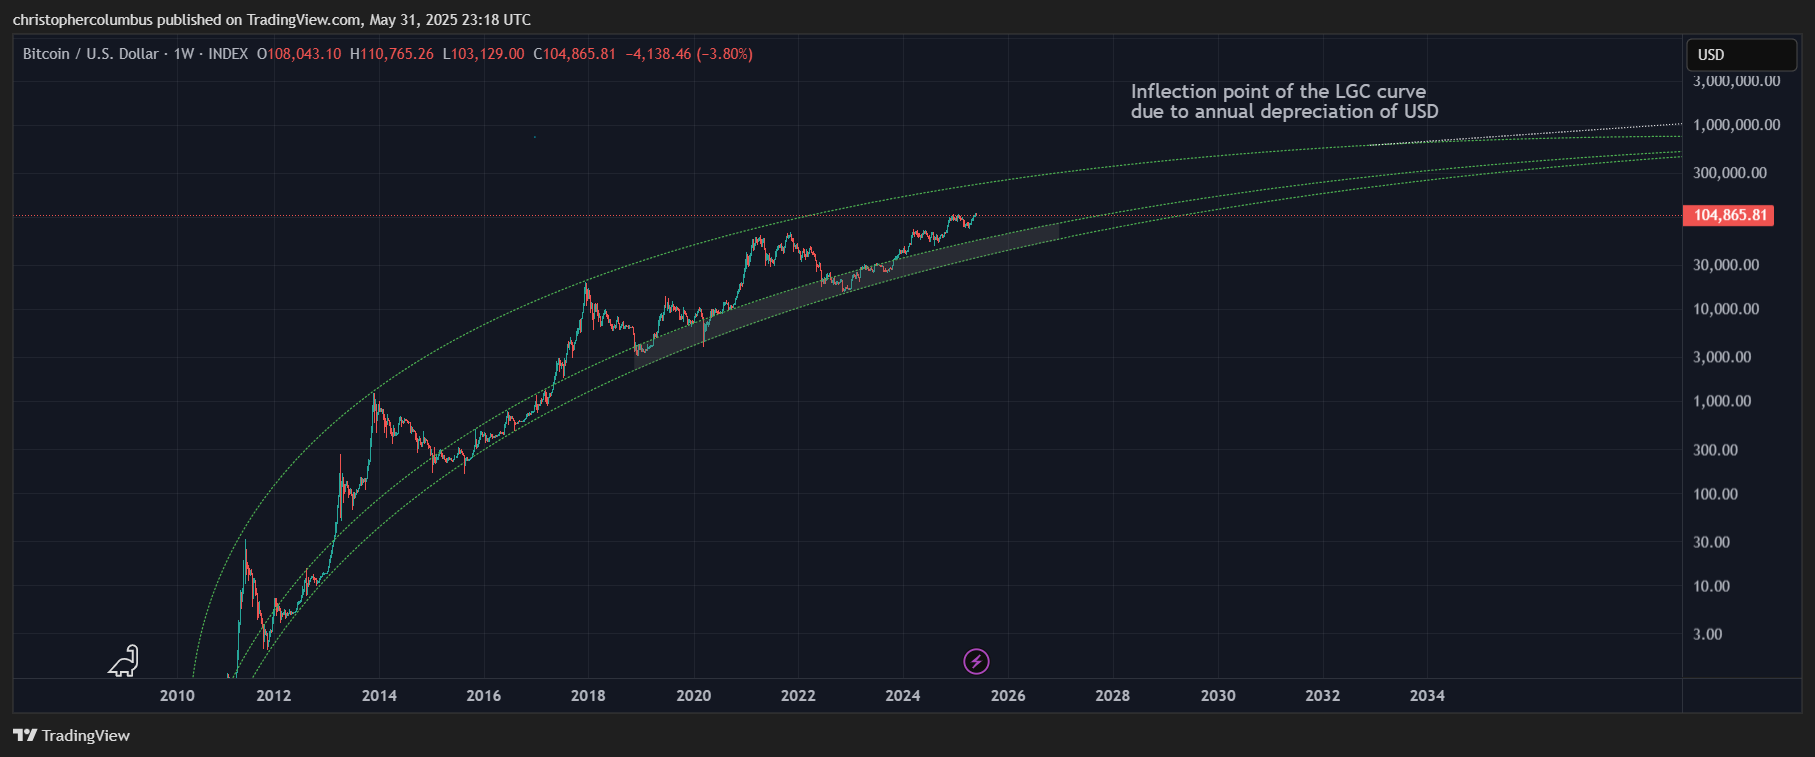
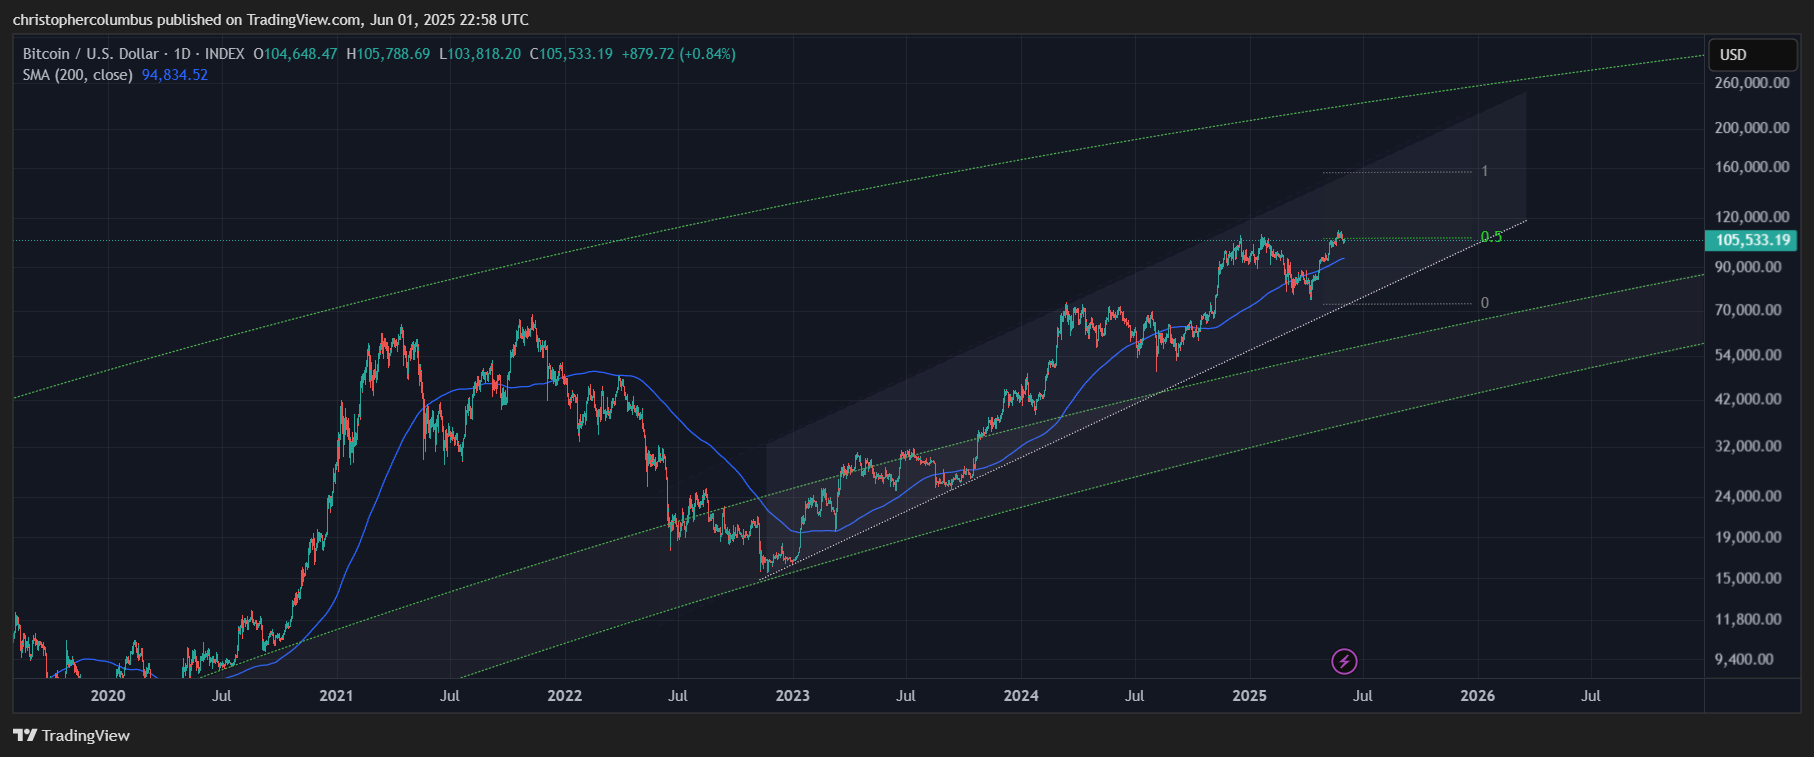
Here is the zoomed out view of price development over multiple cycles as contained within the LGC model. The technical channel has been removed from the chart for the moment in order to focus on the LGC model and where price is currently situated relative to it. The shaded area represents the ‘buy zone’ that has been on the chart/ model since 2018. For investors, looking to make optimal entries in real time, it has performed very well indeed. Of course, the correlation to buying is selling [depending on your time preference]. And here the model helps also in portraying where price may be getting high. Further, the importance of a model on the logarithmic scale is it helps to negate the effects of ‘money illusion’, where we can be overly impressed with a higher nominal price - in log terms, the price rise may not be that impressive at all. Zooming in on price as located within the LGC model helps to illustrate this.
The first thing noticeable here has to be the relatively modest move in price over the course of this cycle as relative to the previous cyclical moves. This is why I’ve been referring to the technical nature of price increases [as per the first chart] this time around in contrast to the more parabolic nature of price moves previously. I’ve also both predicted and explained this price action in term of a maturing market.
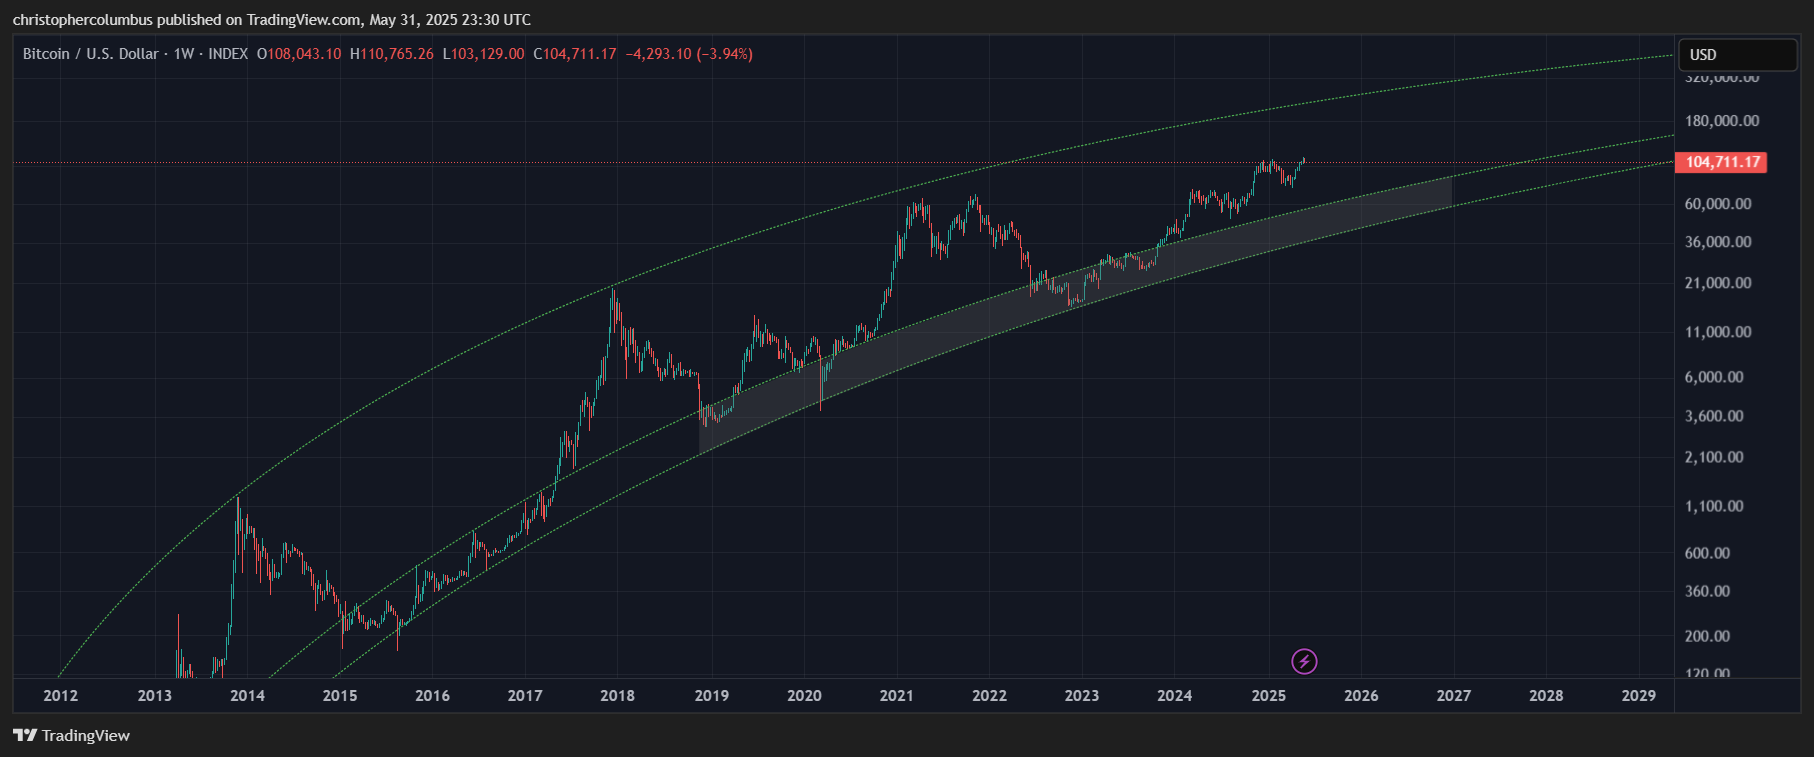
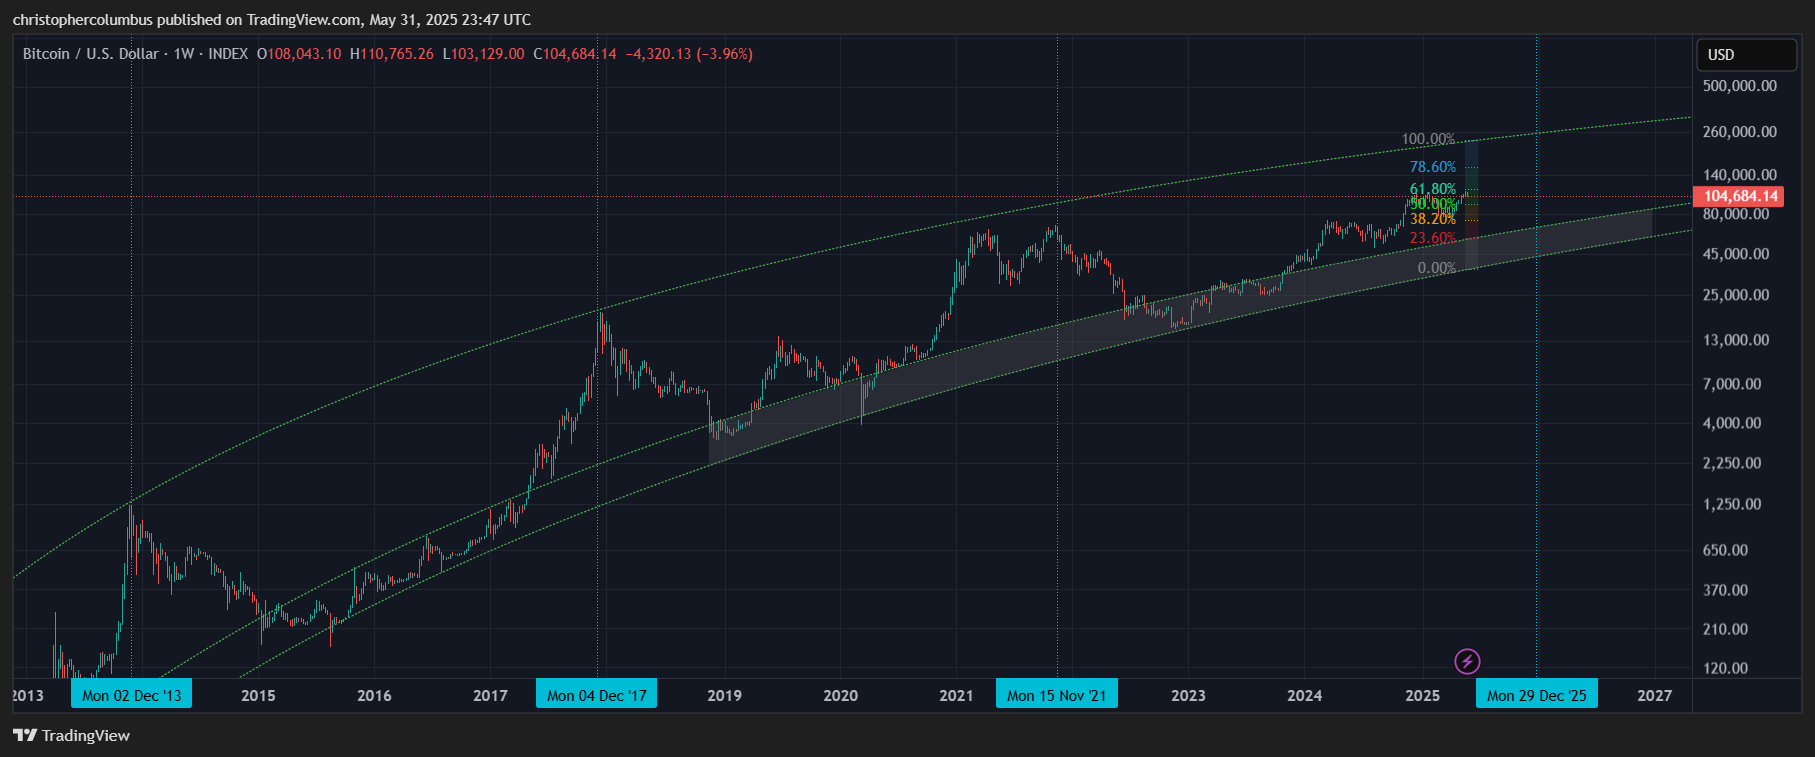
That price has been moving more technically, i.e.; not getting over-heated in a manic market, suggests also a more sustainable price action - price moves up, consolidates, rinse and repeat. It seems reasonable to look for yet another such round, especially when we consider that price is currently located only just over half way through the LGC channel as per the following chart.
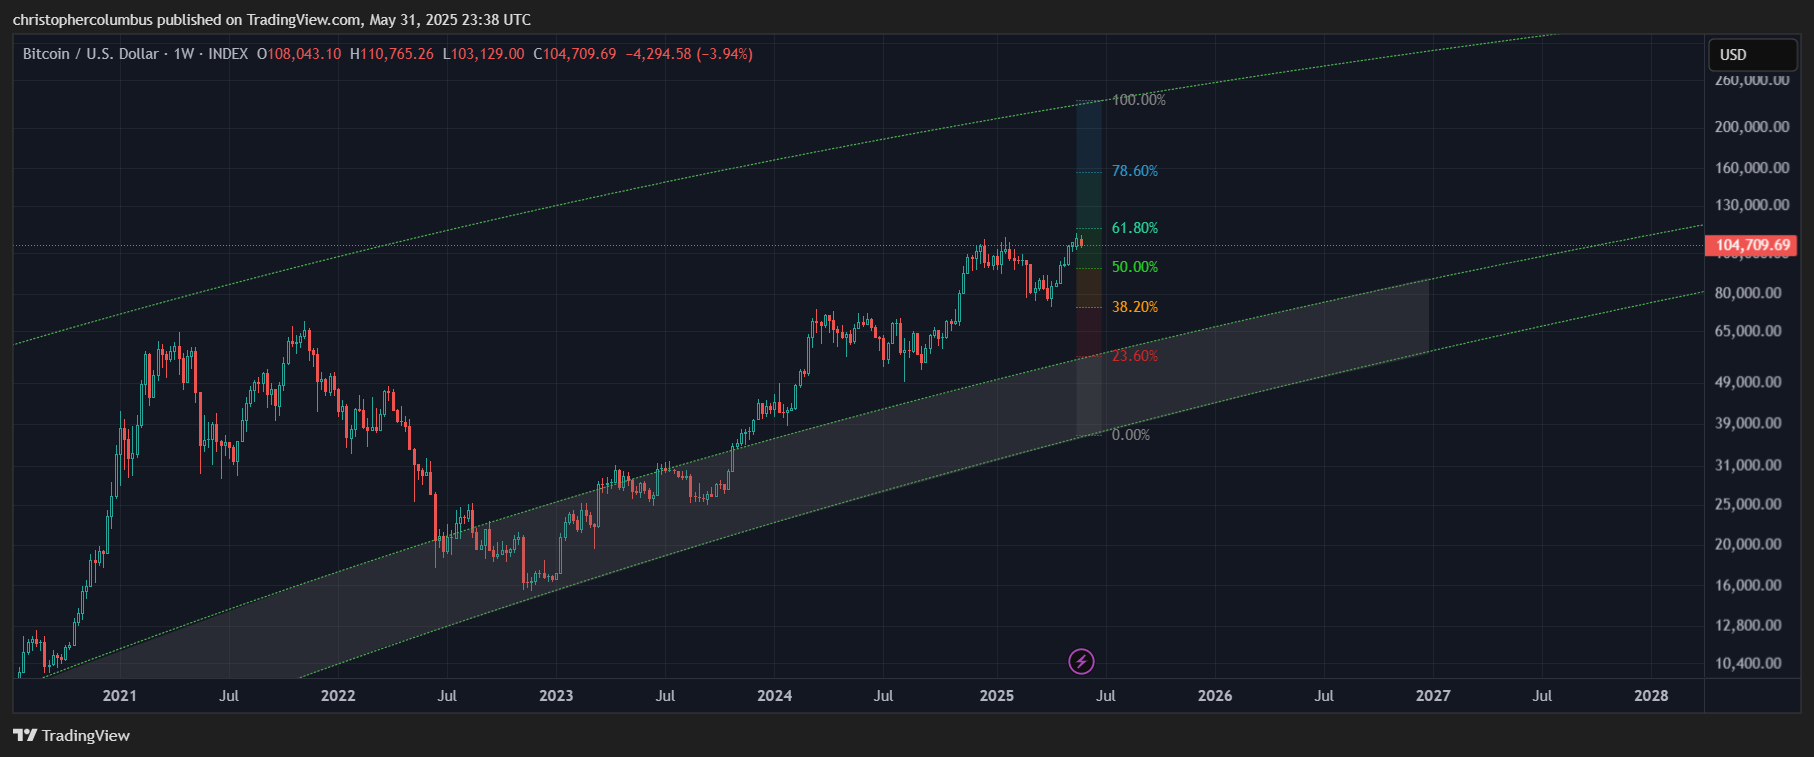
Even if we discounted conservatively the top level [above 78%], and on the basis of the previous peak not hitting the top, this would still give a target around 160k, a number that also happens to match up with other technical projections.
Factor in also the 4 year cycle, that has yet to be invalidated [despite the prediction that it will be at some point in a maturing market], and you’ve some reason to be expecting those higher prices.
And zooming back in again, now with the technical channel once again overlaid onto the LGC model, we can see the corroboration of the technical target of 160k [fib extension] with what seemed a reasonable target on the LGC model [getting into the upper range].
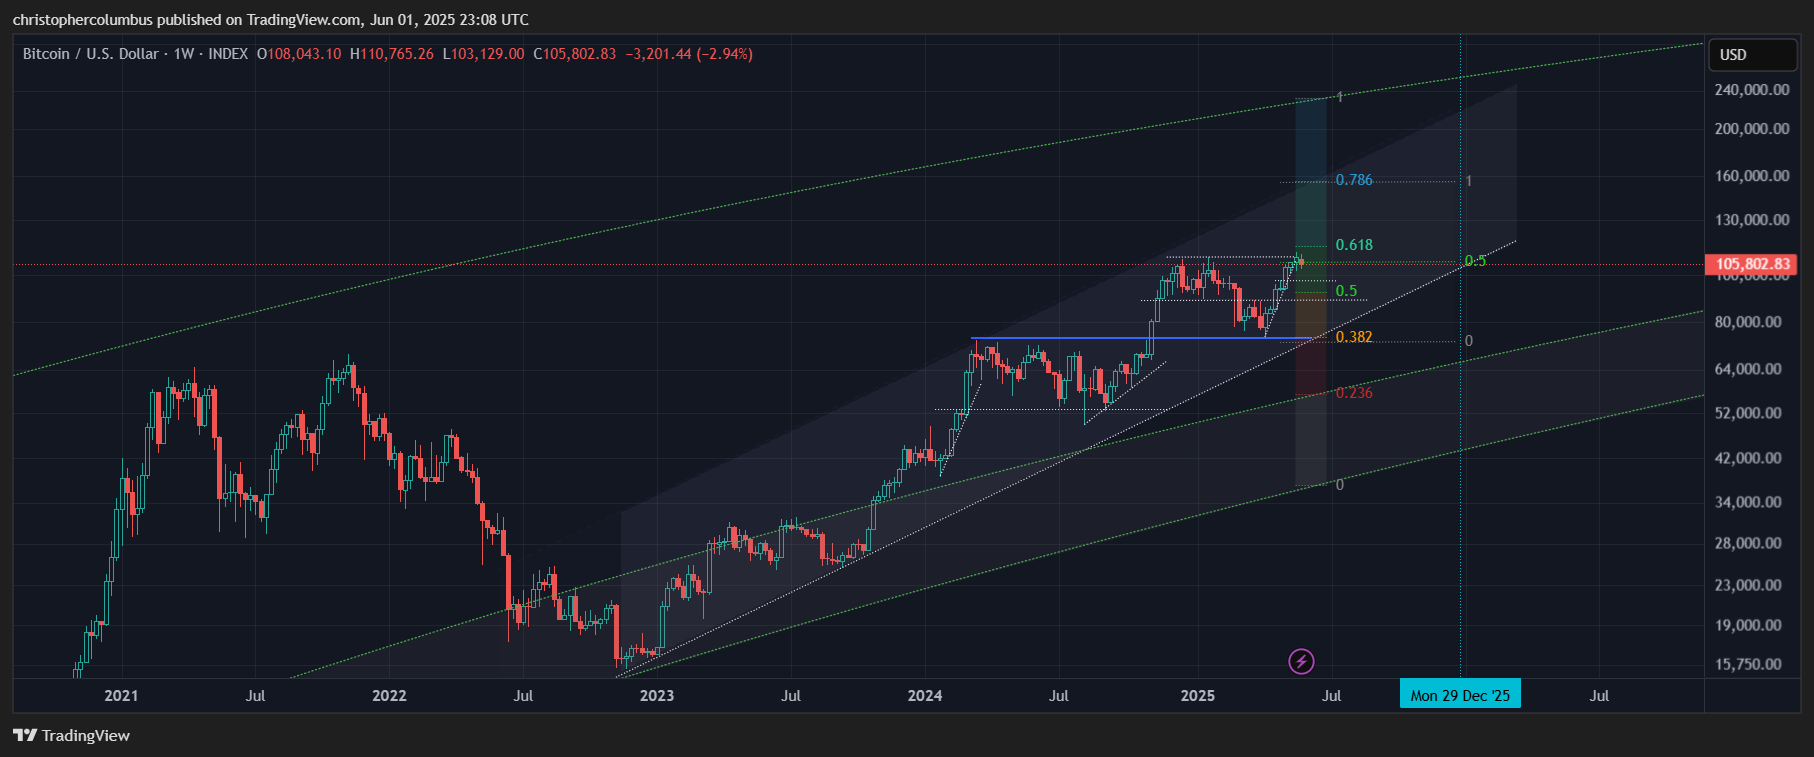
If the culmination of this cycle is assumed to once again be at the end of this year [the end of a 4 year cycle], then the target would be more reachable on purely technical grounds with a prior period of technical consolidation [and so not requiring an immediate parabolic move].
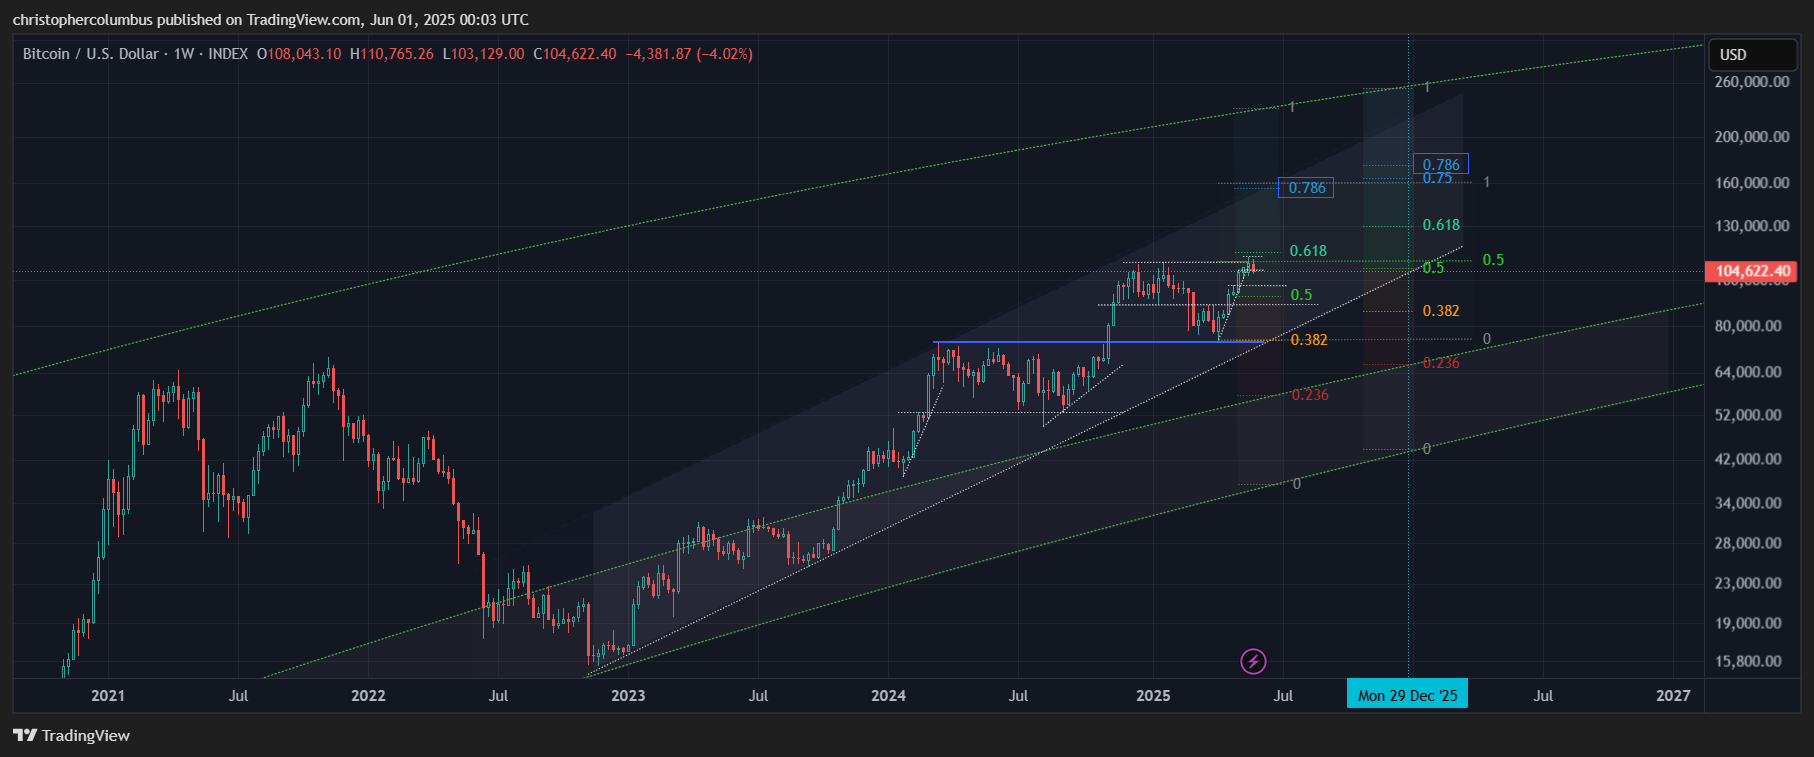
Also of note [below], if the LGC channel measurement is to be moved over to the end of this year, is that the 160k target is even more modest in terms of the LGC… reaching only 75% odd of the channel top as opposed to the previous higher measurement.
The significance of this is to show how feasible a 160k target actually is in both log terms [technical] and in terms of the LGC model. Strengthening the projected target, or giving it extra weight, is the fact that two varying methods combine to give the same target [corroboration].
And finally, a look at a moving average that smooths out the volatility and allows for some tolerance toward possible lower price in the interim before a possible move higher.
Where the relatively conservative investor, or trader, may look at the 160k area as the beginning of a ‘sell zone’, a more speculative/ ambitious trader may look for prices that while still capped by the LGC upper channel may exceed 160k up toward the 200k area, where in LGC terms price would be getting stratospheric. Then again, there will be the investors/ traders with a longer time preference that might choose to sit on their core BTC position while choosing also to take profits in the more volatile alts instead. Once again, all about timing.
Until next time,
Stay [relatively] safe out there,
Dave the Wave.