
BTC Price Update
Dear Readers,
Shorter-Term
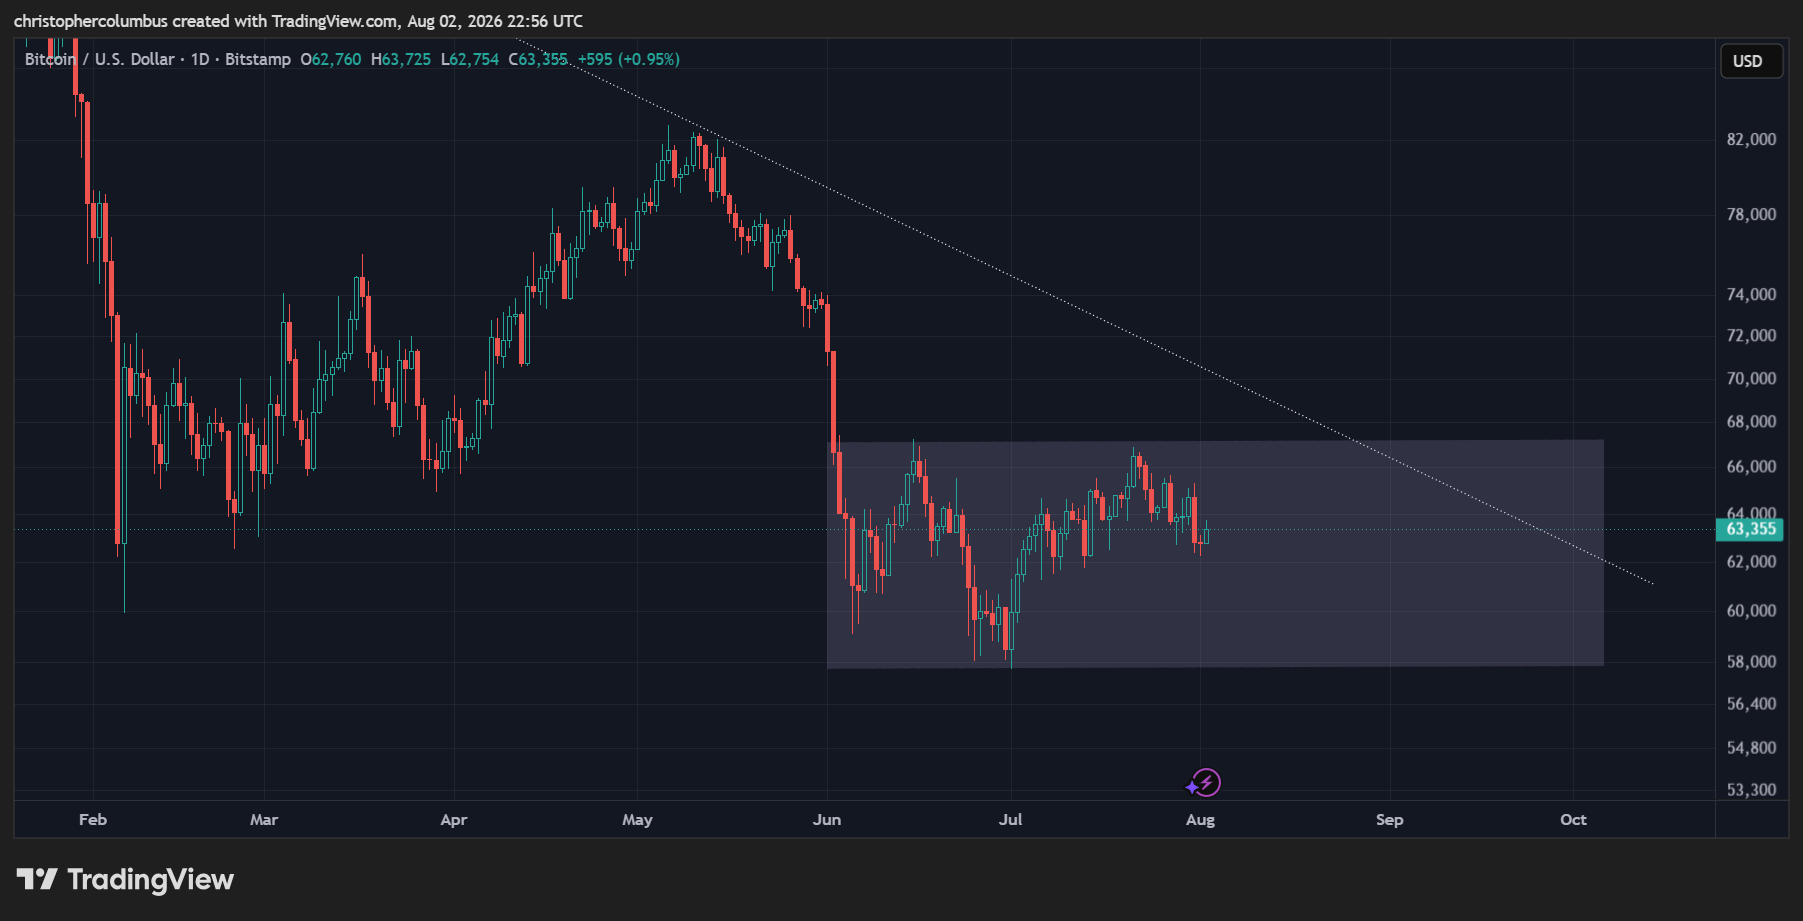
Currently, we find price action in a multi-month 10K range between 57 and 67K.
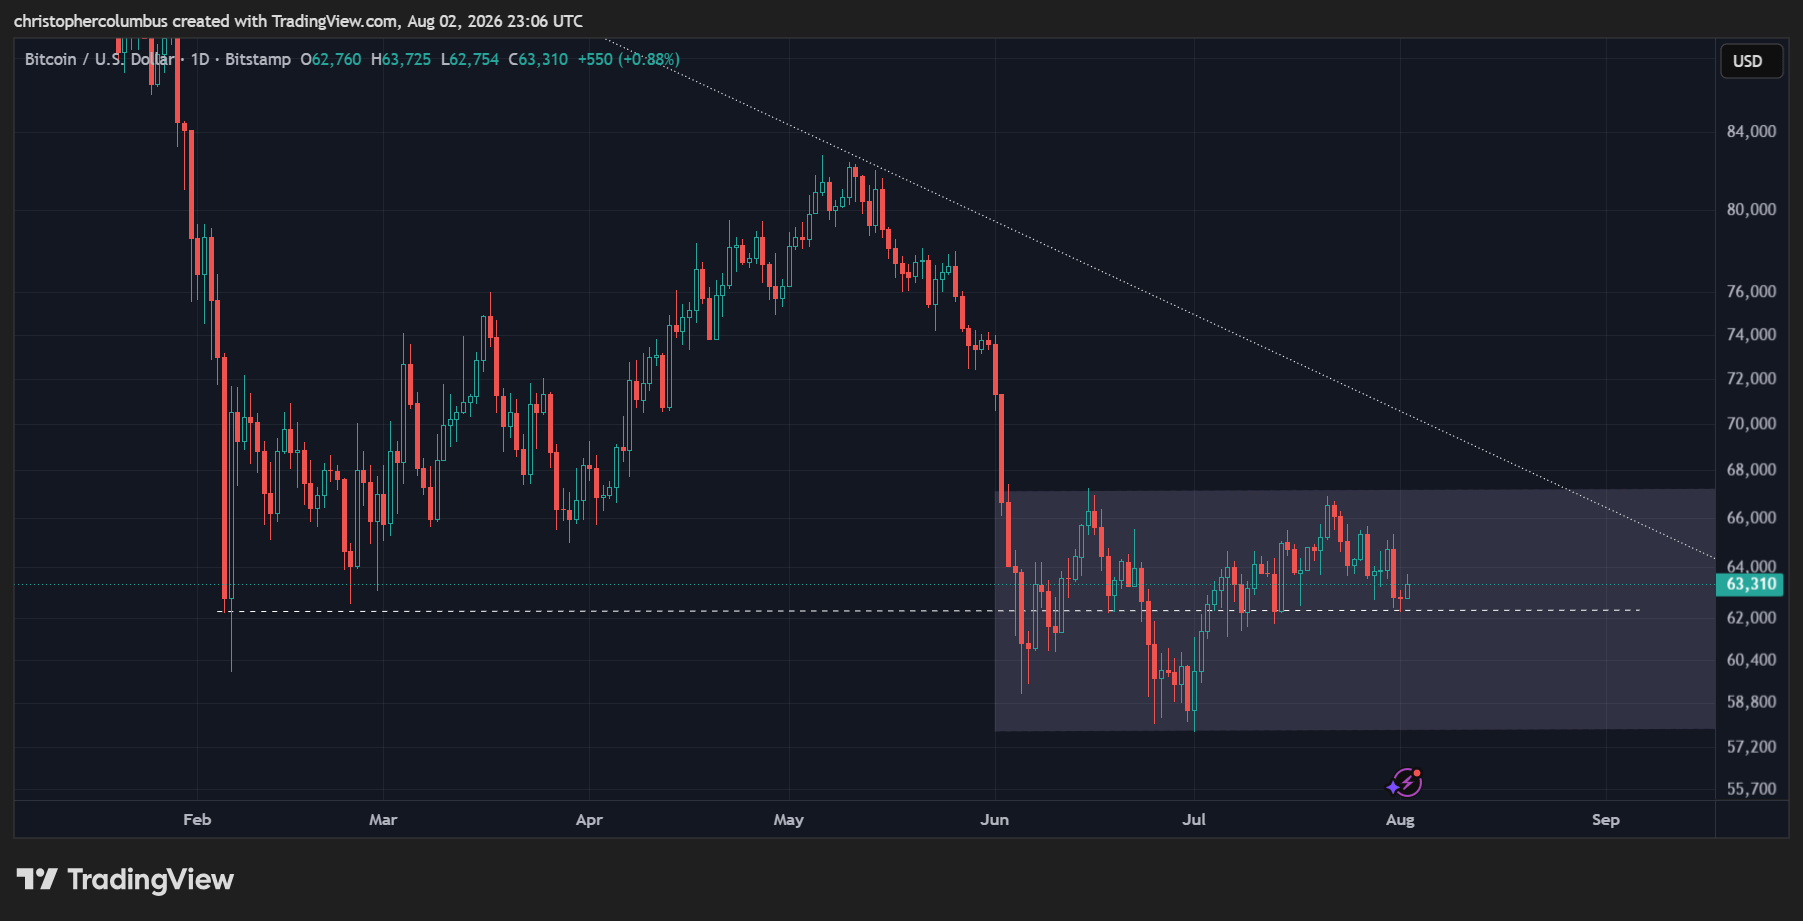
Given this range is also situated on the capitulation event 6 months back, price is holding up relatively well…. re-testing that previous area.
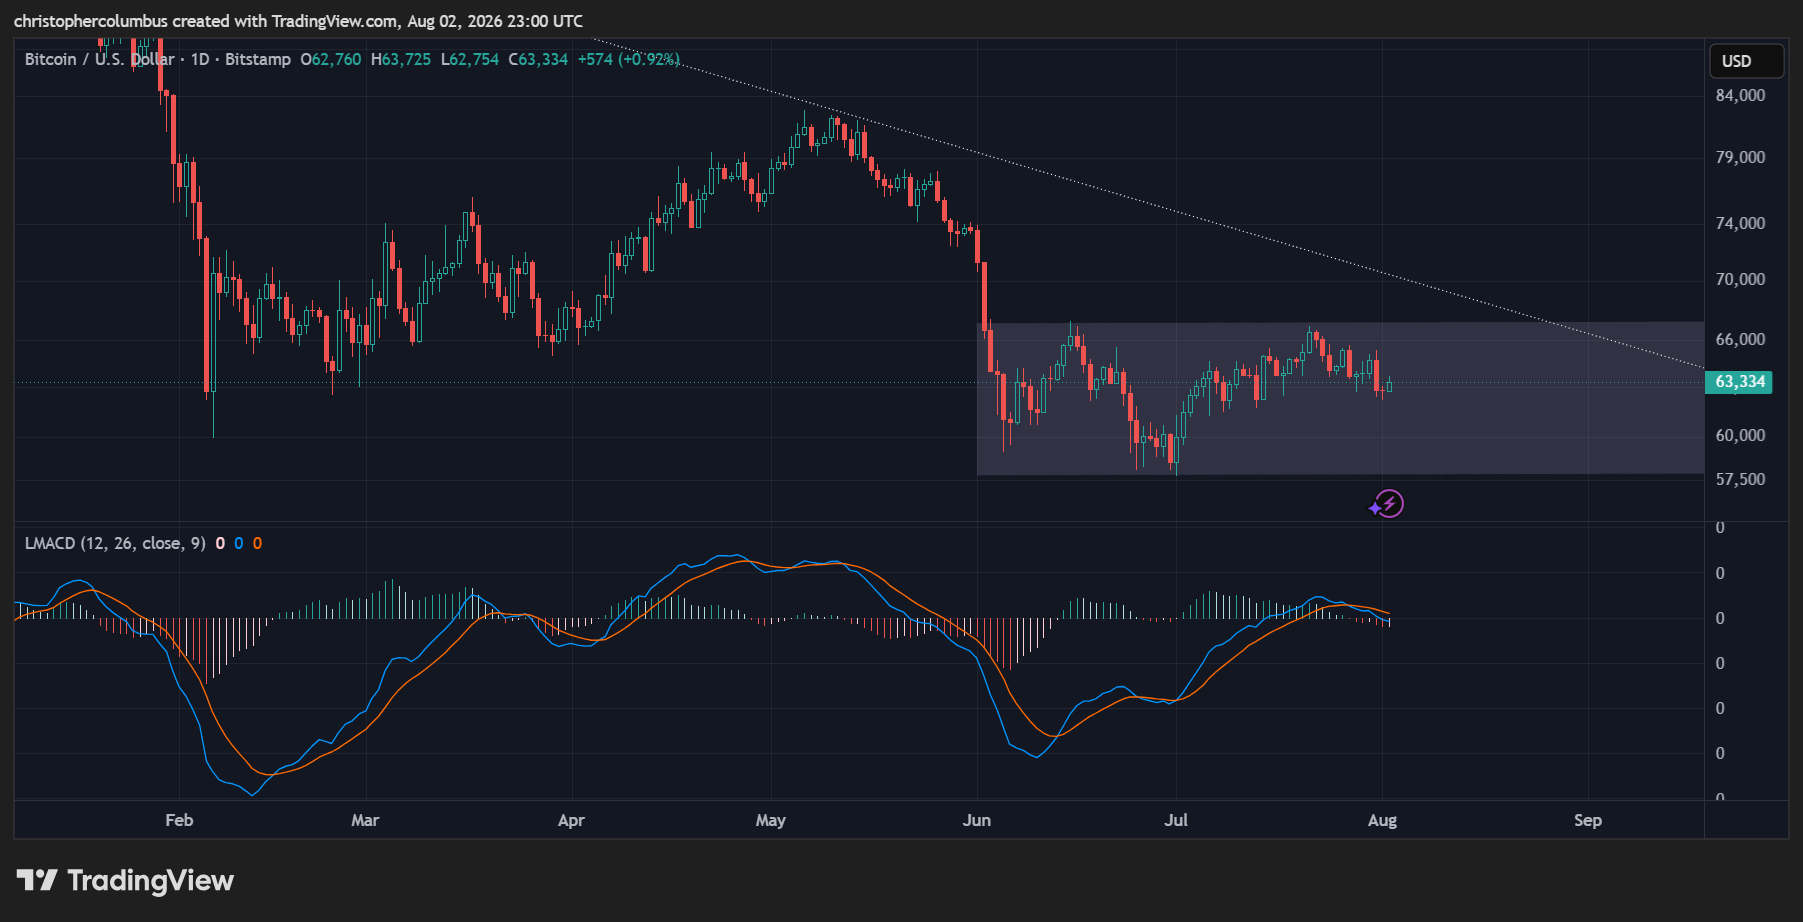
In terms of volatility [daily MACD], price is neither extended to the upside nor the downside, but resting on the baseline. It looks well-positioned for a possible renewed push to the upside even as it comes up against longer-term downward resistance [downward diagonal due for possible break on longer-term charts].
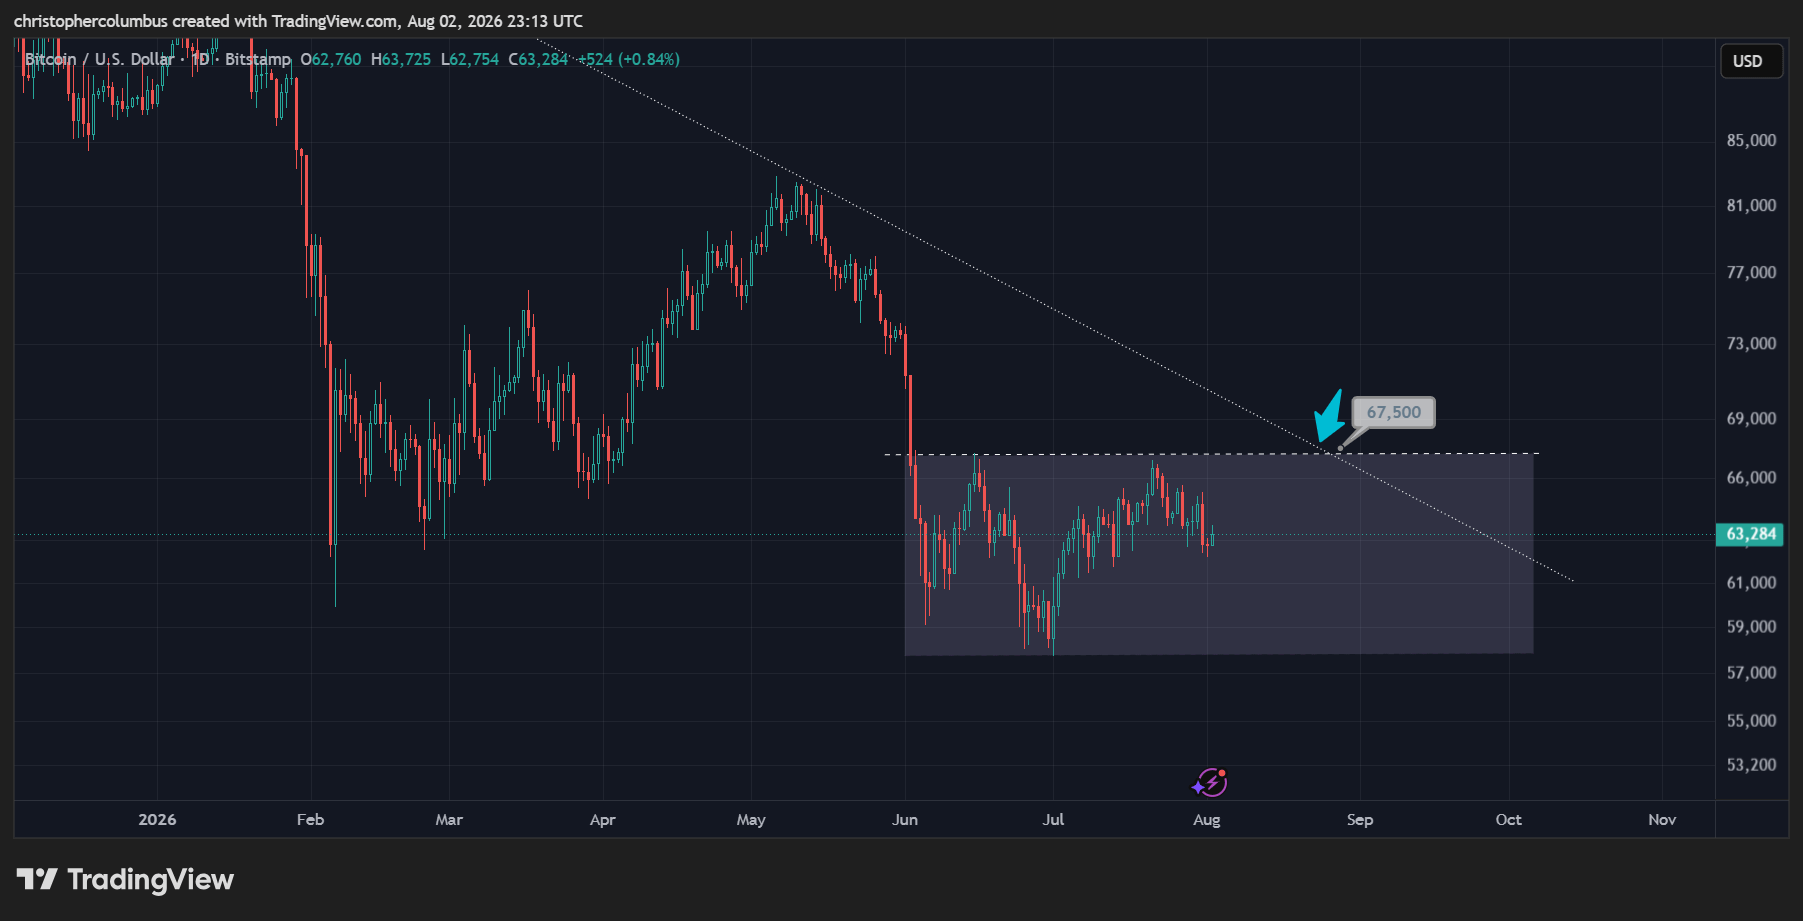
Given the shorter-term set up, a break of the range to the upside would technically be a reasonable entry point for the trader or for those looking to re-establish positions.
Longer-Term
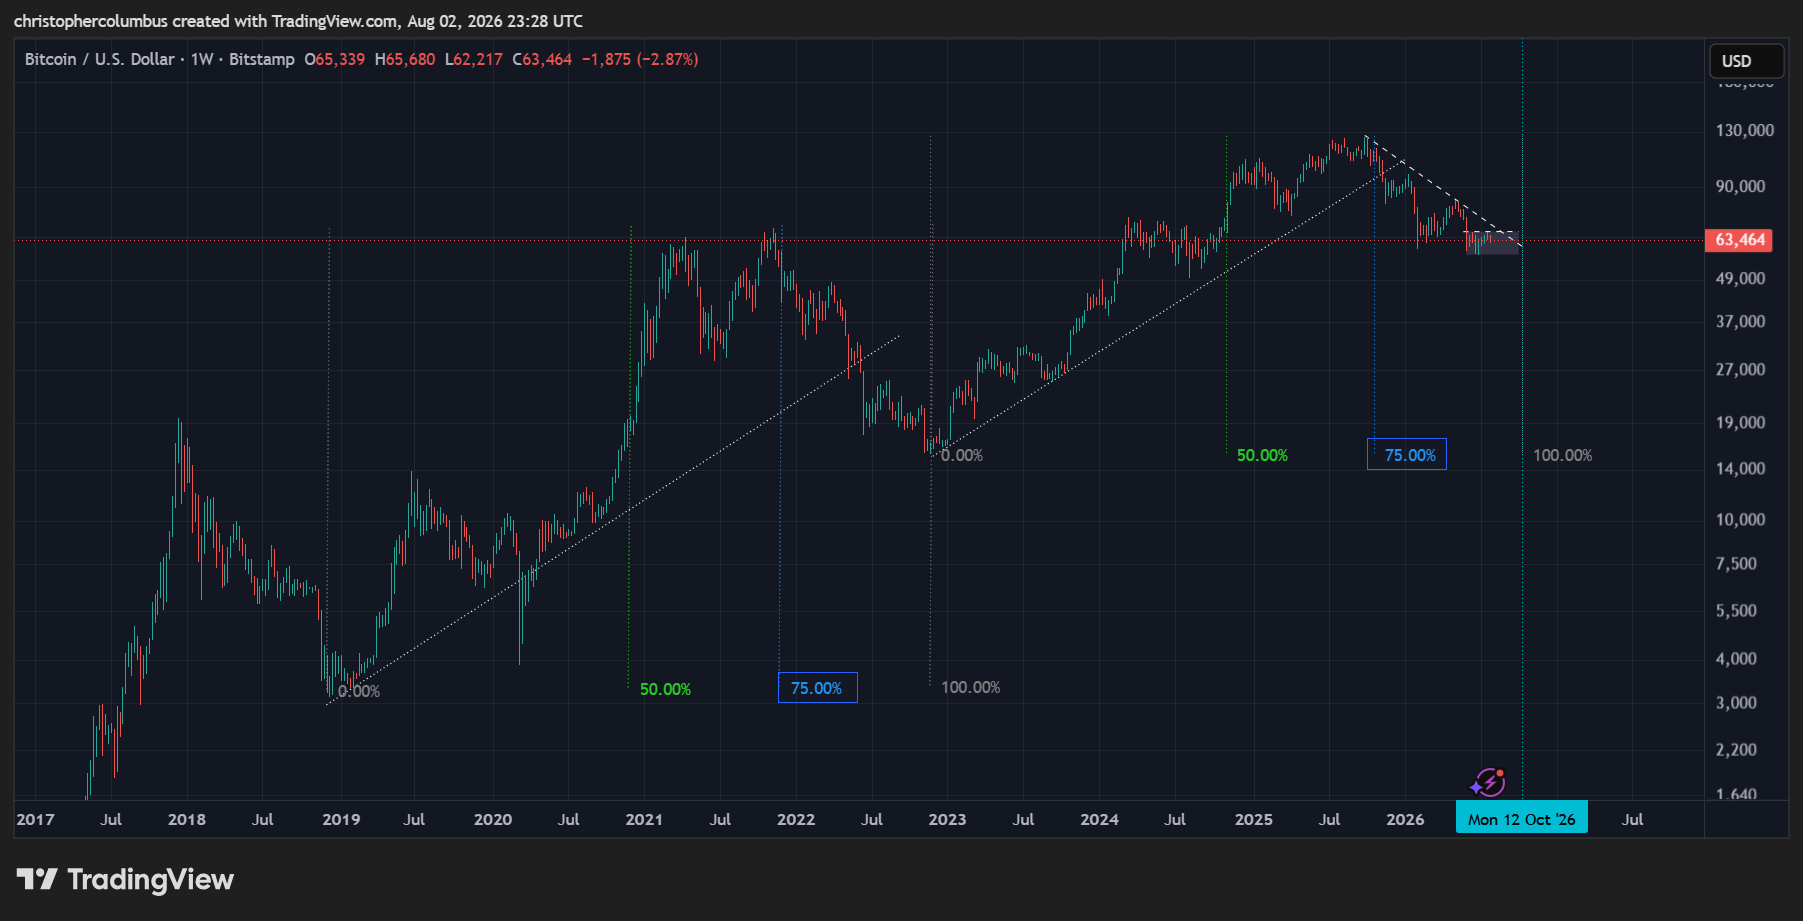
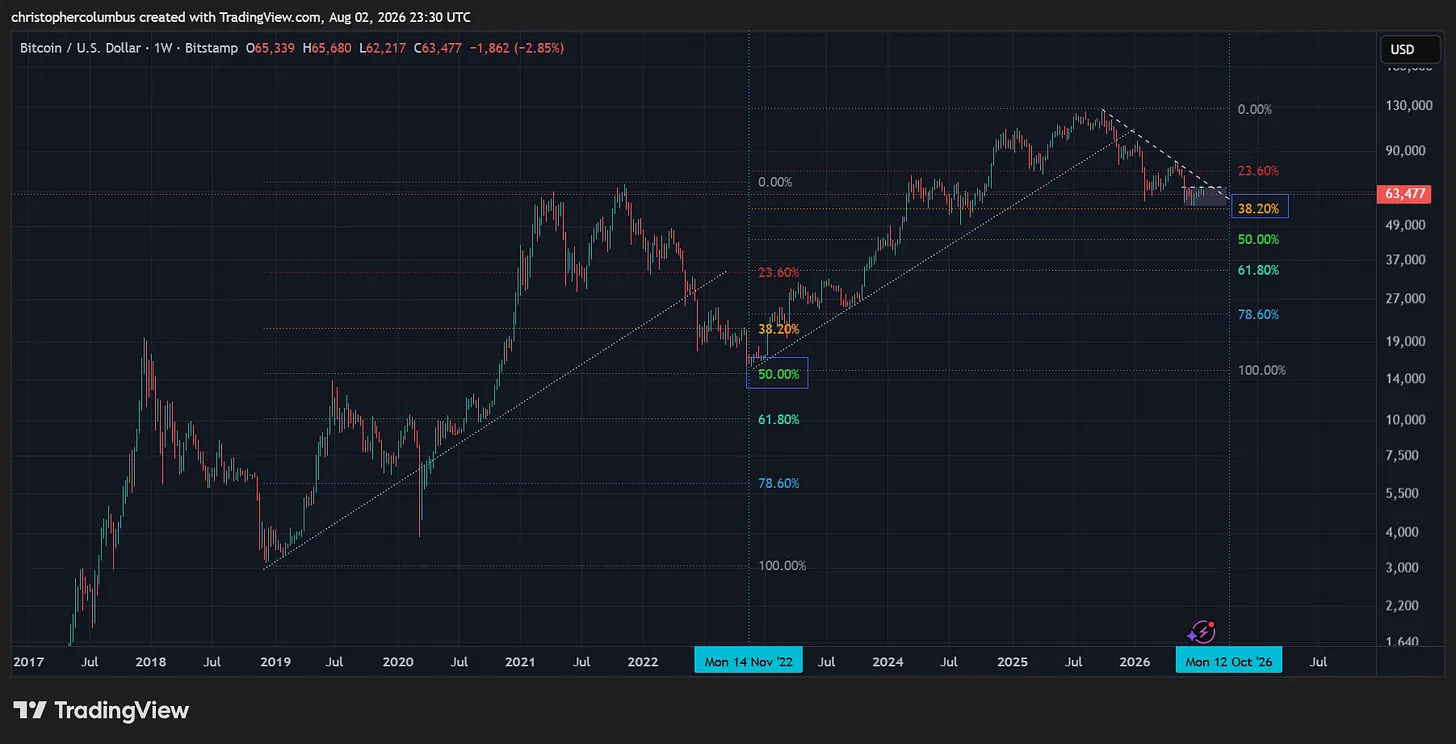
A comparison of the corrections, as measured from bottom to peak and extrapolated, suggests a near completion of this correction.
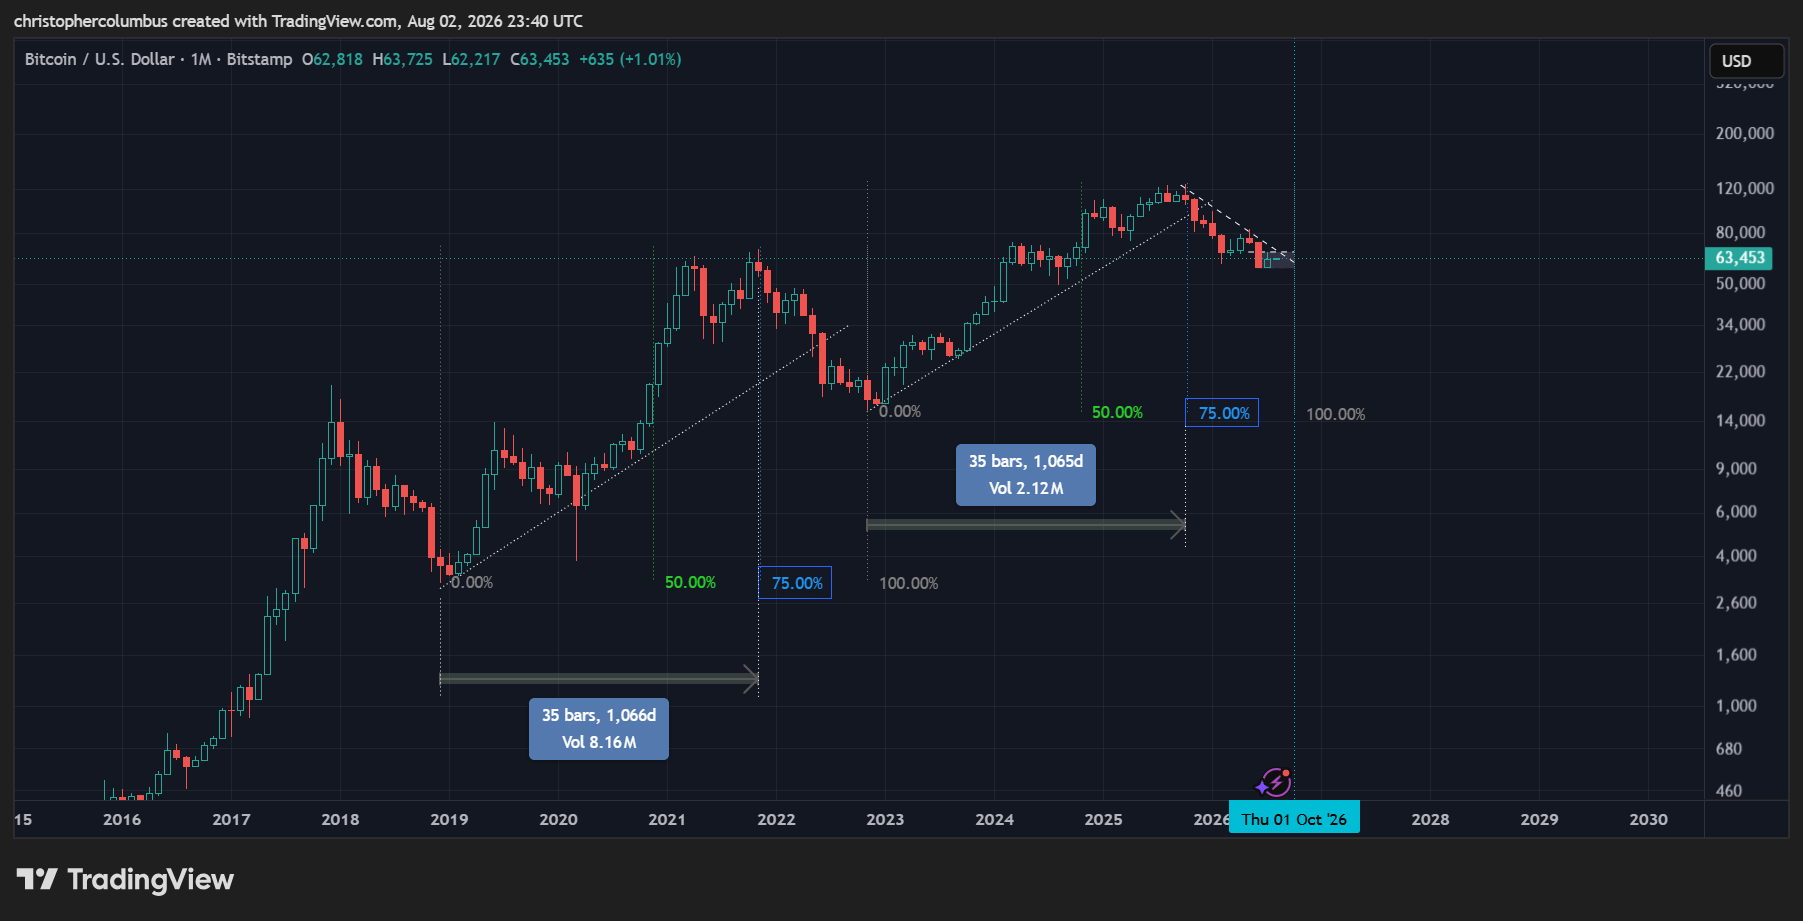
This view is further reinforced in that the time period from the bottom to the peak in both cases was the same [35 months].
This scenario sets up for a possible renewal of the bull market in the 4th quarter of this year [October].
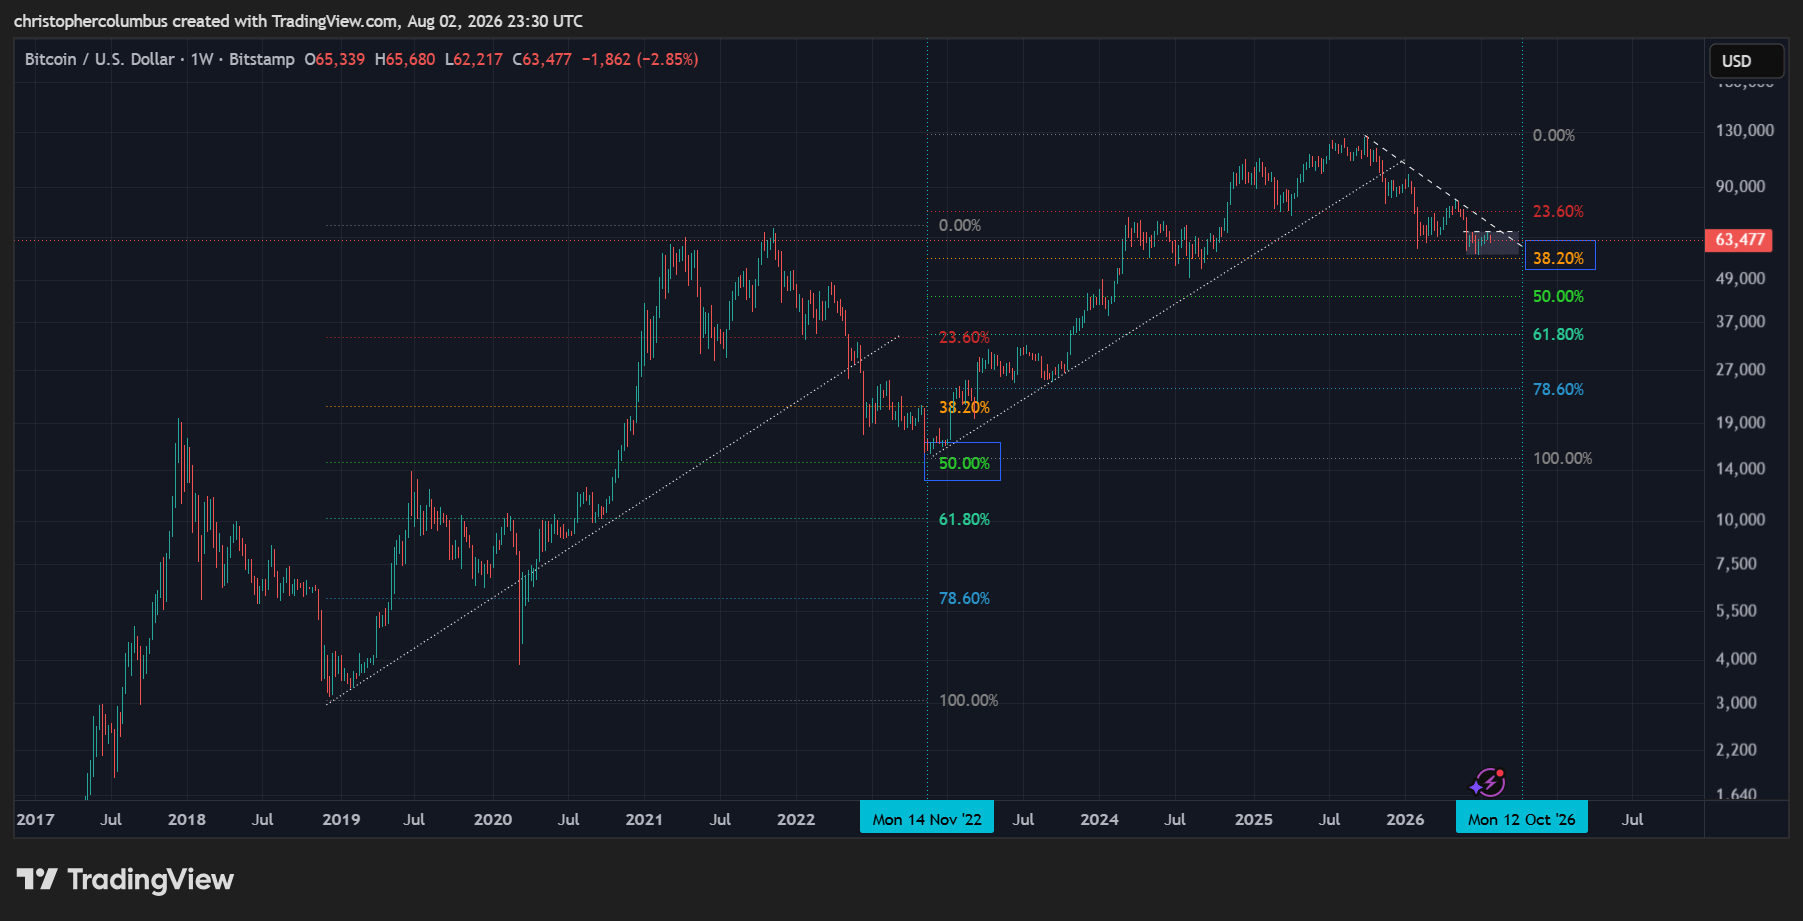
In the above chart, we find a disparity between the two cycles. Where the previous cycle retraced a full 50% [3 fib levels], this current cycle has so far retraced only 38% [2 fib levels]. The difference in the quantity [or quality] of the correction is perhaps explicable on the basis of a maturing market, where the market shifts from a parabolic to a more technical one [keep in mind there was no parabolic spike this time round].
In an increasingly technically moving market, as would be expected for a maturing asset [or alternative currency], the prediction was always one of price discovery, of a plateau forming as the currency was increasingly capitalized.
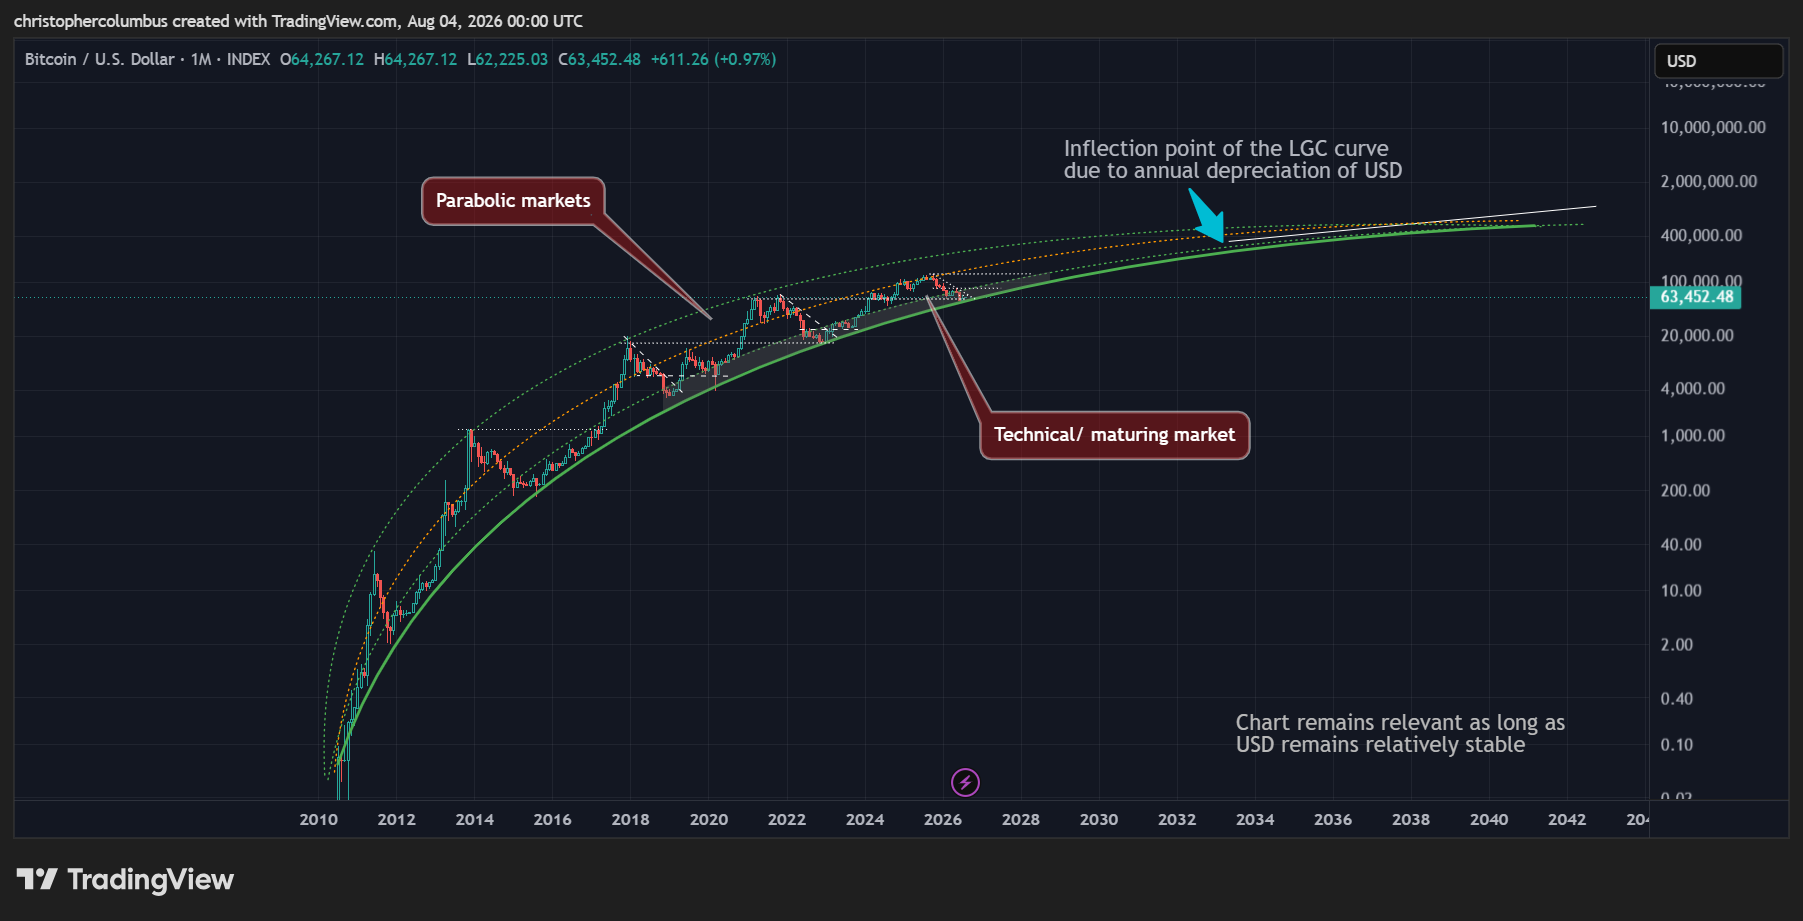
The plateauing of price is playing out as predicted, with price developing along the lines of a logarithmic growth curve.
The upper channel is now considering redundant… as belonging to previous parabolic markets. It is the lower channel and base line that are now of relevance in a maturing market.
The wild card of course remains the pricing mechanism, that of USD, which is why an ‘inflection point’ is factored in to account for the inflationary nature of the currency [and annual depreciation]. And this within the assumption that the currency remains relatively stable as it has done so far for Bitcoin’s history.
The timeline for this, where simply annual depreciation of USD would see divergence from the plateau, is the following decade of the 2030s, which is only a fear years out.
Until next time,
Stay [relatively] safe out there,
Dave the Wave.