
BTC Shorter-Term and Longer-Term Readings:
Dear Readers,
Shorter-Term Outlook on the Monthly MACD
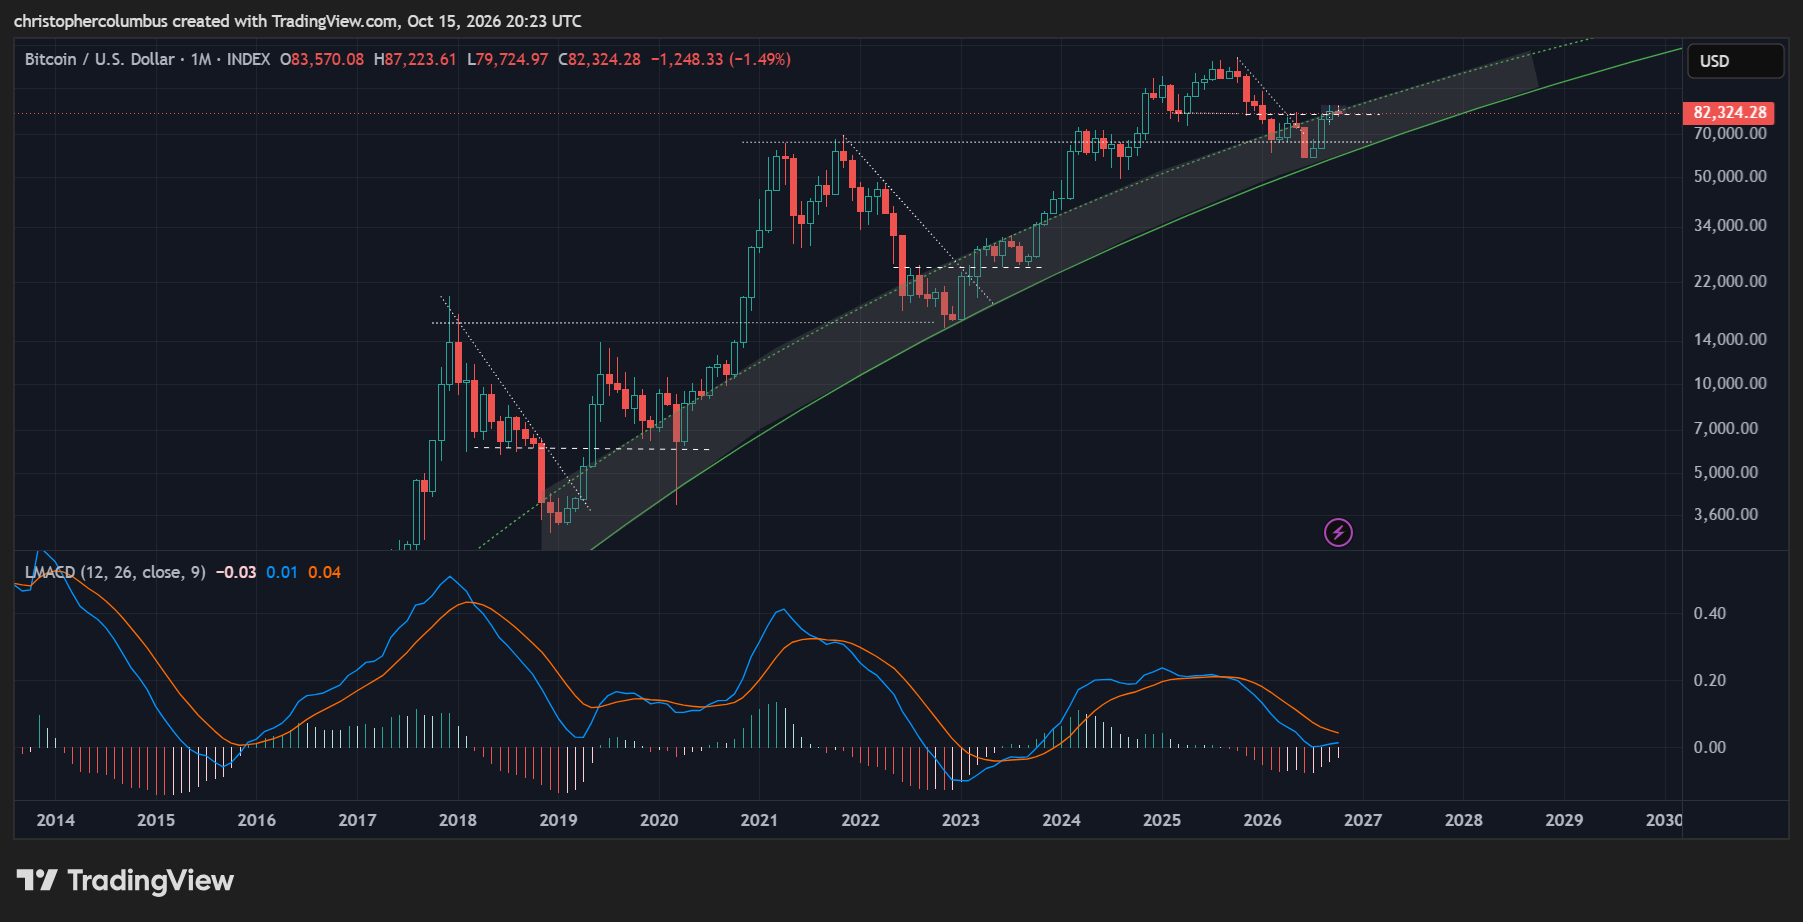
The two primary observations in the above chart has to be that while price will remain relatively volatile, the bottom appears to be well and truly in based on the monthly MACD trend.
- Volatility of the Basing Ranges
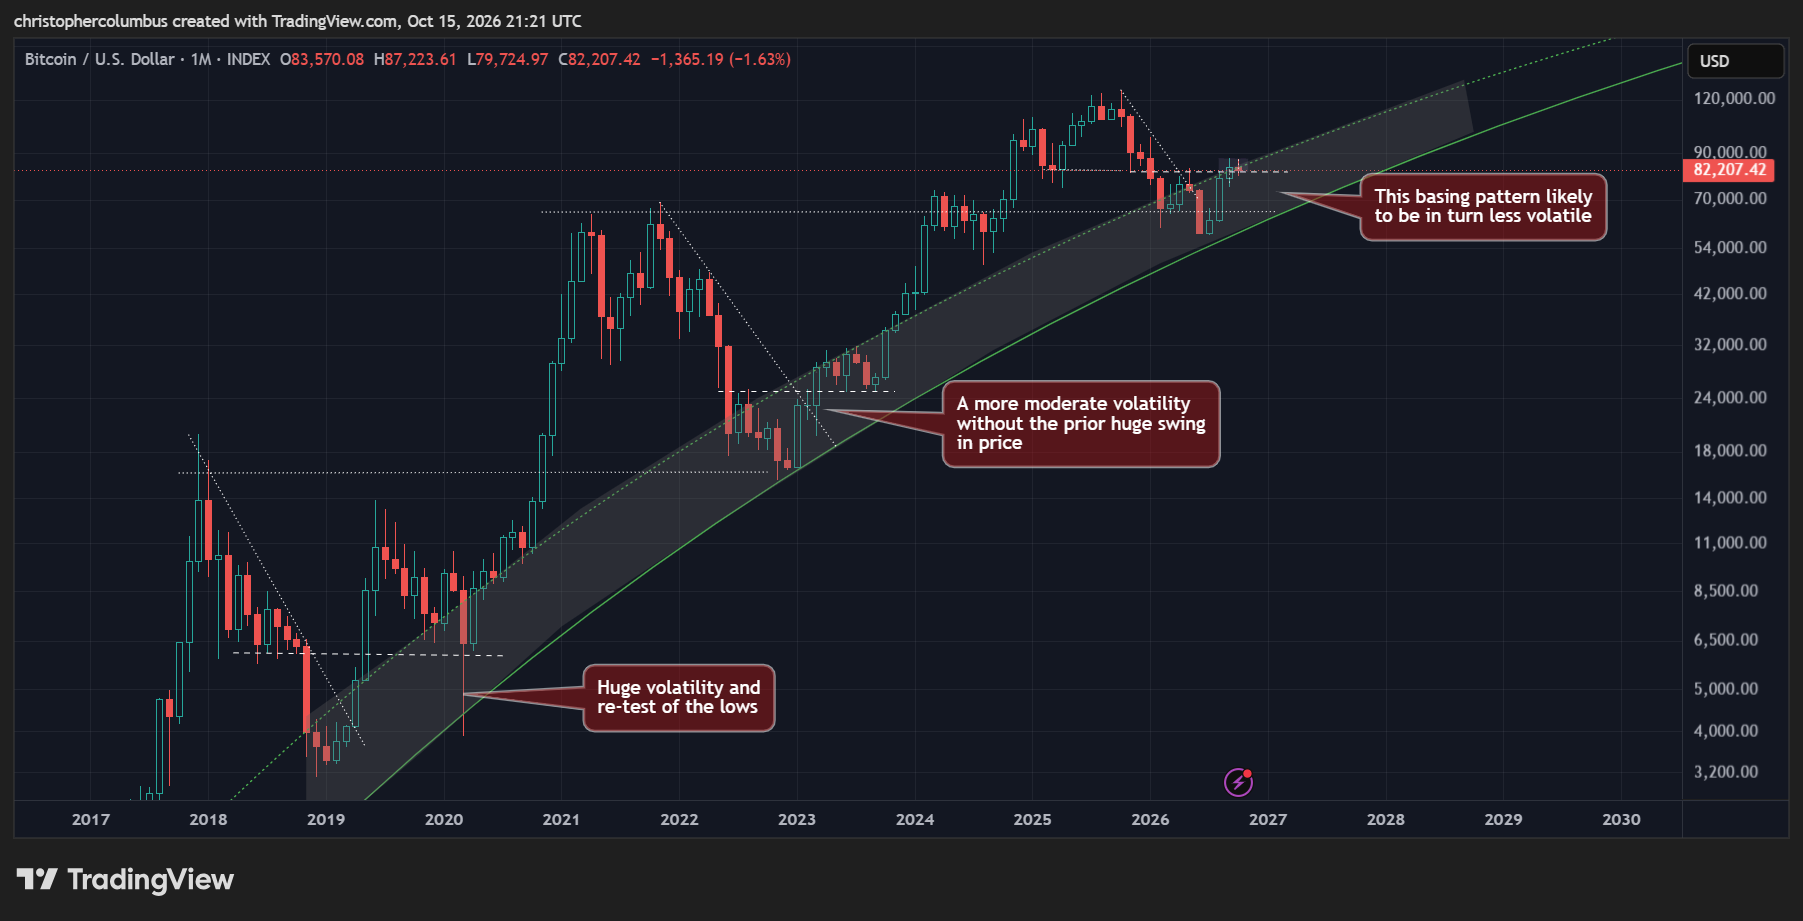
It has been a large part of my thesis for quite some time that as the BTC market matures, the macro volatility reduces… and sure enough we see this pattern of reducing price volatility above in the chart. The first basing pattern could almost be seen as coming in the wake of a ‘mini bubble’ [price action of early 2019].
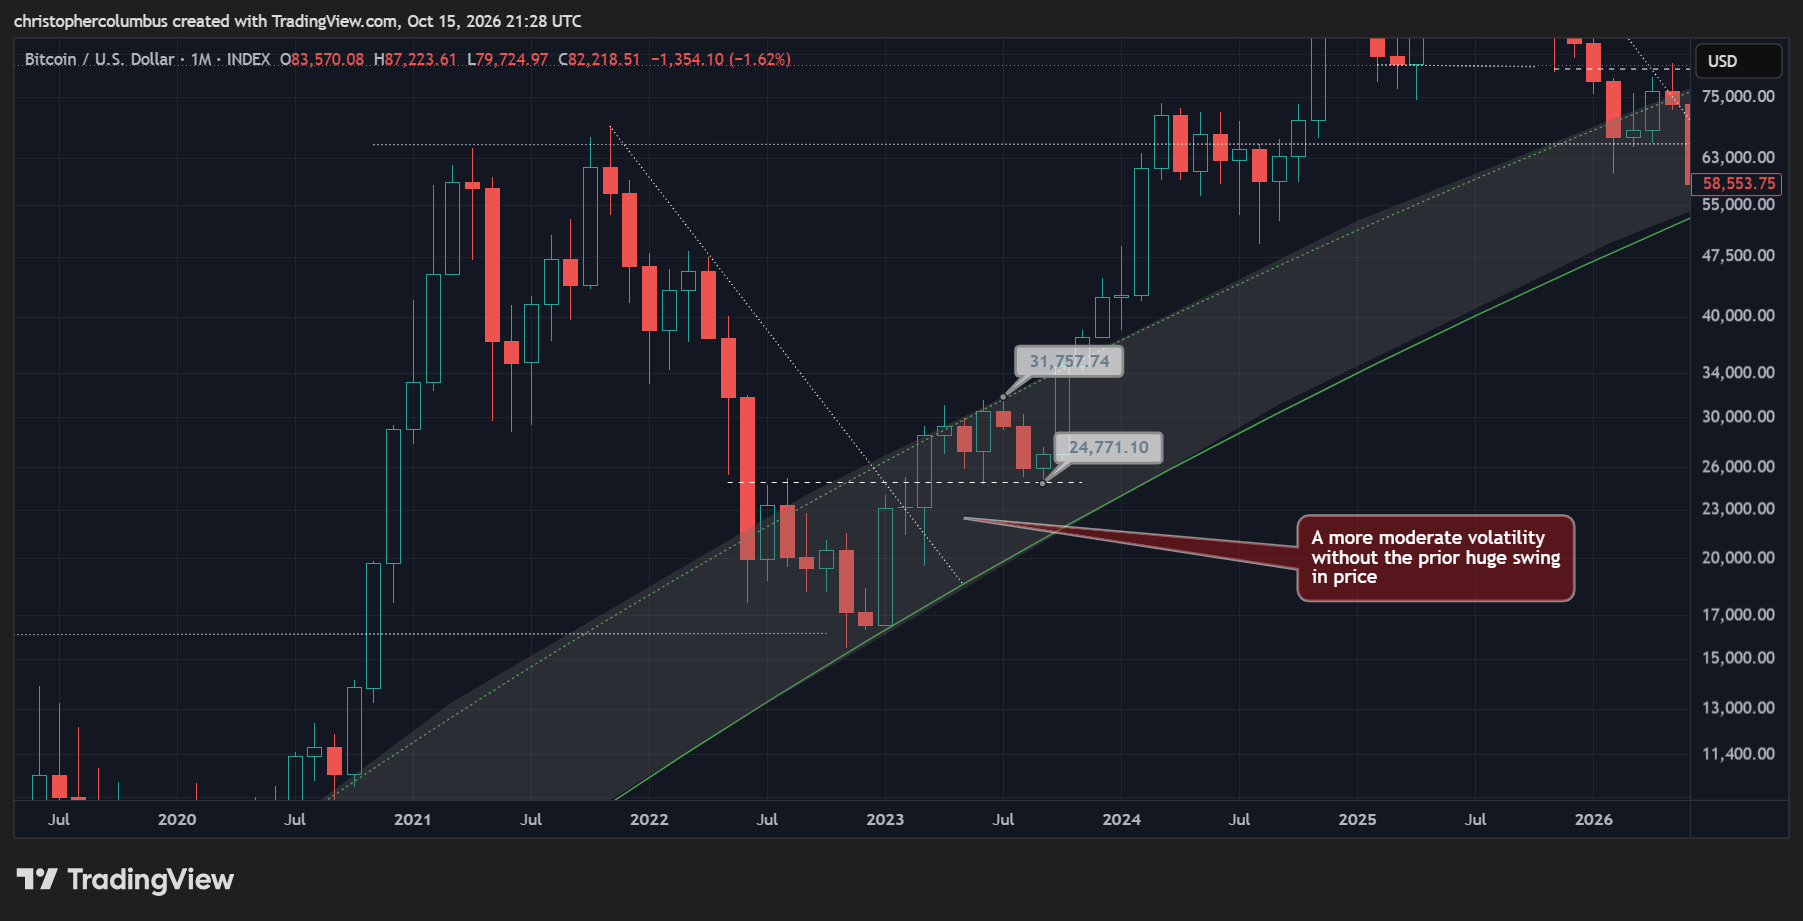
The second basing pattern, as focused on below, shows a less volatile price action, due no doubt to the absence of a preceding price spike as was seen in 2019. Even so, the decline from 31K to 24k would’ve been difficult to experience for many [confidence in the LGC model would’ve helped here].
Previous Base Building Volatility
Given the principles of both a maturing market and the previous reduced price volatility, we’ve every reason to think that this third basing pattern would likewise not be too volatile. While we can have some confidence that the bottom is in, it’s also reasonable to think that price will remain relatively volatile in the more immediate term. In other words, the longer-term bullish outlook has plenty of ‘wiggle-room’ to the downside.
A ‘stress-test’ for a comparative volatility would allow a retracement to 75K without any cause for alarm
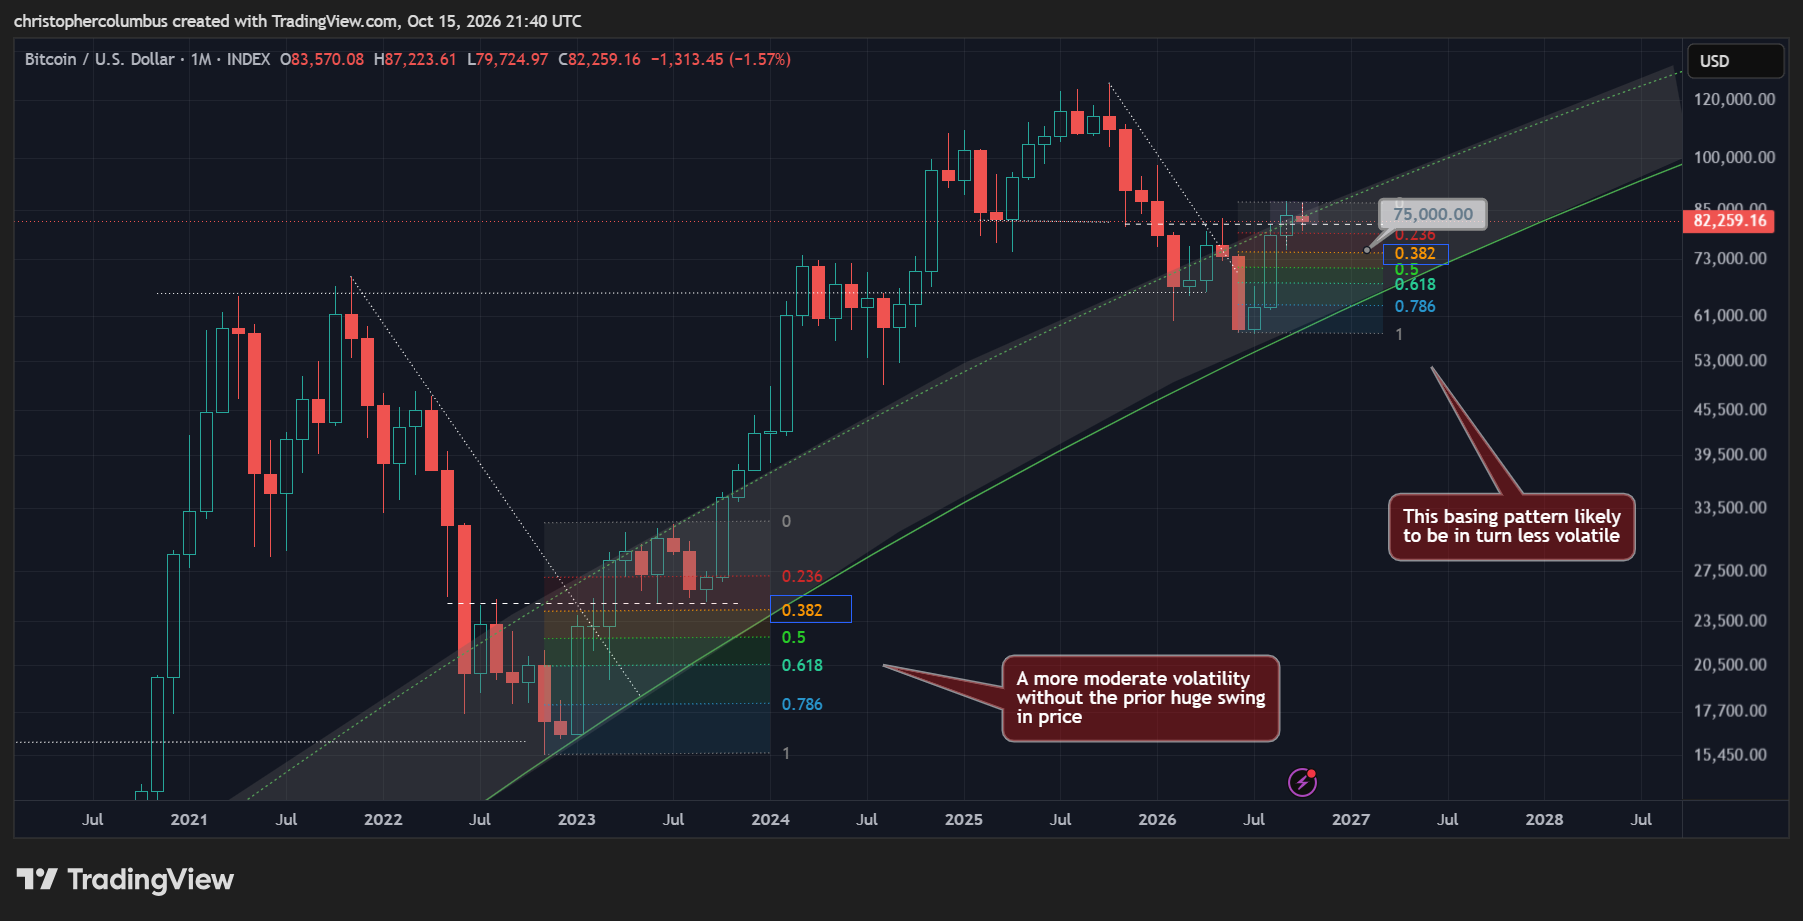
Comparative ‘Stress-Test’
2. Monthly MACD Trend
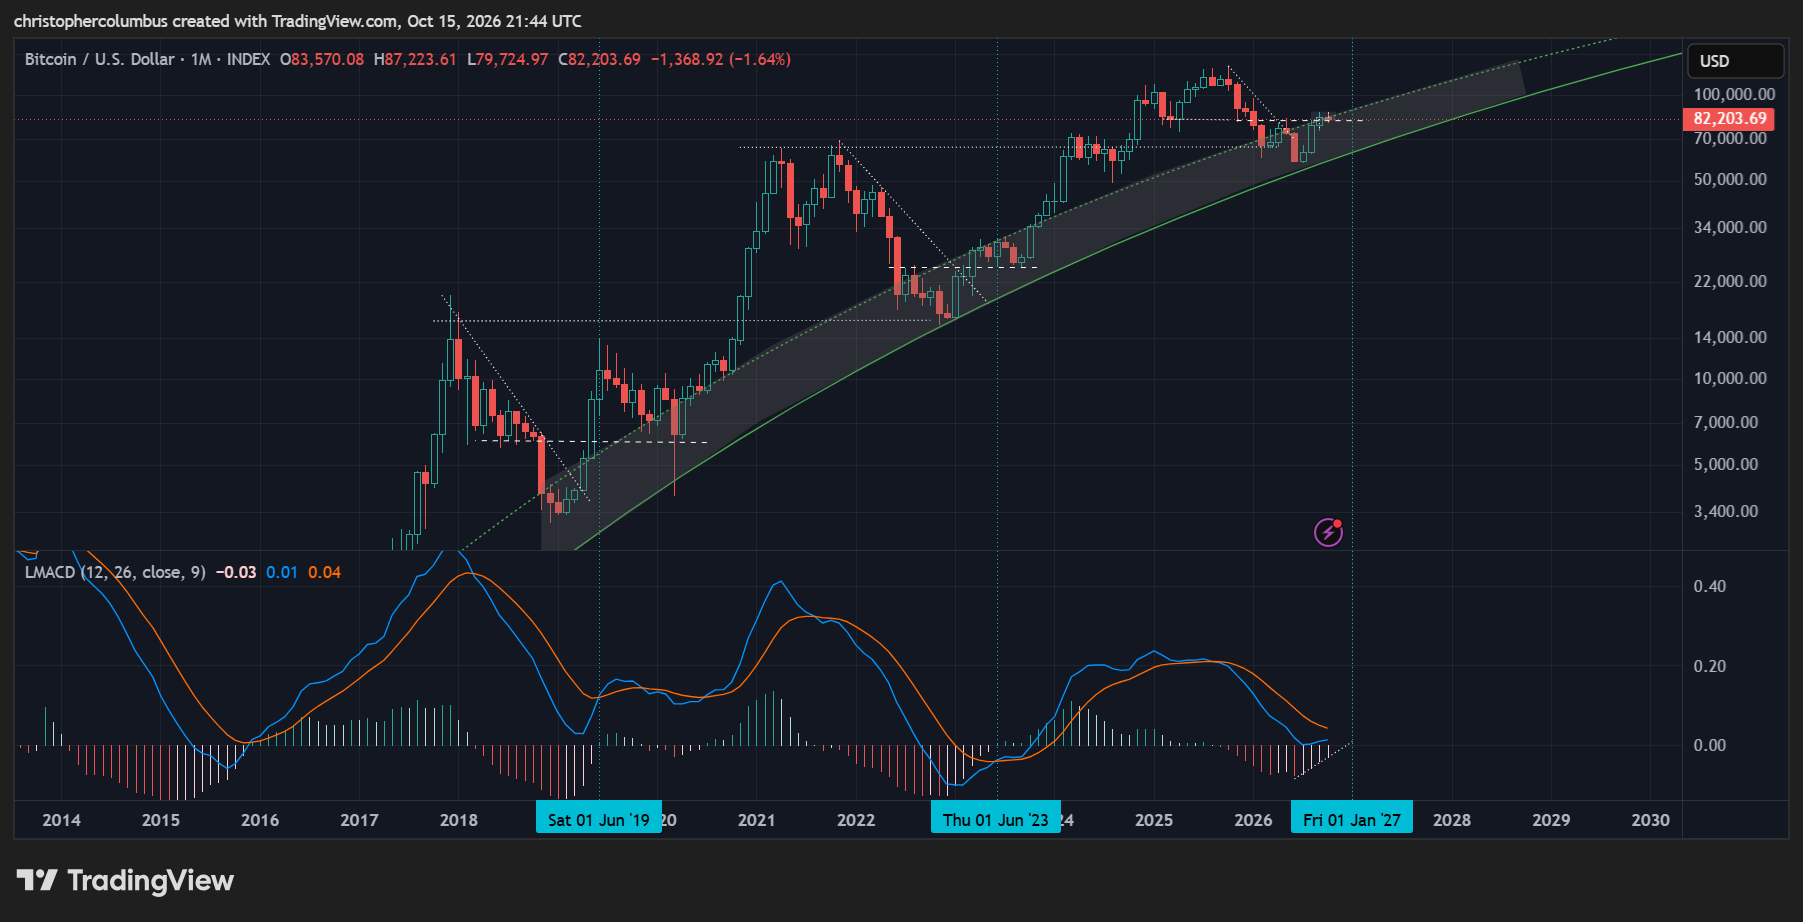
And of course the monthly MACD helps here in showing the larger momentum of the trend, smoothing out the volatility.
The MACD cross, signalling an officially renewed bullish market, is due for the new year. Even then, if the past cycles are factored in, some ranging in price should come as no surprise [looking at June 2023].
Longer-Term Cyclical Peak to Base Pattern
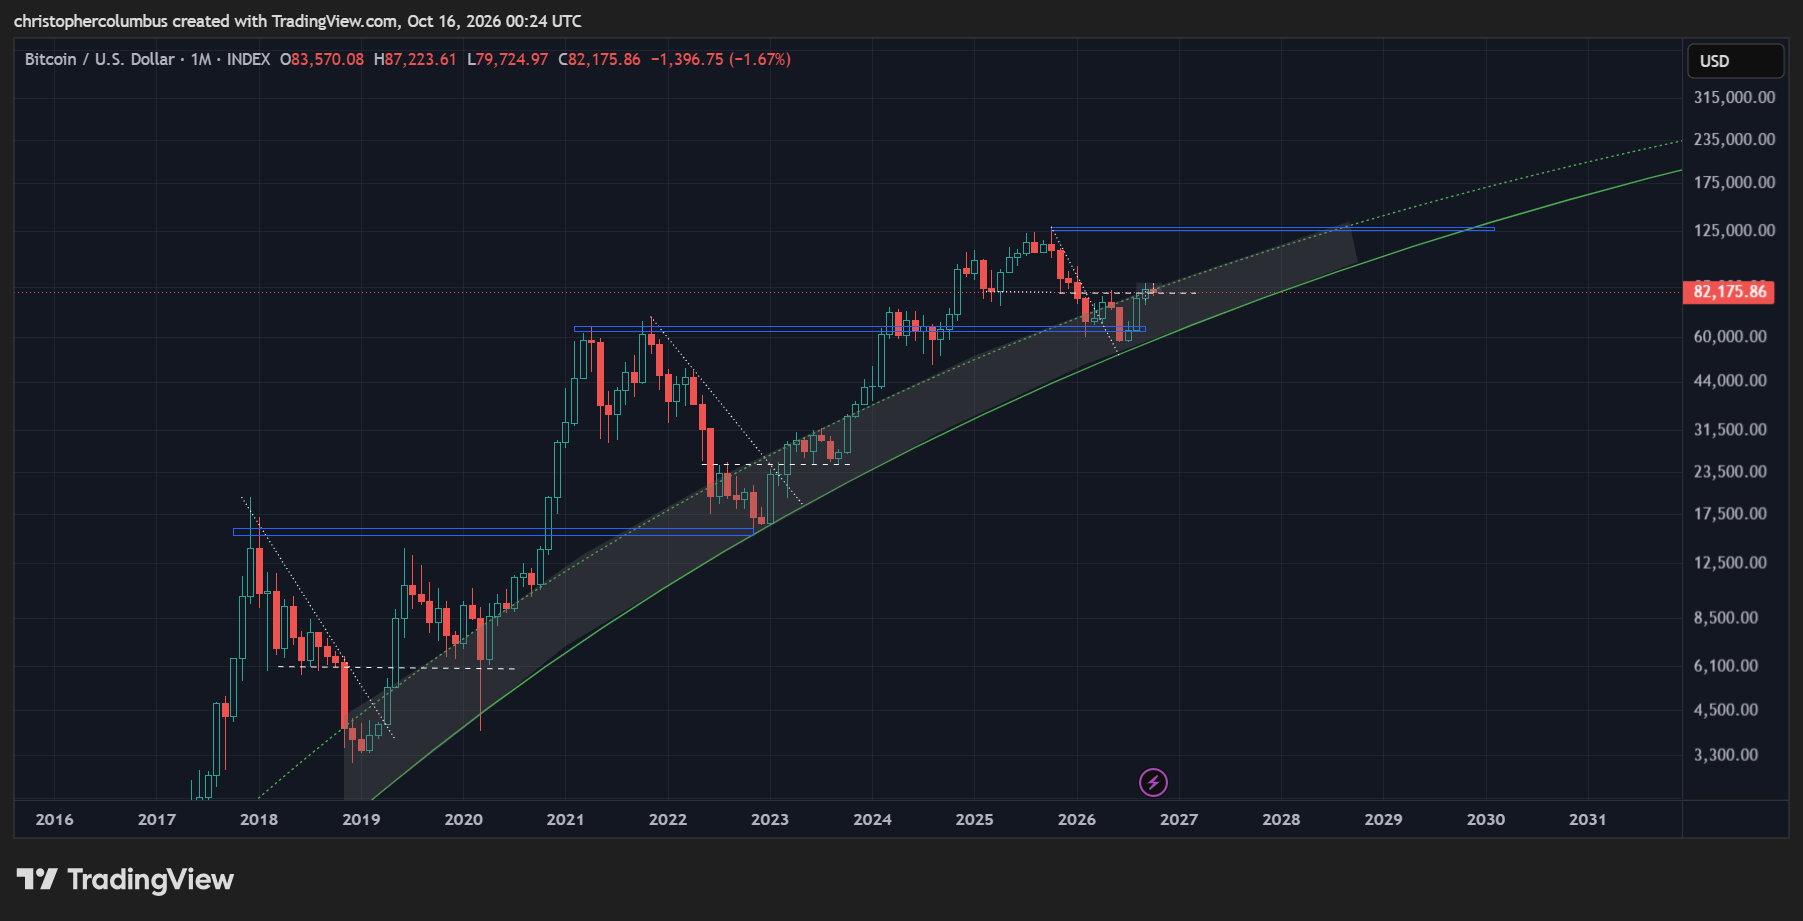
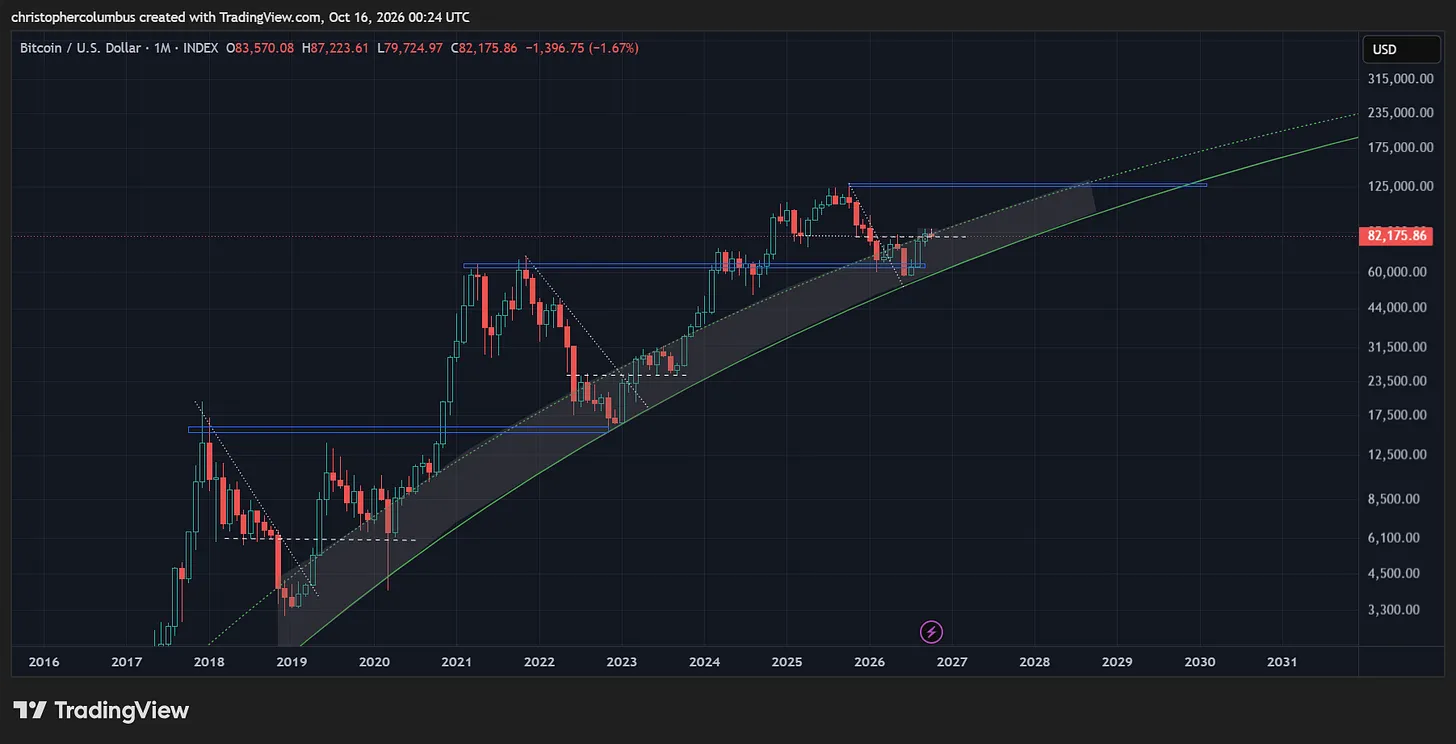
What is striking on first sight of the long-term chart, the one where longer-term predictions of price are made, is the connection between previous peaks and subsequent bases [blue lines]…. not to mention price following the log growth curve.
Given the pattern, it’s reasonable to expect something similar to eventuate going forward.
Overlaying the time measurements, we can provisionally locate the next basing level years out - 47 months on the uptrend and a reducing period on the correction [5 to 8 is the same proportion as 8 to 12].
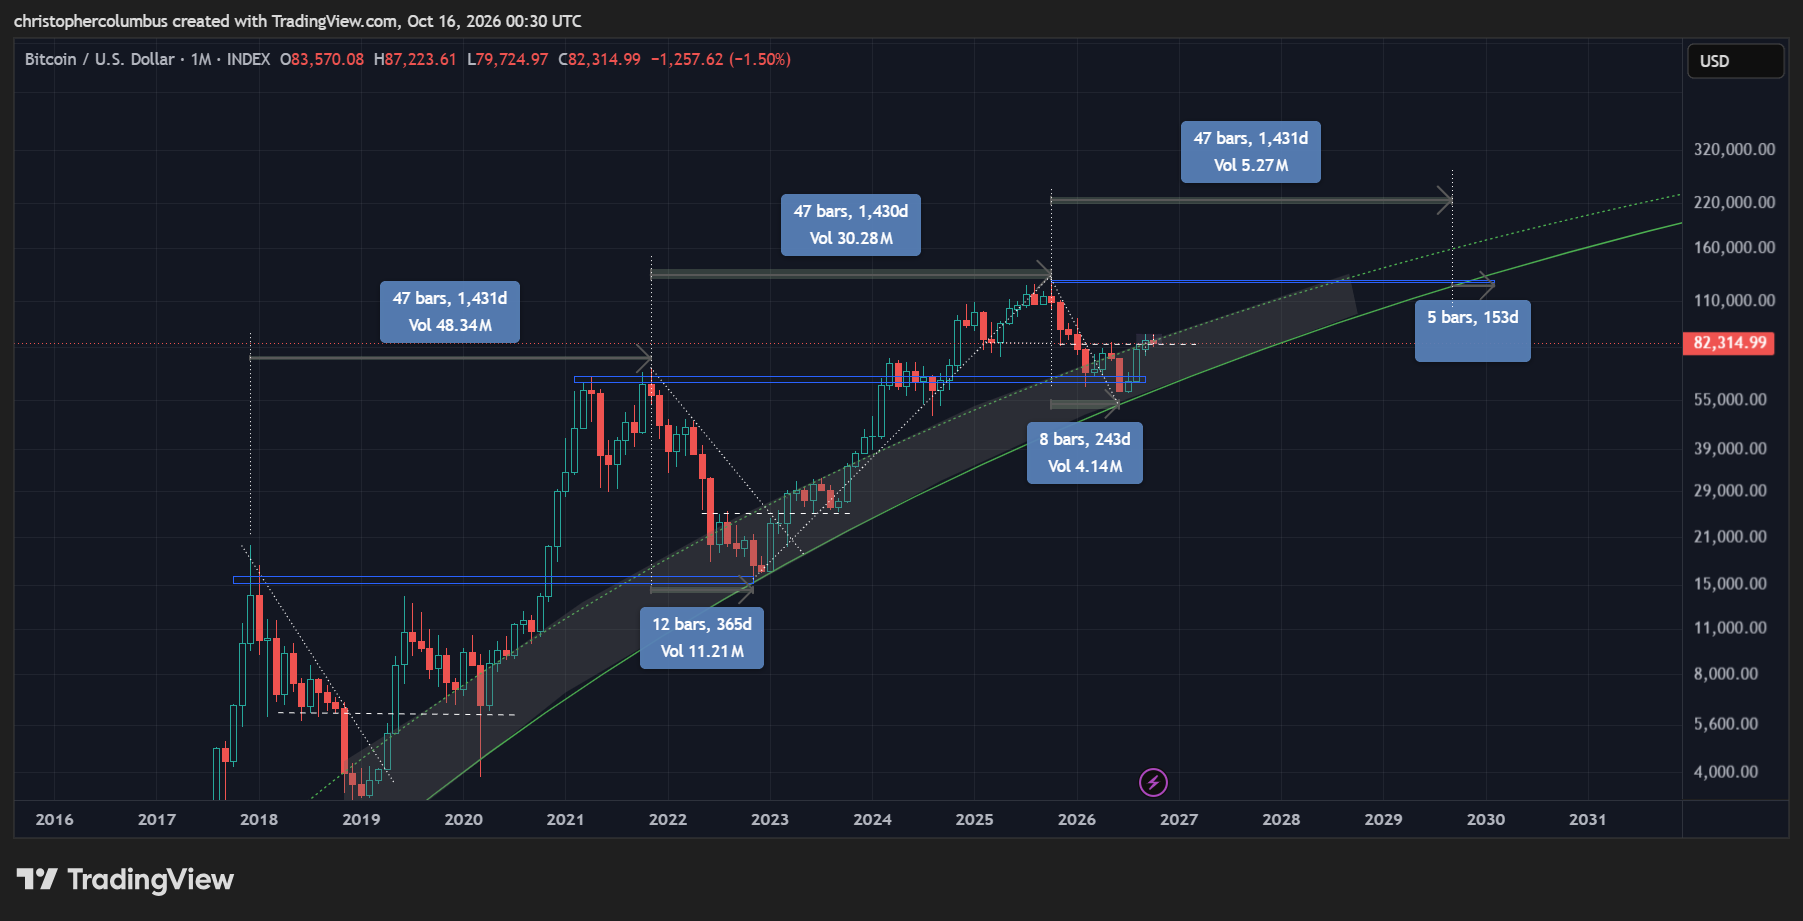
With a base level sketched in, we can also begin to consider a possible top for this coming cycle. Given the increasingly technical nature of the market, there is some sense in connected the peaks and extrapolating the line to provide a cap to price.
Interestingly, this line becomes near parallel to the curve as all lines [and prices] increasingly converge towards eventual price discovery [capitalization]. The provisional target, along these lines, would be around 220K.
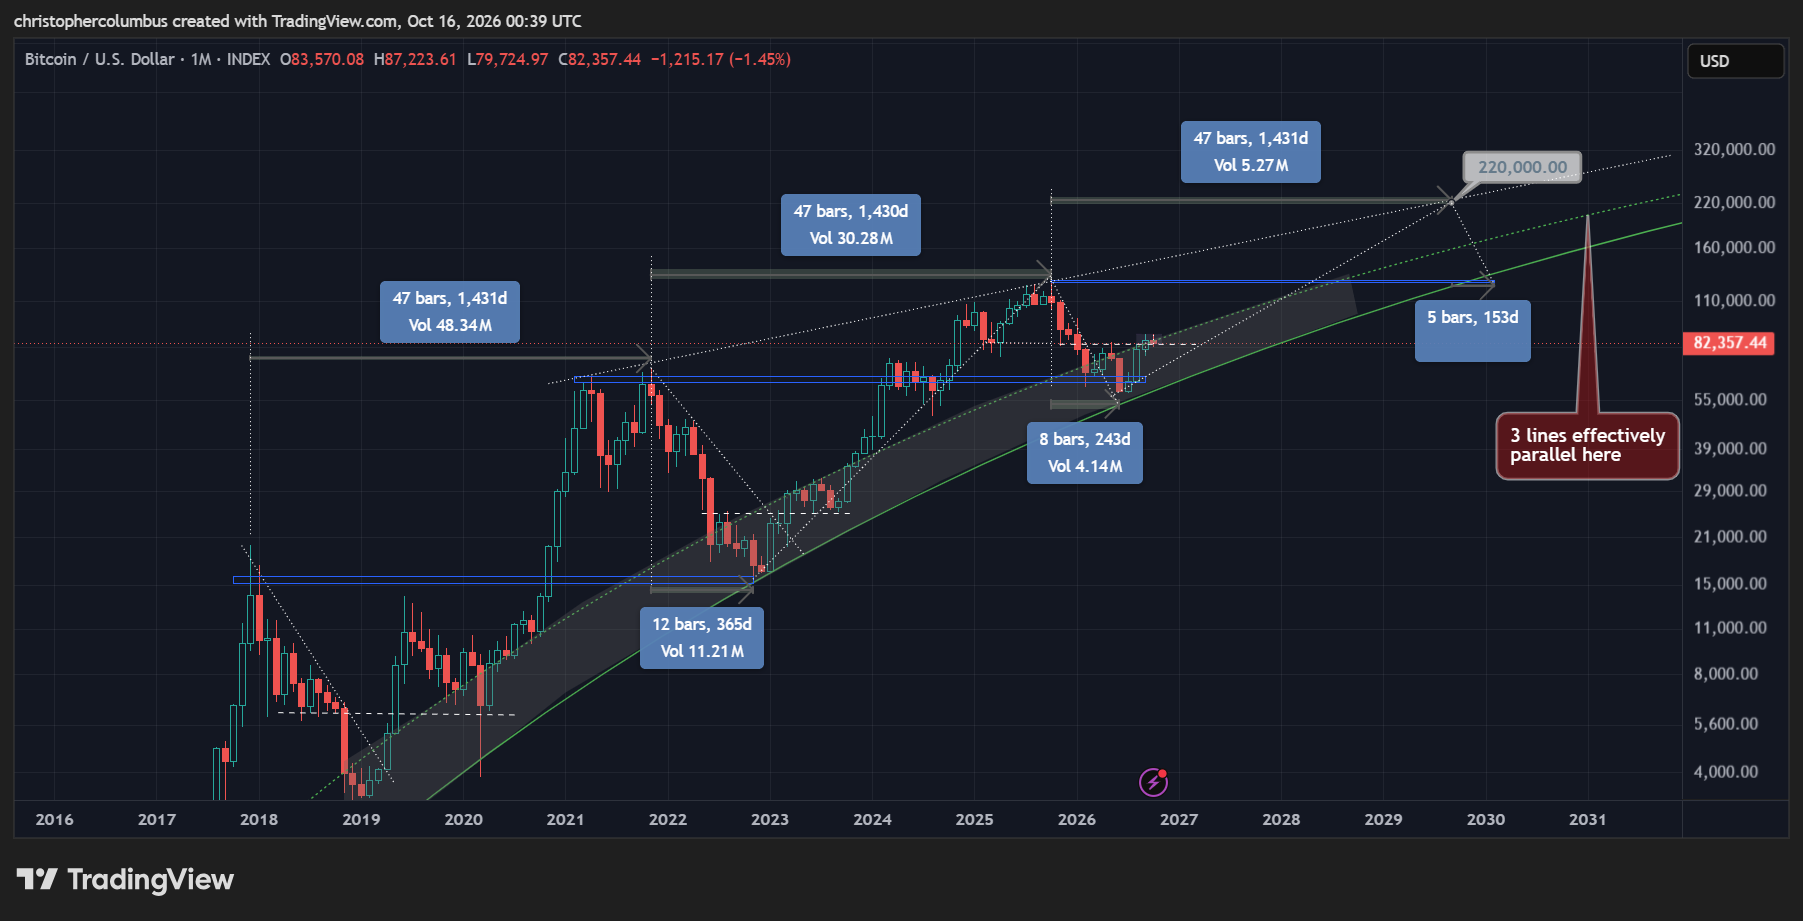
Keep in mind here of course that this is a technical projection, and should be ‘weighted’ as such. It is obviously not a vision of a clairvoyant into the future on the one hand, or a complete random guess on the other. It is a hypothesis, which would state that something like this is likely to be the case on the basis of previous price action/ experience.
Until next time,
Stay [relatively] safe out there,
Dave the Wave.