
BTC: Still in the Accumulation Zone?
Dear Readers,
With price holding up in an extended horizontal channel after an extended correction, with it coming back to the lower band of its logarithmic growth curve channel [LGC], and with continued instability in the financial world, trader/ investors must be wondering if this is the level at which to accumulate. Personally, I think it is, and for those exact conditions listed. The chart suggests the buy as well as the wider economic landscape. This article will look to further describe why Bitcoin is a reasonable buy here, even as the price might seem to be high.
1] Establishing a Core BTC Position
As long-term followers of mine are no doubt aware, I’ve always advocated to trader/ investors the building of a longer-term core position in Bitcoin. The primary reason to own Bitcoin is the same as why you’d own some gold - to insure the preservation of monetary value in an increasingly unstable financial world. From this perspective, BTC is more than an asset but doubles up also as digital gold due to its limited supply and scarcity. It should here be considered primarily as an alternative currency, one in the process of capitalization via speculation in a free market. Of course, this leads on to the question of current price - how can we be confident that the current price is a reasonable entry level at which to put some liquid capital to work?
2] The Discriminate Buying of BTC in a Speculative Market
As mentioned, how do we know that the current level is the price at which to accumulate? Of course we can not know [as only clairvoyants have any claim to know the future], but we can have some confidence based on past price action of the longer-term chart. Taking something like the LGC model, which maps out the dynamic of price against time, you have a basis on which to identify relatively high and low prices, and accordingly a more discriminate entry into a highly speculative and volatile market.
Points of confidence:
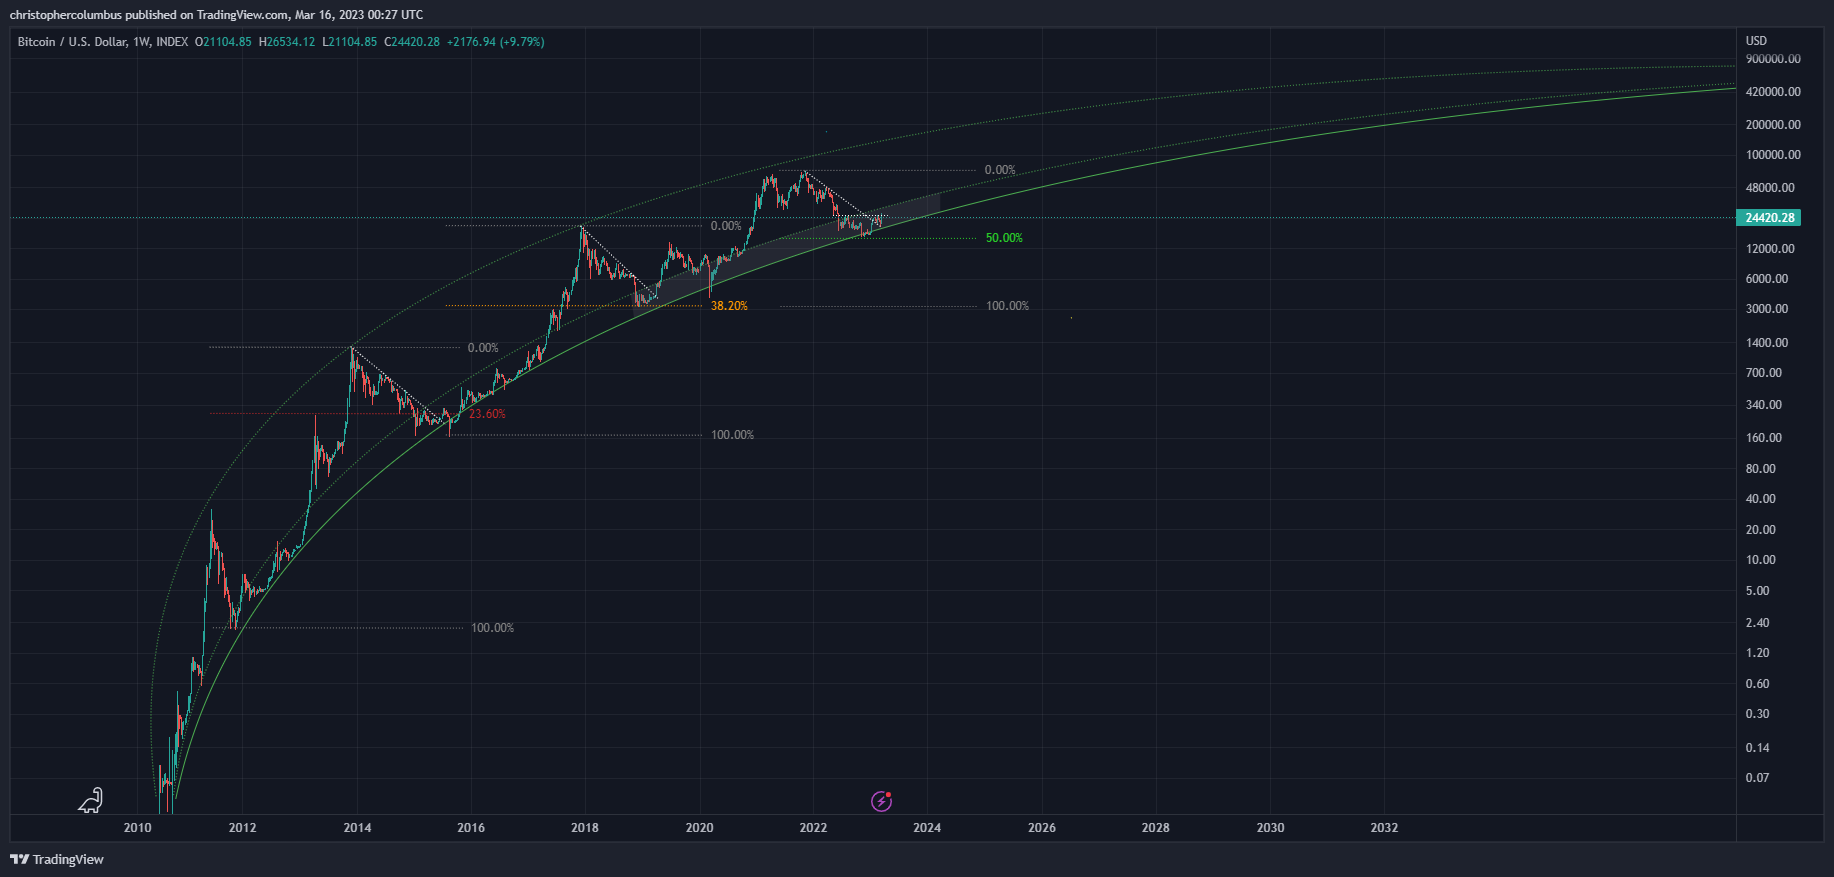
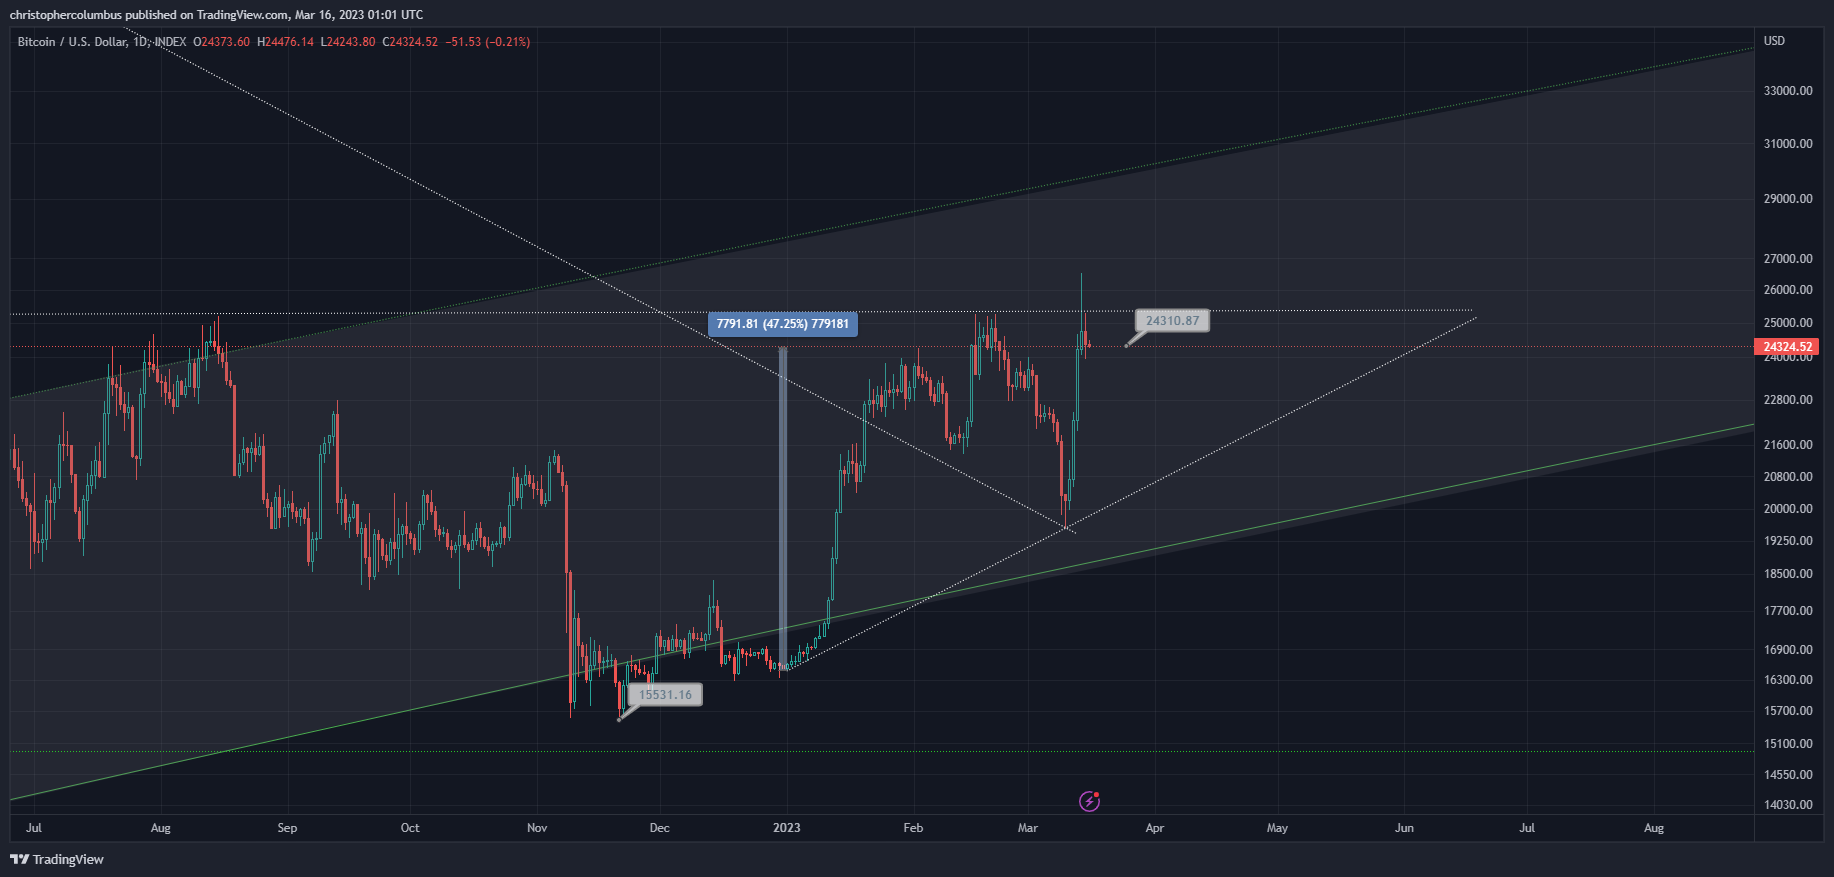
- The first chart identifies the lower band of the LGC [protraying the process by which BTC is capitalized]. Price has reamined in this zone for 40 weeks now.
- Price has effectively ranged horizontally for that time period.
- Price has broken its longer-term downward diagonal of resistance.
- Price is threatening to break its shorter-term horizontal of resistance.
- Price has retraced a full 50% in real terms of the previous bull market.
Buying in a few tranches over a reasonable period of time may just well put the investor in a solid position going forward… just as it has in buying the buy zone previously [since first outlined in 2018].
3] Price Seems High due to Nominal Values
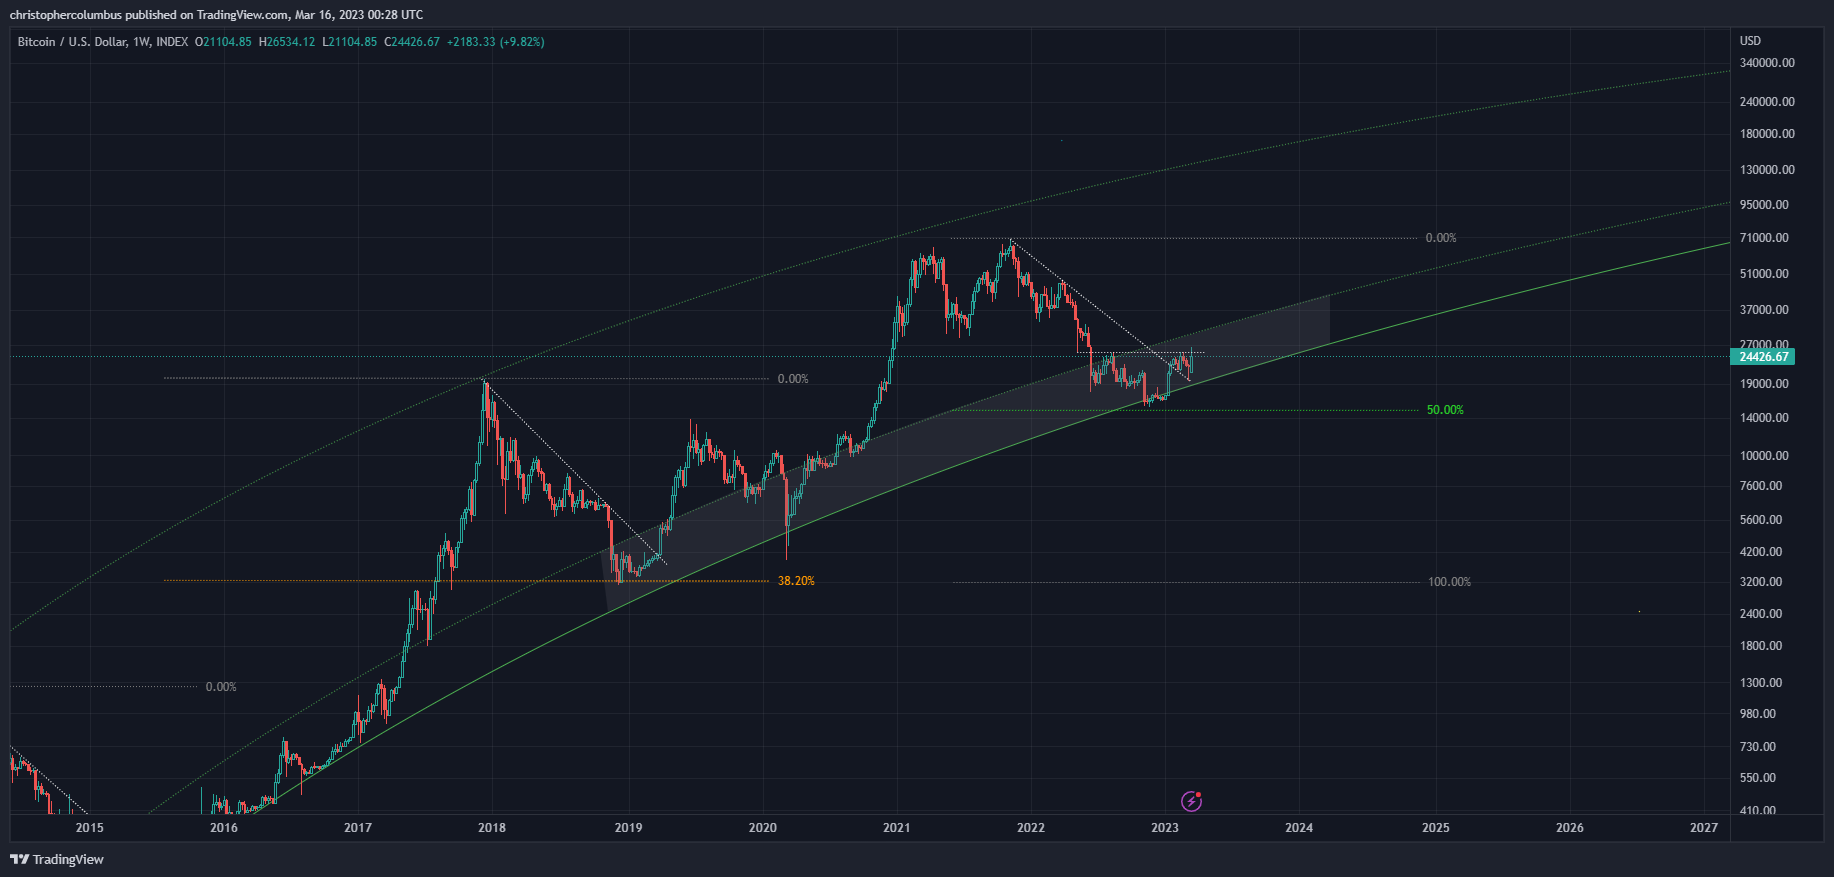
We often get locked into seeing the chart close up. We see the price move in factors of thousands of dollars, and yet percentage-wise these may not be huge. The numbers [the nominal values] may have got big, but the real values [percentage/ ROI moves] remain the same. Consider, for example, that price is still well within the buy zone… which is only the lowest band of the LGC channel [price is low in LGC terms].
OK, a 47% difference in price over the past few months is quite something, but these price points come on the back of huge [and temporary] volatility. This is Bitcoin. A more nuanced technical stance can be taken to your buying policy while price is in, for example, the above triangle… or one could average in by buying a few tranches over a reasonable period of time [assuming/ on the basis of the LGC and the buy zone].
4] Is the Risk/ Reward Ratio Favorable for Longer-Term Investors?
Lastly, the investor no doubt asks with price so high, is the investment worth it? Is the potential reward worth the risk? Of course here we might be getting beyond the buying of a smaller percentage [of your net worth] as insurance, and buying a greater percentage as an investment proper. In my opinion, the risk is still worth it on the basis of the following technical chart [a chart that serves to back the fundamentals that we all know so well]. Once again, zooming out to the longer-term chart that should be of more interest to the investor -
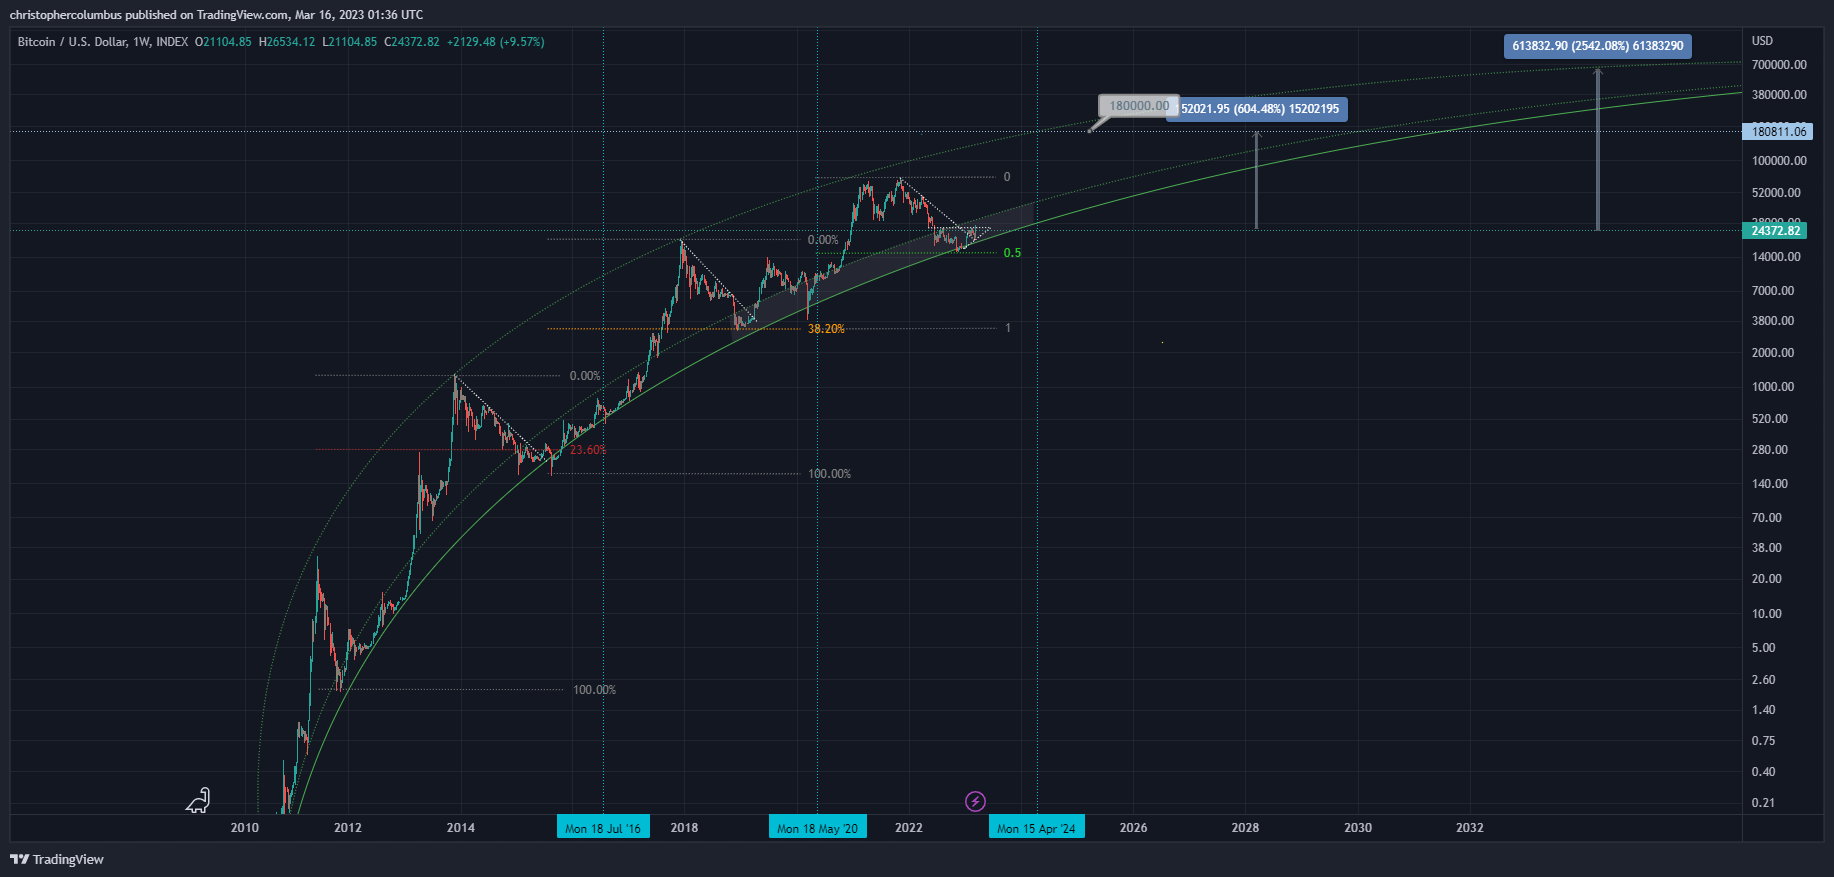
Speculative of course, but on the basis of the LGC and past performance of price action, the investor could expect to see an 8x as early as a couple of years away on a spike, while [if sitting on a position for the longer-term] that investment could well see a 26x return in a decade.
As goes BTC, so too do the alts. A healthy BTC chart is good for the wider market. If BTC is as I believe building a base here, then this may be the time to also ‘invest’ in a few of the more voltile alt coins. I ‘interrogate’ that word as those ‘investments’ may be sold as longer term trades, whereby one can realize profits [and possibly even more ‘leveraged’ ones] without having to sell all or most of that core Bitcoin investment.
Until next time,
Stay [relatively] safe out there,
Dave the Wave.