
BTC Update
Dear Readers,

What a difference two weeks make. I think it fair to say that much of the anxiety toward price that we saw over the past couple of months has passed. Price has broken upward through a key level of horizontal resistance, back into the previous range that was pushing all time highs.
Medium and Shorter Term Charts
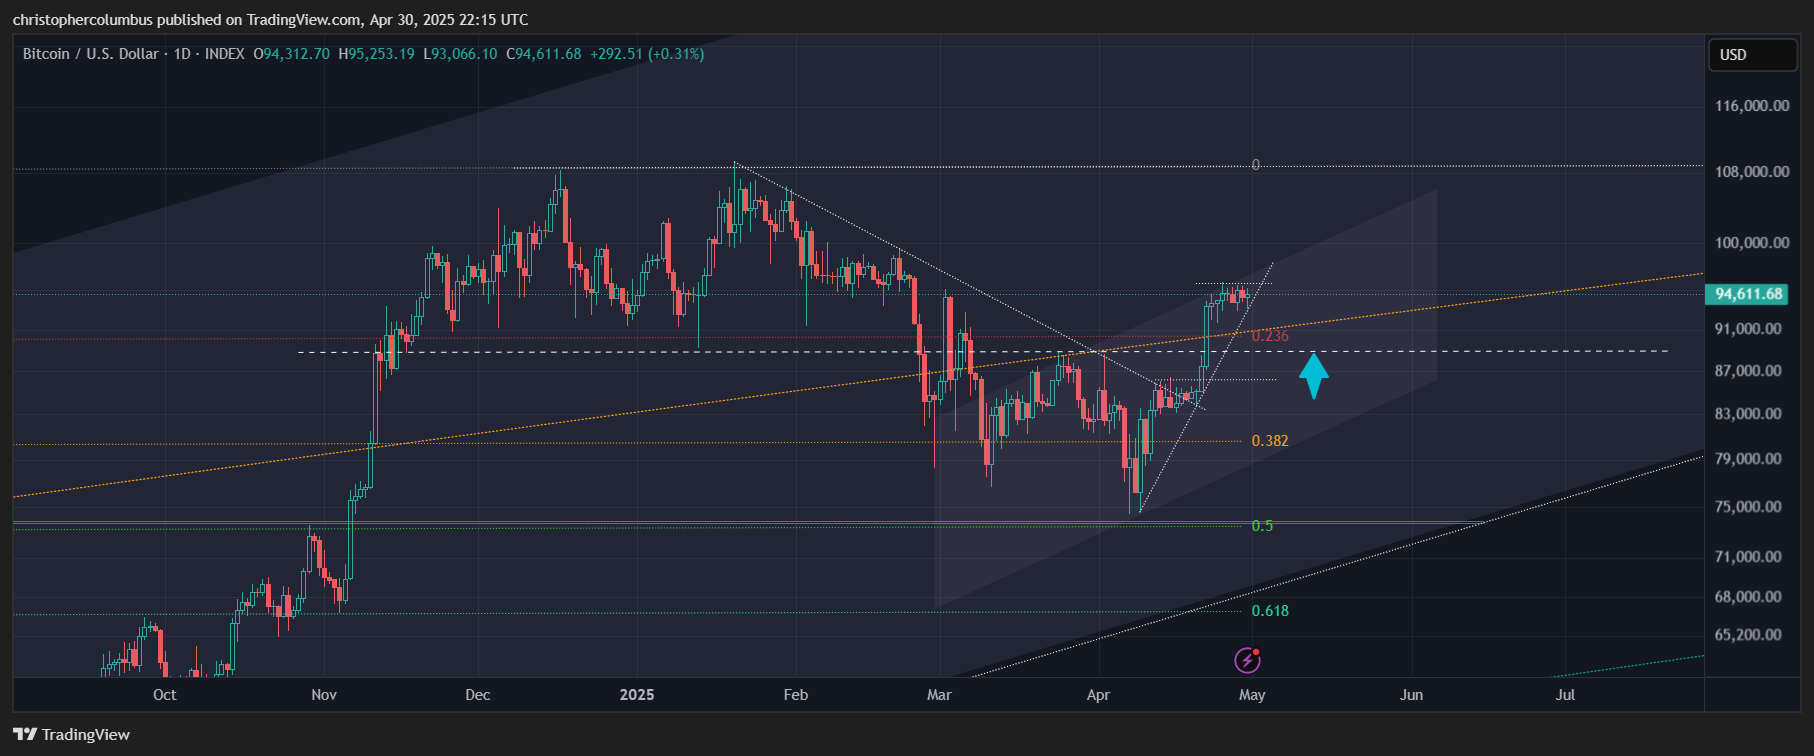
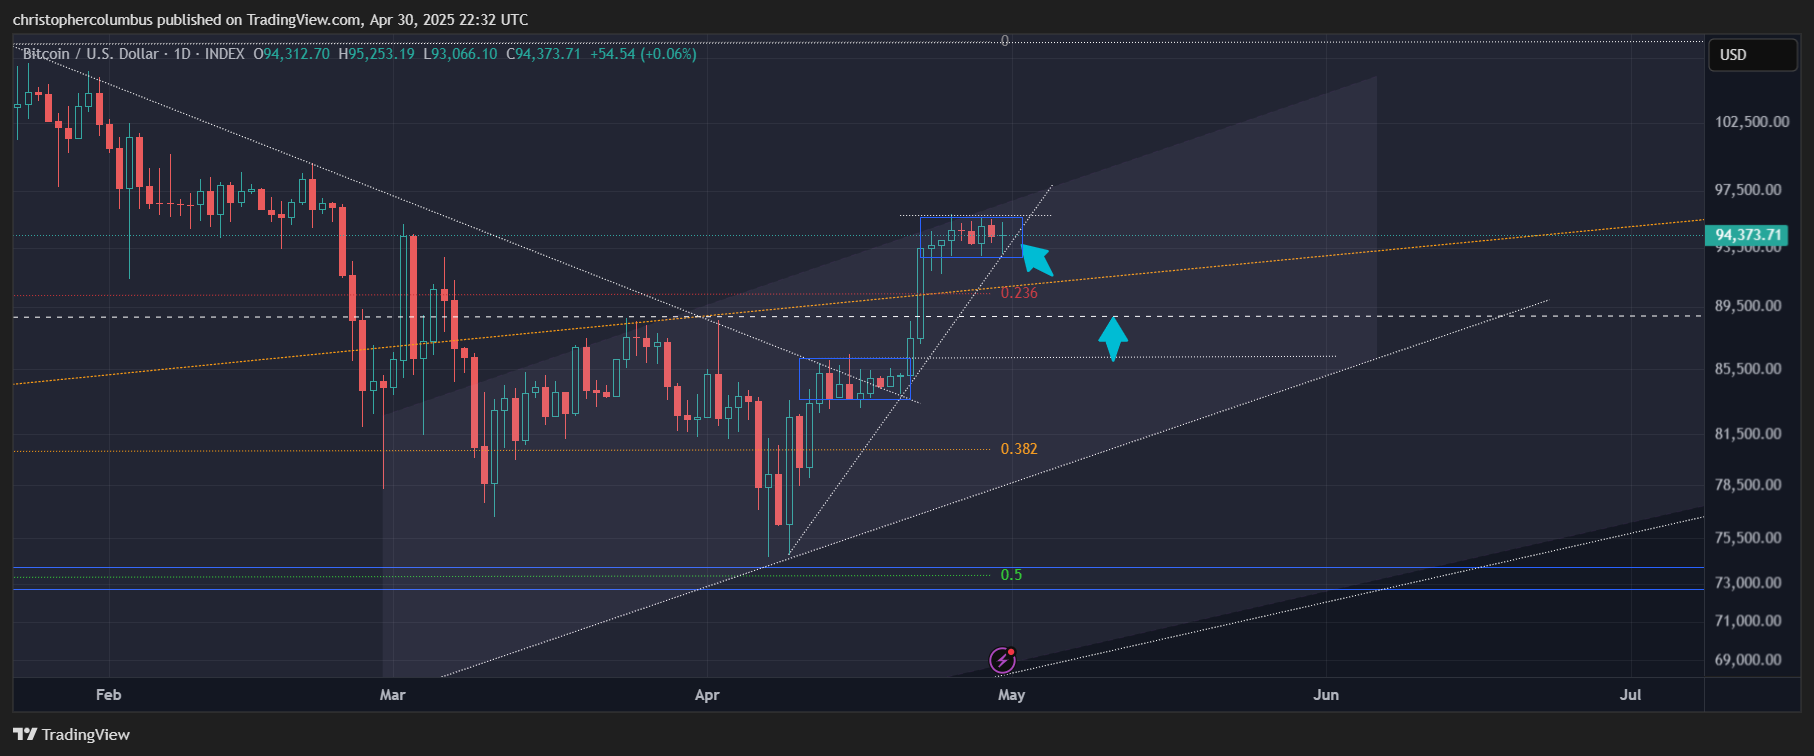
Even if price were to consolidate a bit in the more immediate term, instead of breaking further to the upside here and now, there is plenty of room for price to remain bullish with a key support level, on the medium term chart, at previous resistance come support [0.5 fib]….
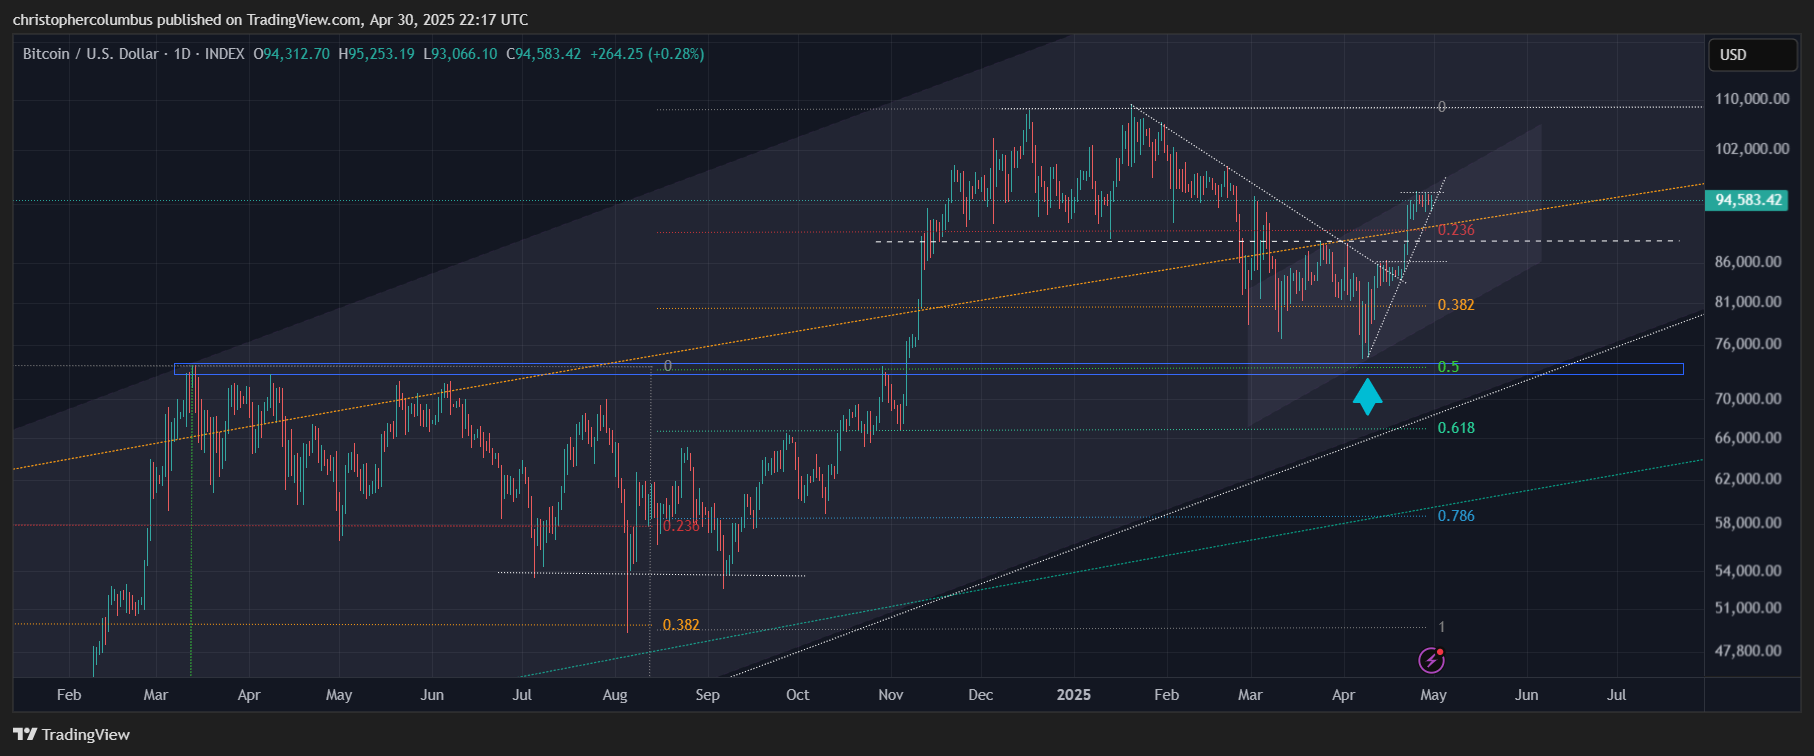
…while another few layers of technical support are found at higher levels in the shorter term. Bullish.
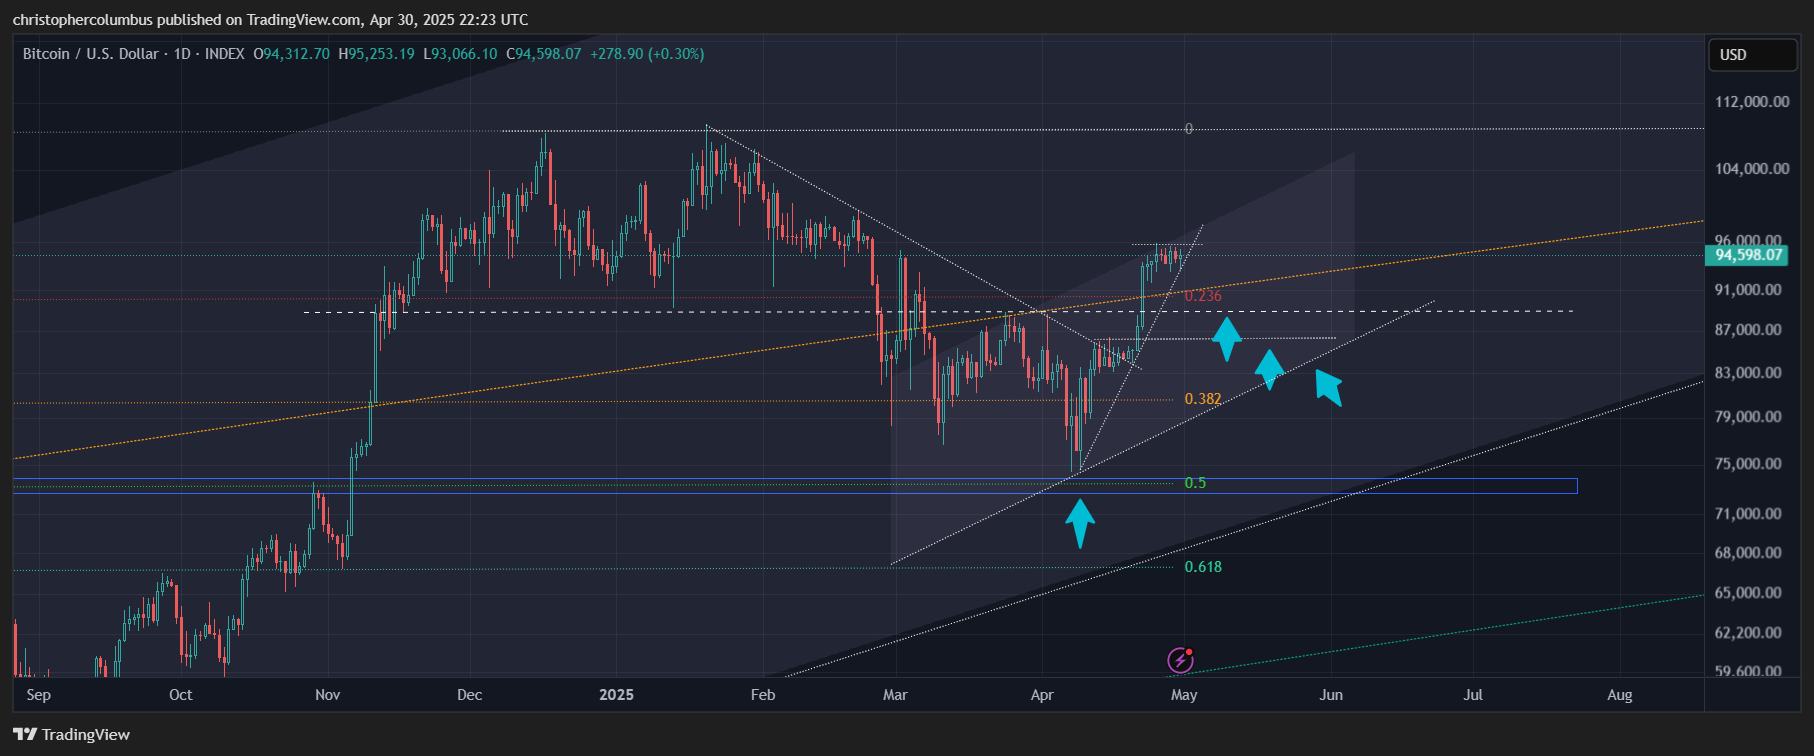
Zooming right in, there is even the possibility of a continued move up in the immediate term. Add to that the similarity of the tight range formed, as per the previous range, and I’d not be surprised to see a similar move higher to push previous all time highs.
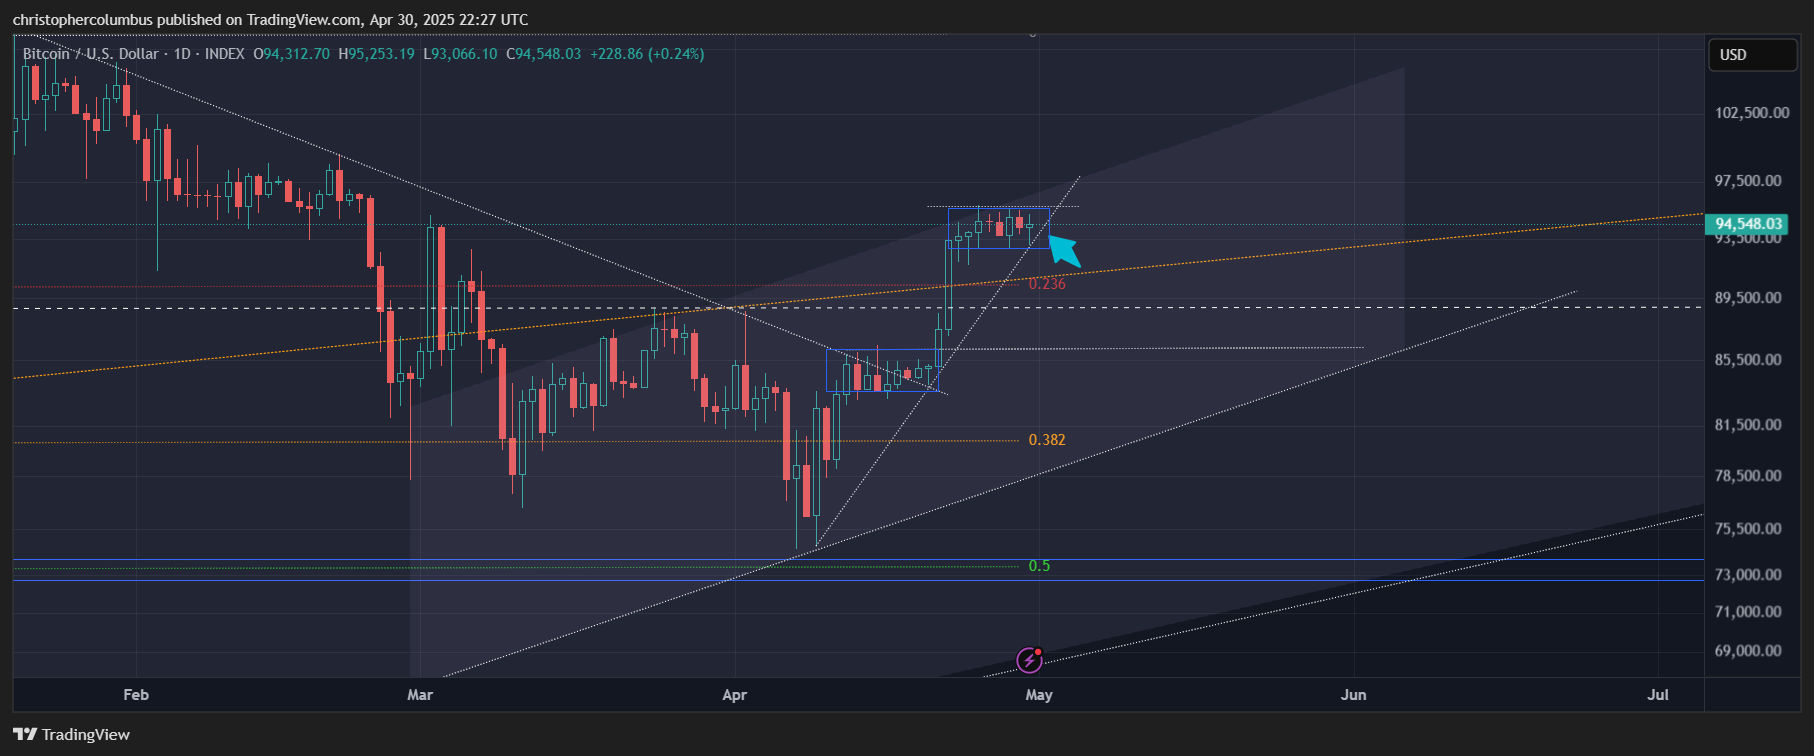
Must such a move eventuate? Of course not, and given the shortest term TA is less weighty than the longer, consolidation can be half expected to the shorter-term resistance come support level.
Where these shorter-term moves are going to interest traders and those on the sidelines looking to enter positions, the longer-term chart is going to be more relevant for hodlers and investors.
Longer Term Charts
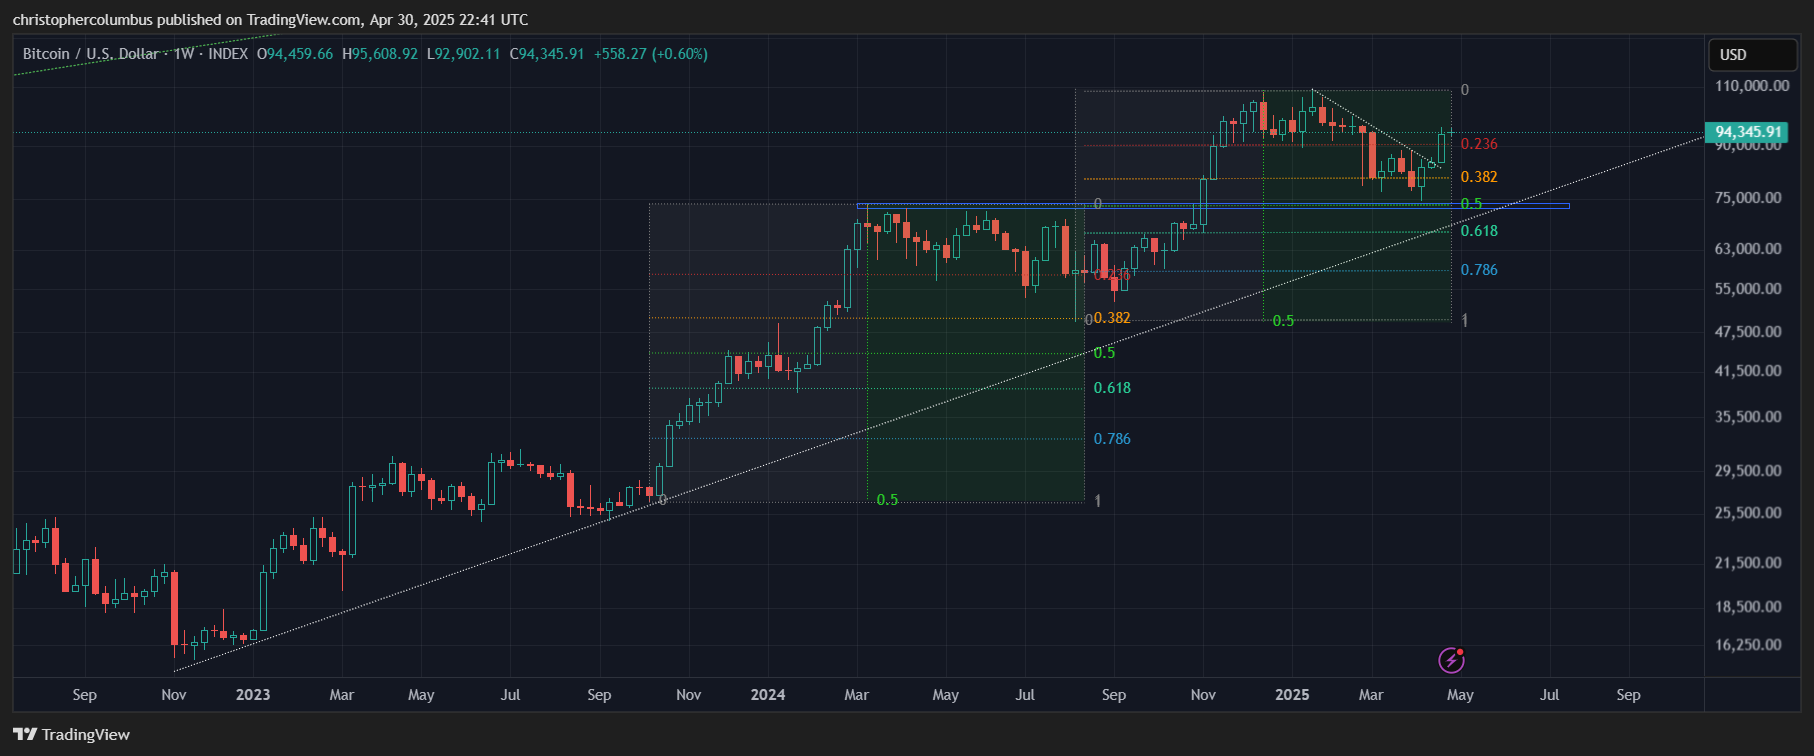
The chart consists of two axis, and in TA, time is just as important as price. On the multi-month chart, we clearly see that the length of the correction matches the run up, and as comparable to the previous run up and correction. The recent correction corrected further [0.5 on the fib] and back to previous longer-term resistance come support giving the chart some technical weight. The multi-year rate of appreciation/ diagonal support is also looking solid.
Next, onto the weekly MACD, a major momentum indicator. Once again, this is looking solid with the MACD, still in bull territory [above the zero-line], turning upward and about to bullishly cross its signal line. Again, the similarity of the MACD to the previous move - consolidating to near the zero-line and a histogram that got equally extended.
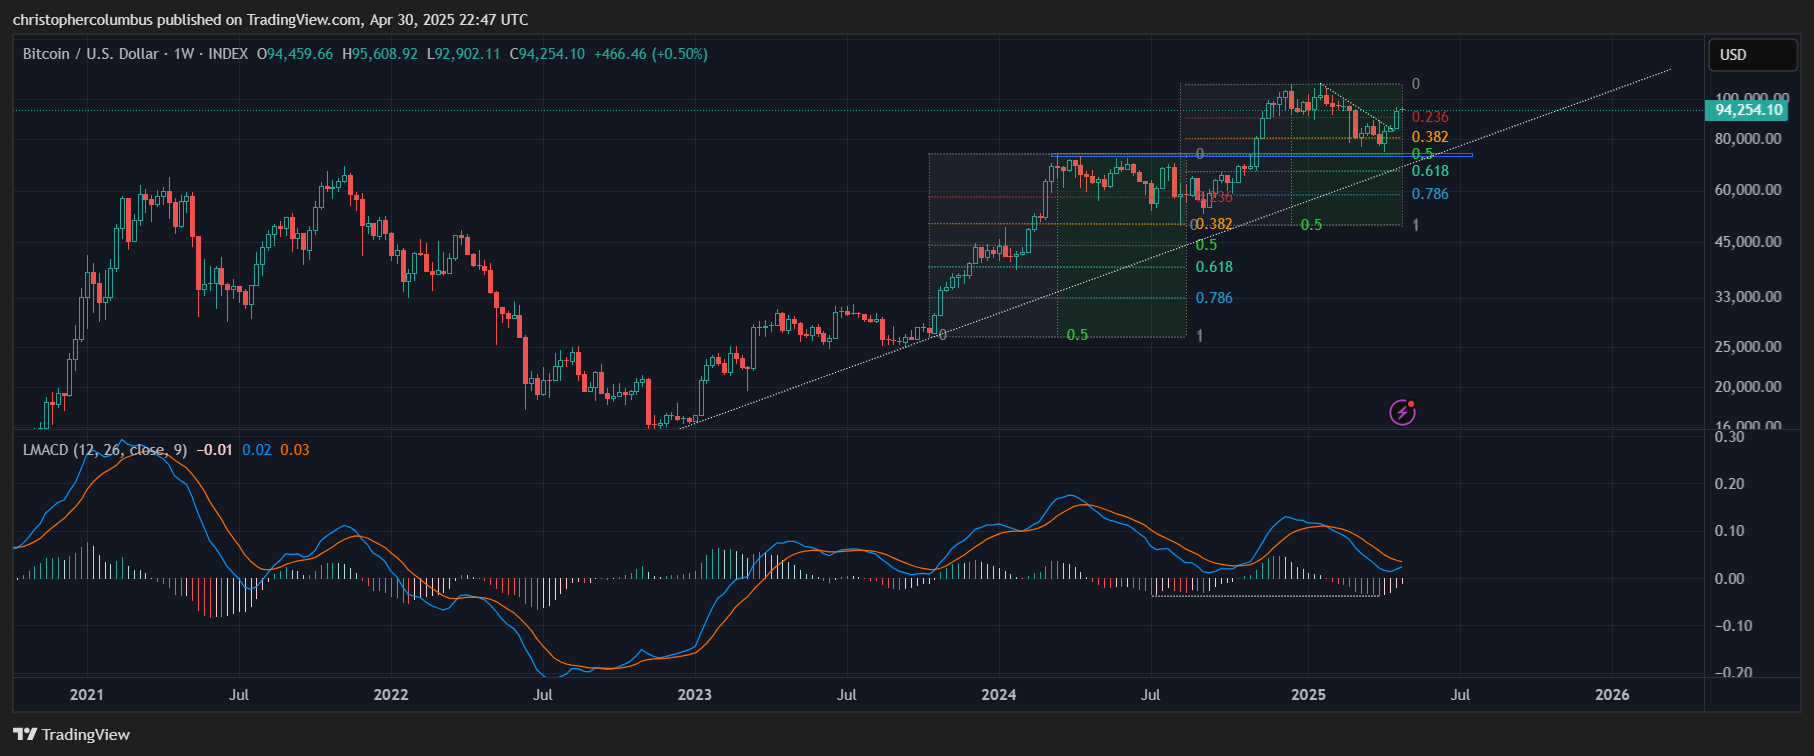
Zooming out on the weekly MACD, you can see there is plenty of room for the MACD to run within the longer-term line of resistance as drawn and with a four year bull market in mind.
And finally to the monthly MACD:
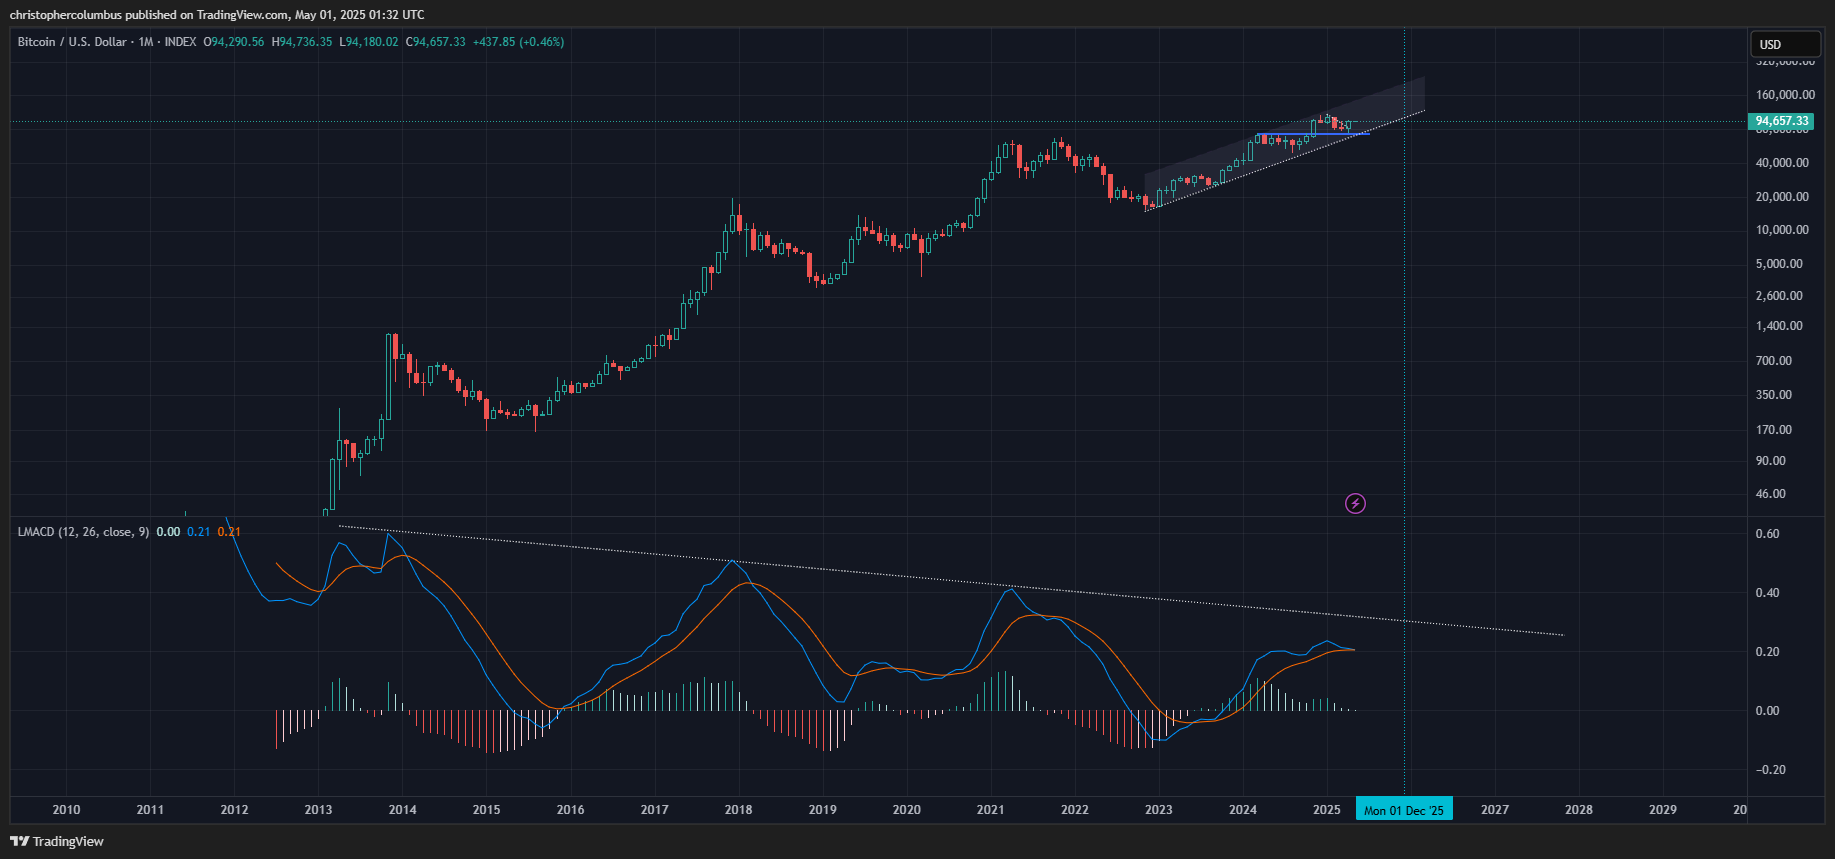
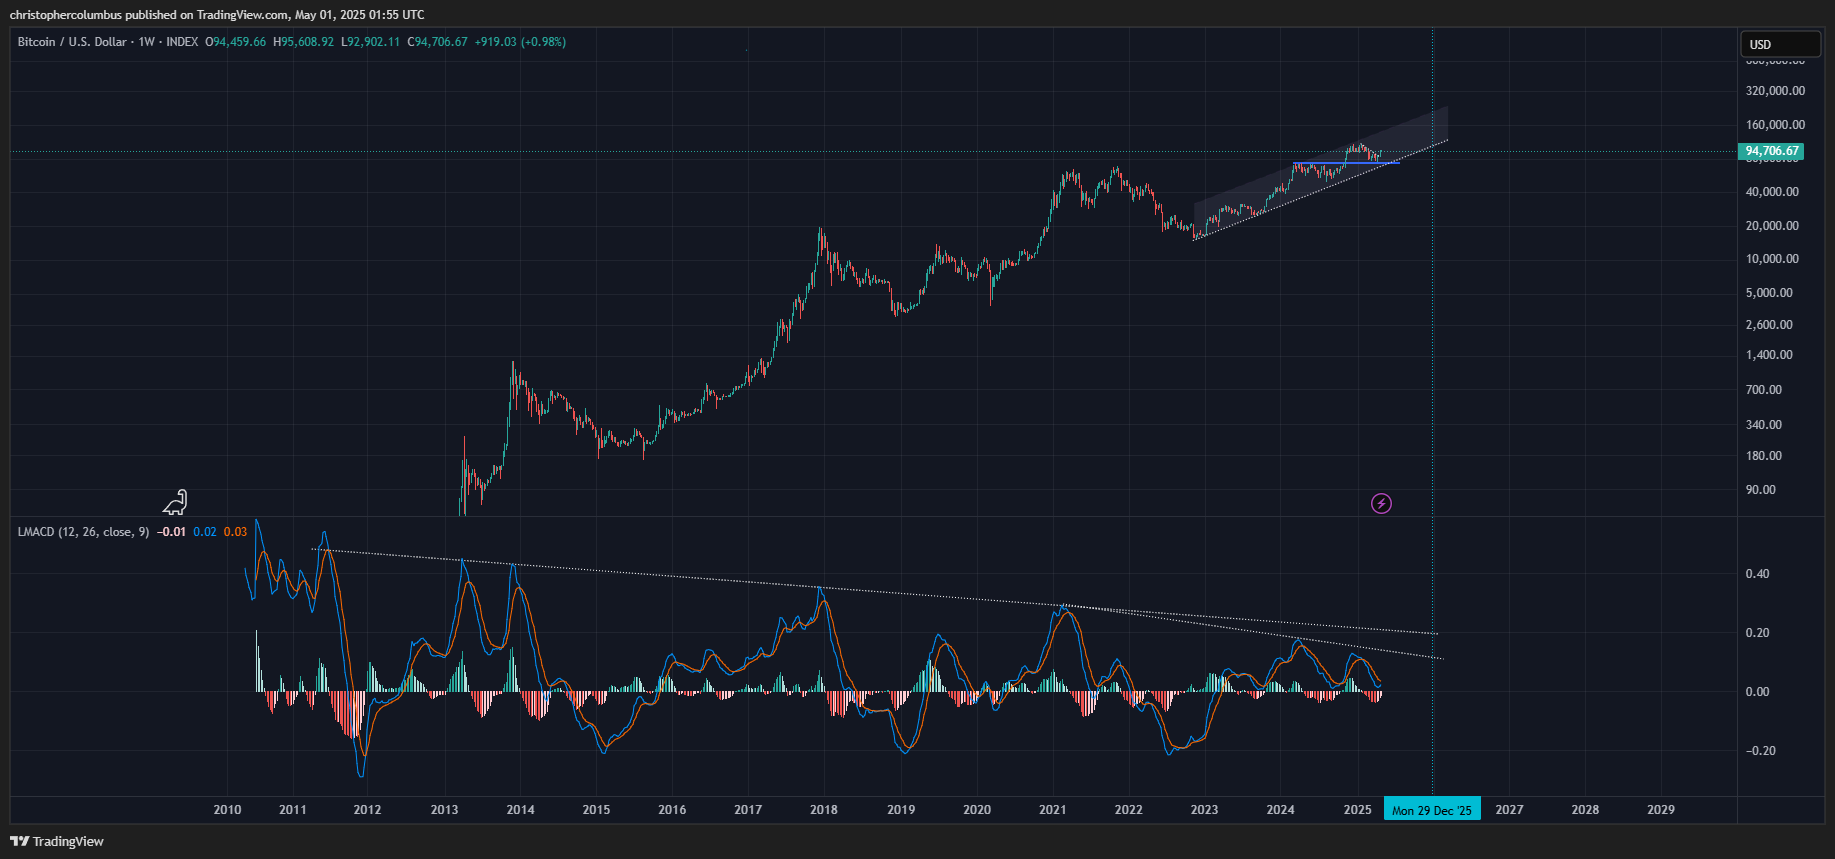
The MACD is still well in multi-year bull market territory being well-elevated above the zero-line. Currently, we see the MACD ‘kissing’ its signal line and likely not crossing it bearishly but rather turning up.
Once again, plenty of room for the MACD to run before hitting the long term line of macro resistance [denoting a maturing market in my opinion].
What is most striking about the chart when viewing on the longer term is the reduction in real macro volatility as compared to earlier bull markets. This is due, in my opinion, to the BTC market moving toward an eventual price discovery that would also represent the capitalization of an alternative currency. With less parabolic and extreme price action, technical analysis should also increasingly come into its own.
Until next time,
Stay [relatively] safe out there,
Dave the Wave.