
BTC Update
Dear Readers,
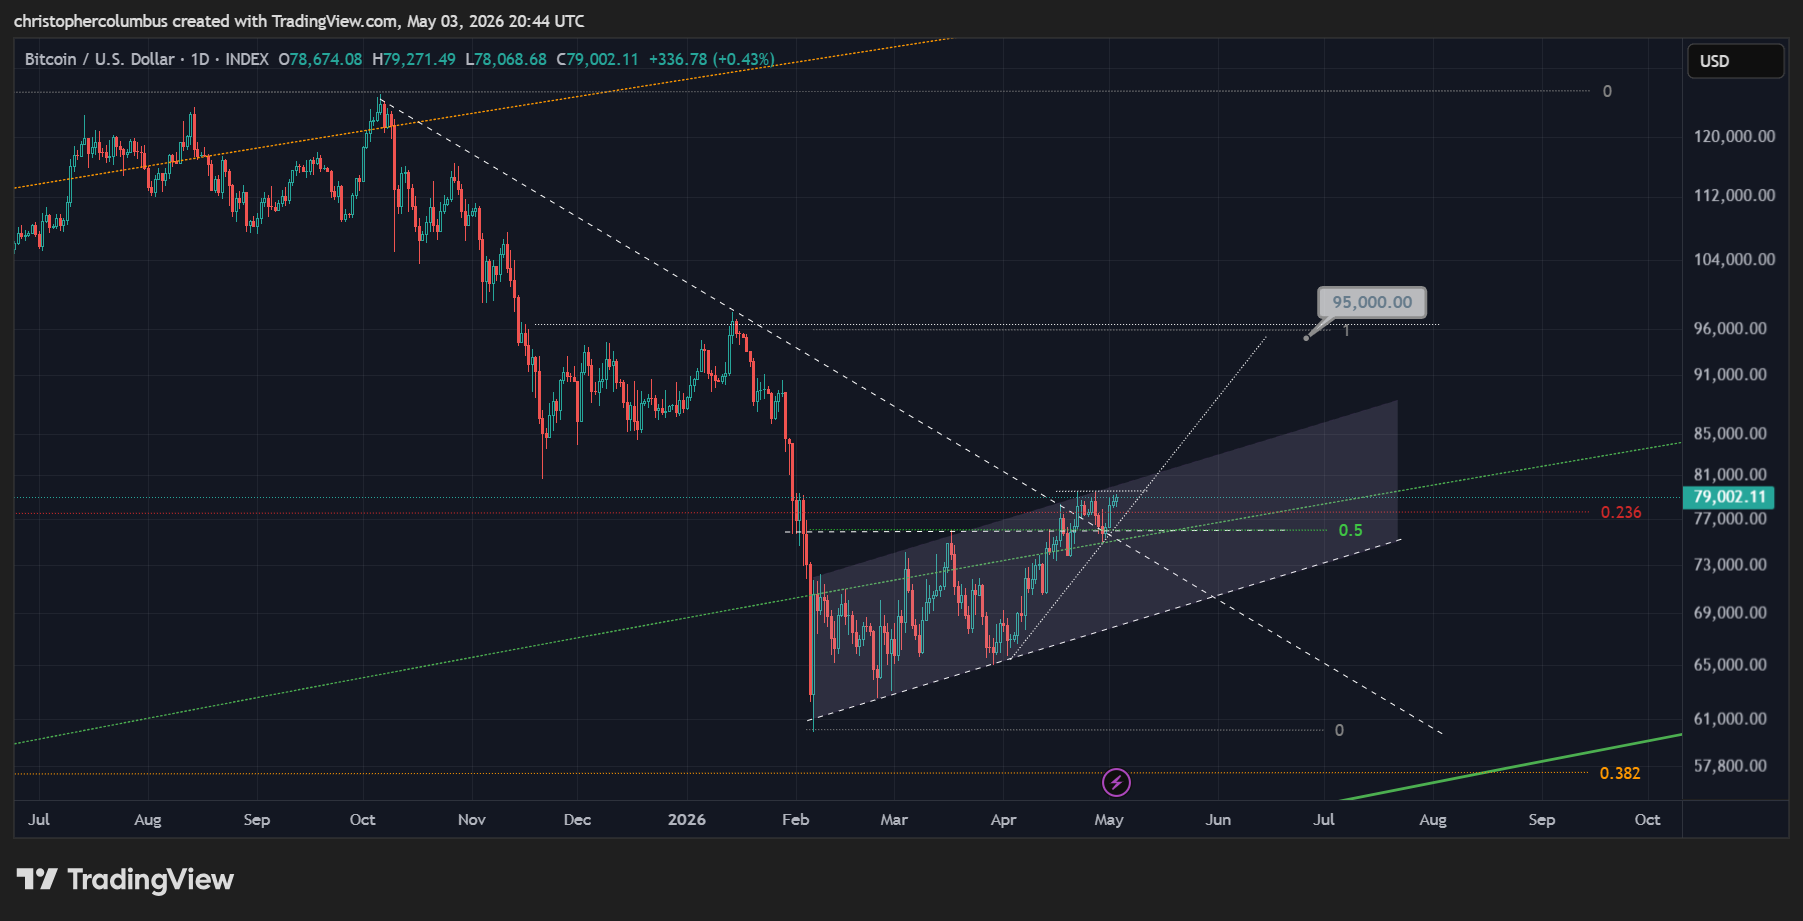
With price now pushing multi-month highs since the January capitulation, the market looks to be warming up… even as sentiment is still very low, sentiment always being a lagging indicator.
Technically, the road looks open for a move to that shorter-term target of 95K with shorter-term horizontal and longer-term diagonal resistances breaking, price currently atop of a multi-month upward channel.
Price is now just outside the buyzone [seen more clearly on the longer-term chart below], where the investor late to the market, in multi-year terms, would have done well to buy an initial tranche.
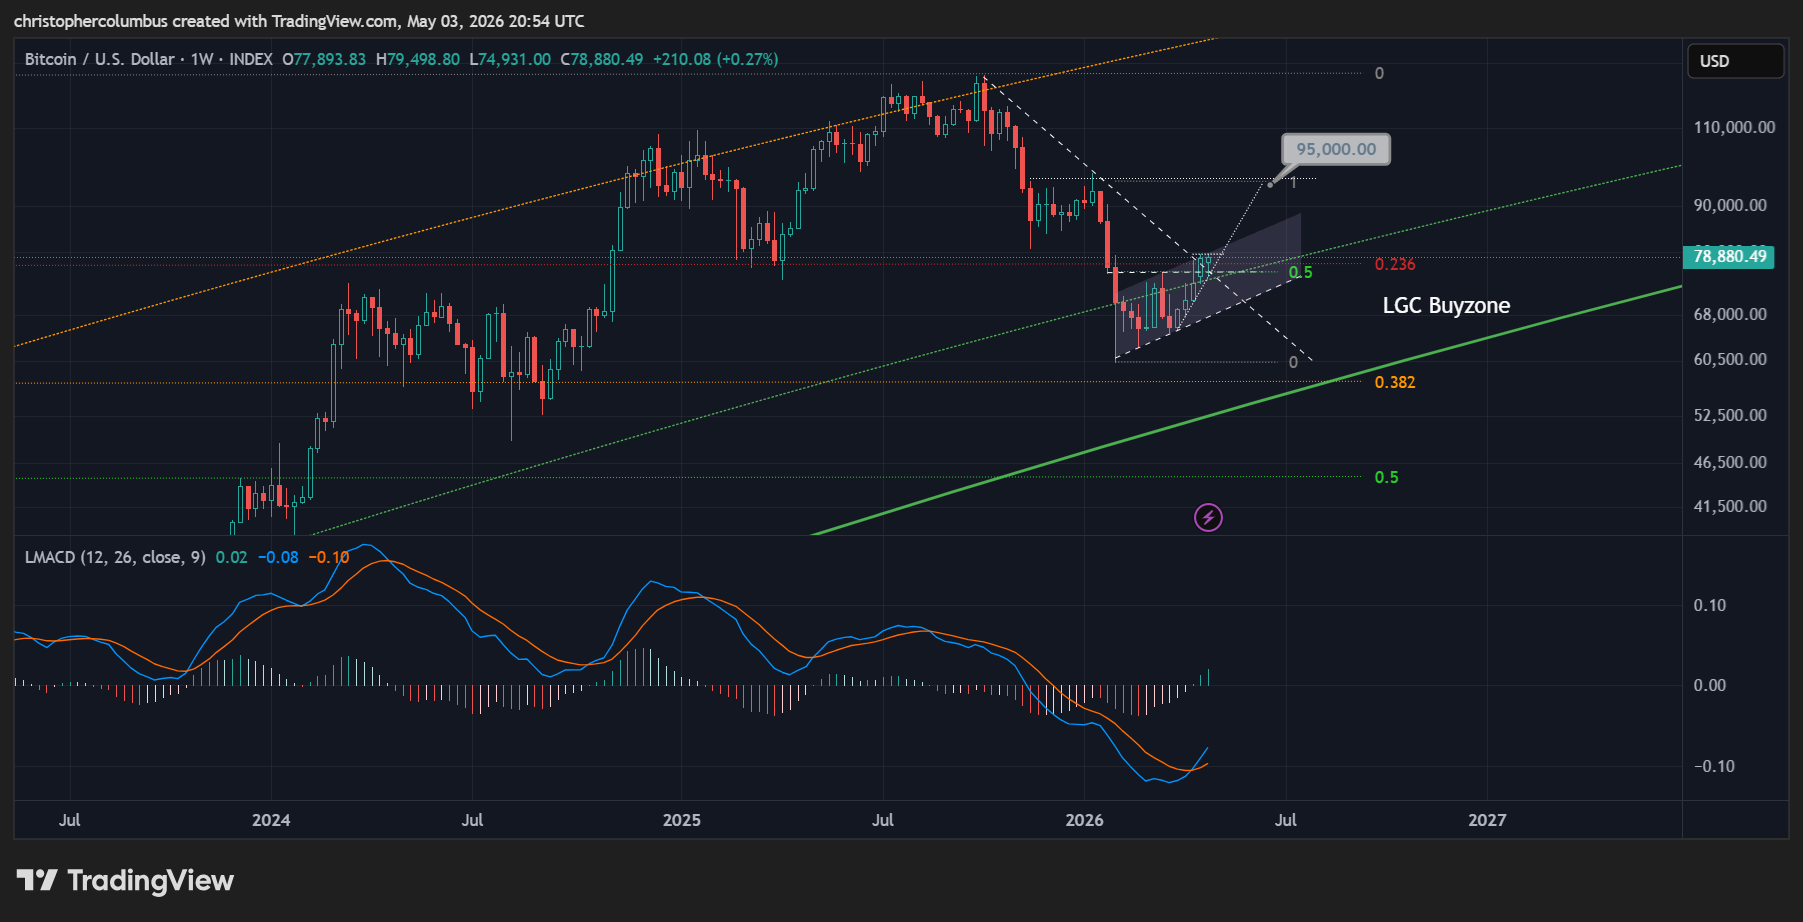
On the weekly chart, you can see a platform building. Though that move up to 95K is not a certainty, it should in now way suprise given the technical setup. A move to that target would just be an unwinding of the January capitulation. Volatility to both sides remains.
While I have always considered a further low possible, to say the lower level of the ‘LGC buyzone’ and consistent with a year long correction, I have at the same time not put overdue weight on this outlook given a more technical market [as opposed to parabolic]. The logic being that without the parabolic move up, we may not see that equal and opposite large move to the downside.
The significance of a breakout here to 95K would be a confirmation of the cyclical lows being put in in my opinion, so we are presently in a very interesting juncture.
The weekly MACD is also of interest, showing a continued cross of momentum to the upside while well below the zero line. The expectation being at least a move up to that zero-line signaling a stabilization in the market.
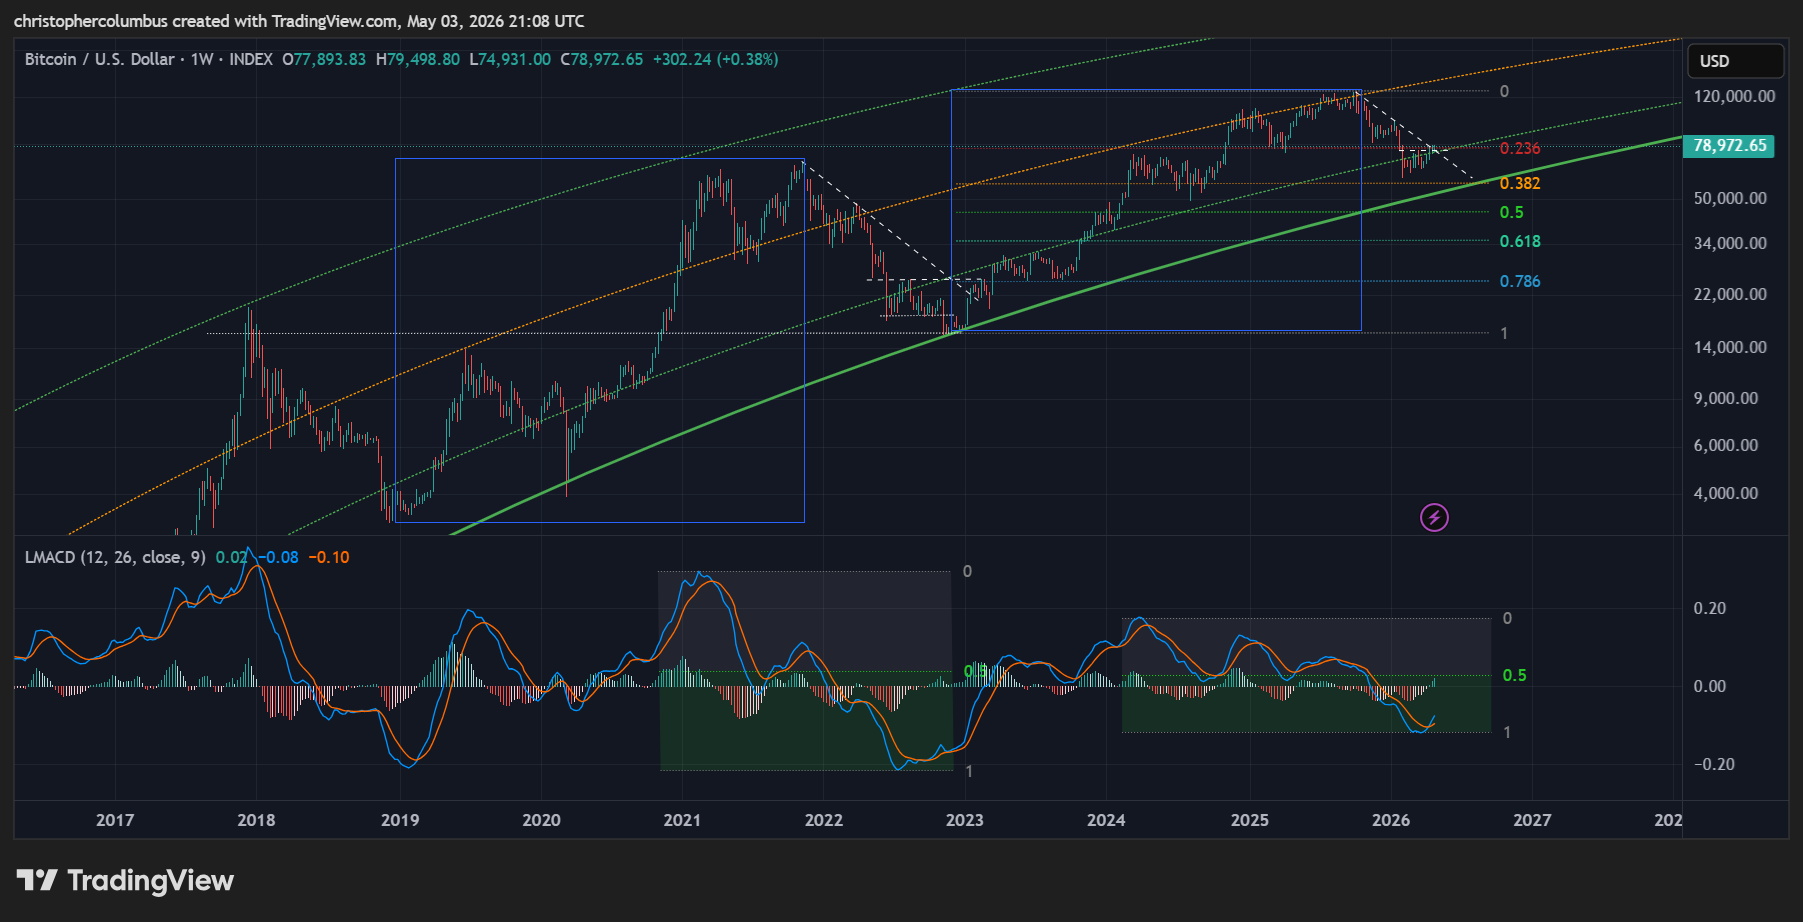
The essential macro story here is one of increasing stabilization in price. While this makes huge parabolic spikes in price more unlikely; on the positive side, it also makes more unlikely huge declnbes in price. Remember, we only see the current decline in price as huge if we focus on the nominal numbers [money illusion]. If instead we focus on the real move, as represented on the log chart above, the decline is not so significant.
The weekly MACD is of interest. In the previous more parabolic market, the MACD reached both above and below the zero-line near equidistantly. So too, the comparison would go, the MACD low likely is in given it has also reached as far below as above in the current cycle.
None of this of course precludes a lower price [if we compare the previous MACD low to price action], BUT that lower price would likely, if it eventuated, not be of a large magnitude. Momentum looks to be clearly turning around within the macro model of a logarithmic growth curve that has held true since 2018.
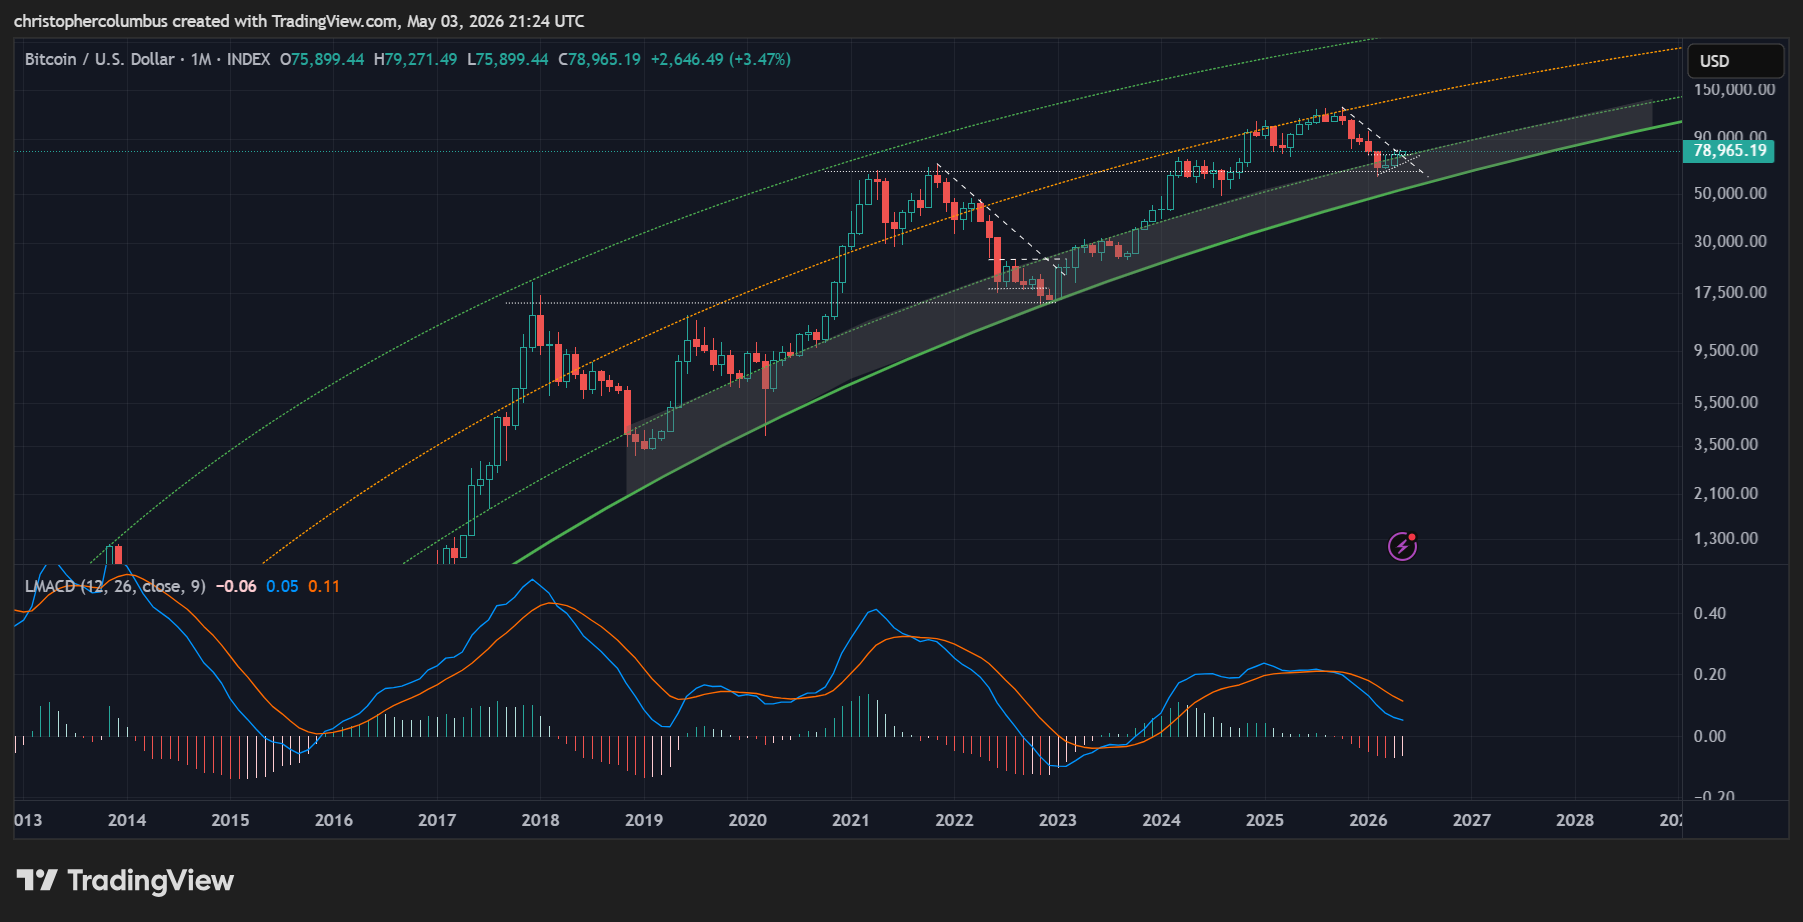
If we allow ourselves to get a little excited for a moment, this chart is looking promising. Macro support combines with the shorter term technicals to give a good outlook:
- Price finding potential support at the previous cyclical peak
- Price finding support at the LGC base [buyzone]
- Histogram on the monthly histogram contracting for the first time
- MACD close to the zero-line and turning upward
Given the stabilization of price thesis, that of increasing price discovery, you probably couldn’t get a better chart. Though unpopular at the time, this is really what the LGC model is all about - explosive gains at the start working towards an eventual plateau.
Of course, this never suited the outlook of the hyper-inflationists that always saw price exploding upward here and now, or just around the corner. The logarithmic growth curve, on the other hand, with a more realistic price outlook… and one extrapolated on actual price development, always remained unpopular. Understandably so when we are motivated by immediate gain.
But I think there is a third outlook, between the optimistic and the pessimistic outlook, so to speak. Namely, that BTC will continue to be capitalised along the lines of a conservative LGC as long as the USD remains relatively stable. Once/ if the USD becomes destabilized, BTC priced in USD will break the LGC mold, and then we’d be pricing it against gold.
Until next time,
Stay [relatively] safe out there,
Dave the Wave.