
BTC Update
Dear Readers,
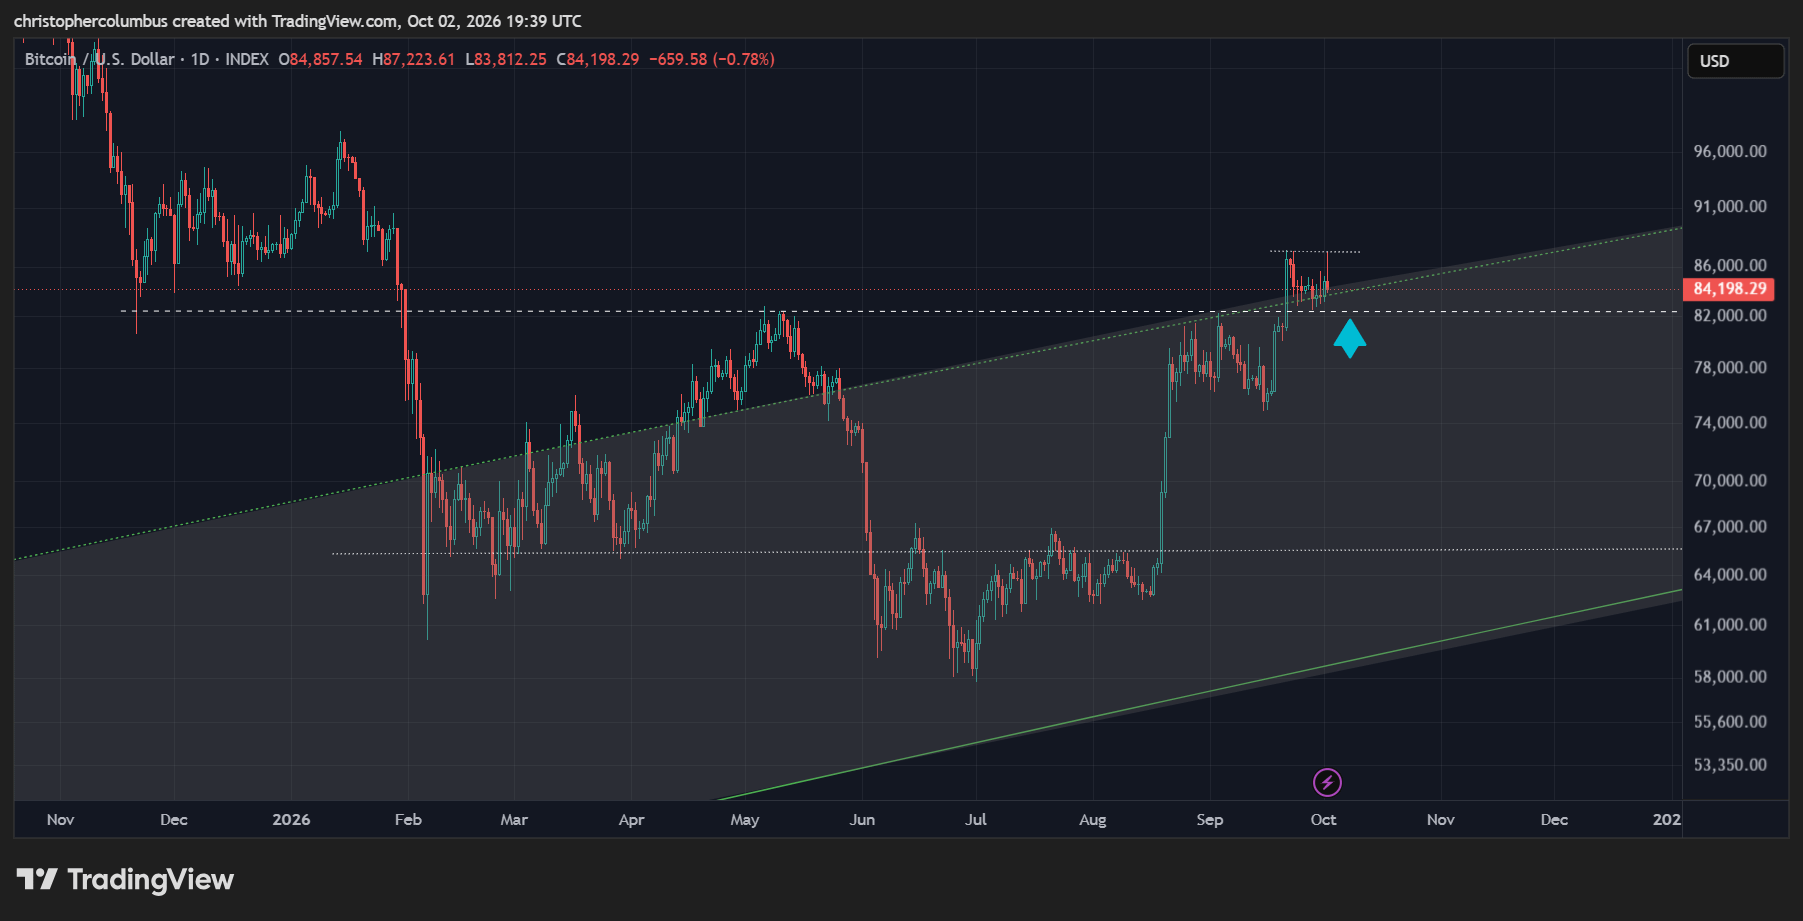
On the shorter-term chart, BTC continues to hold a significant line, which also happens to be right on top of the long-term LGC [logarithmic growth curve] ‘buy zone’.
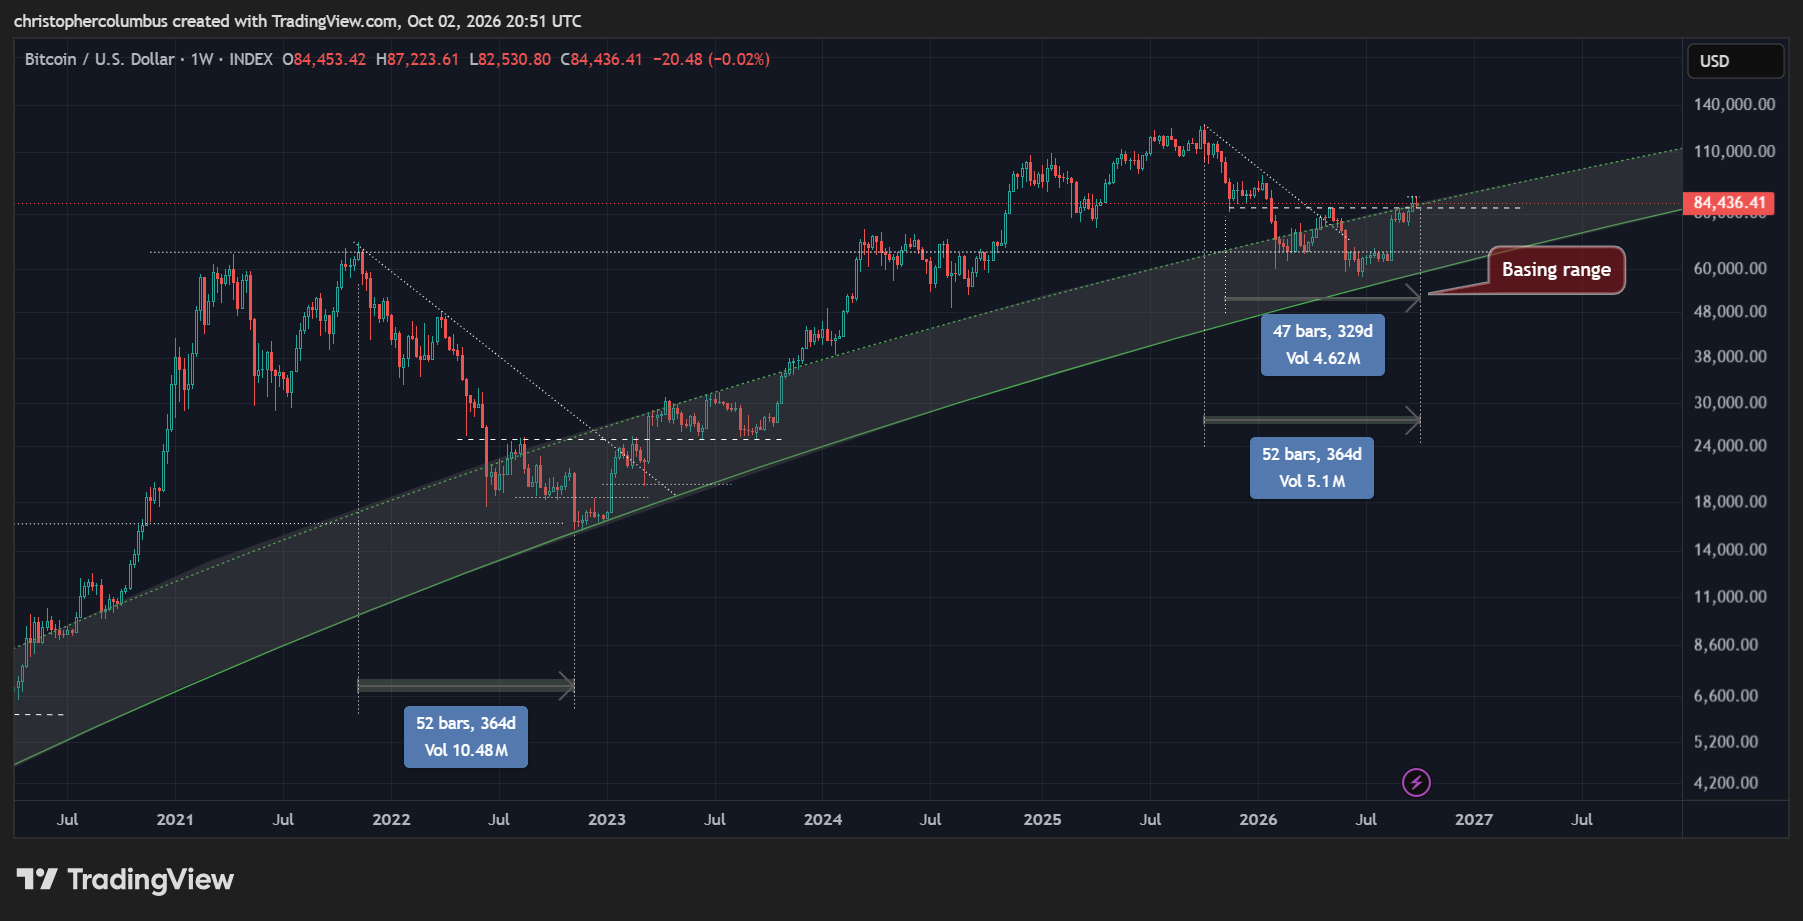
On the more medium-term, which smooths out the more immediate volatility, BTC is atop a multi-month [near 1 year long] sideward range, which very much now looks like the basing range of the multi-year cycle.
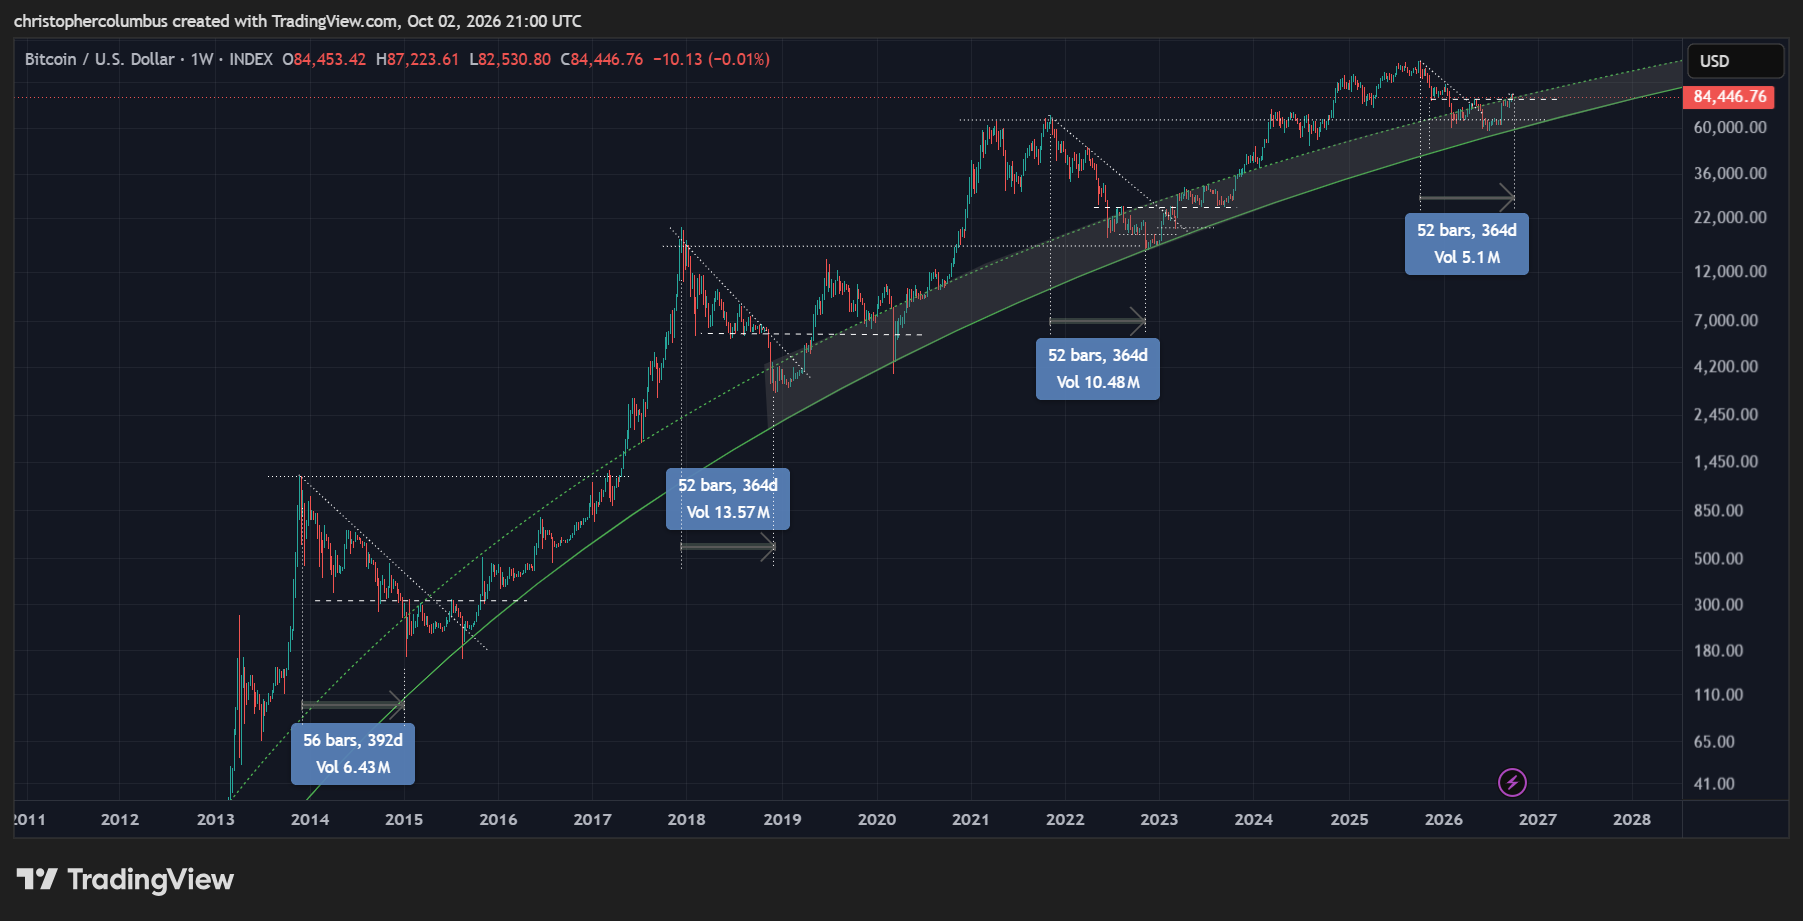
Where the basing range is near a year in length, the time lapsed since peak price is now actually a full year [commensurate with previous corrections].
A Closer Look at the Basing Ranges
The focus here is on a comparison of the present basing range with the previous one…. given that I think the price action in a maturing market is more relevant [in contrast to the parabolic and more volatile markets of the past].
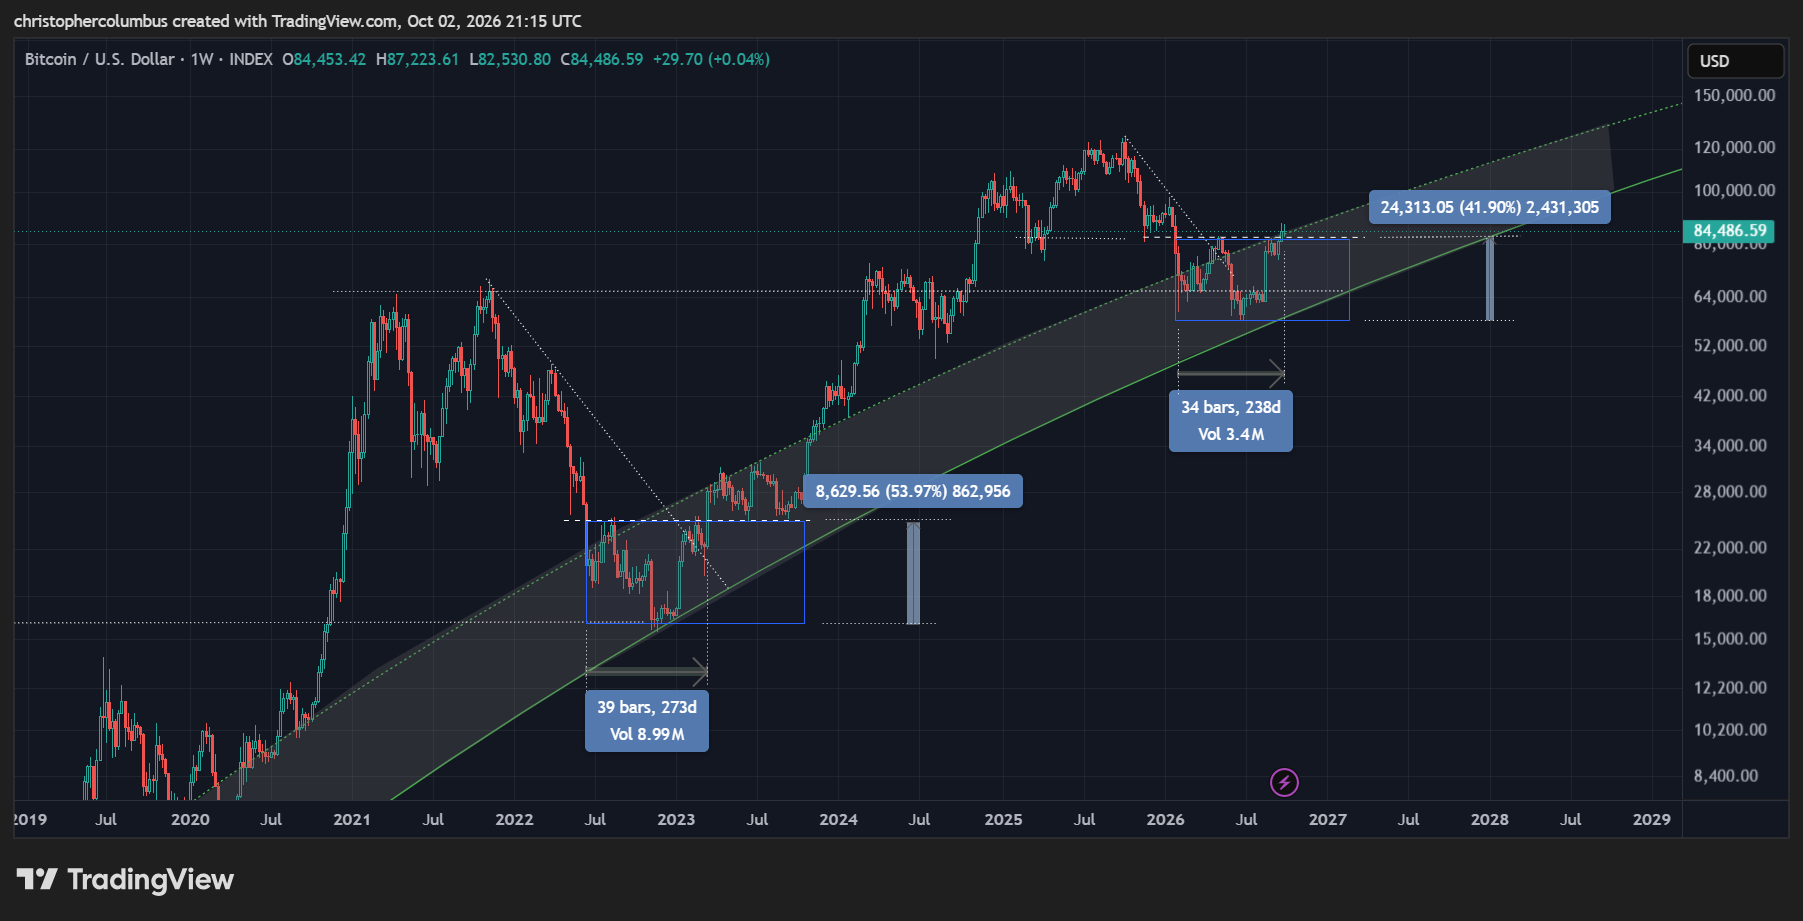
1] A similar range in price percentage-wise…. and a little less on the current range as you’d expect in a maturing market becoming less volatile in macro terms.
2] A similar time range lapsed in this current range as compared to previous.
3] And yet something to keep an eye on here, with the blue box and the shaded LGC ‘buy zone’ in mind, is possible continued ranging before the next move up toward the previous highs of the last cycle.
Possible Continued Ranging
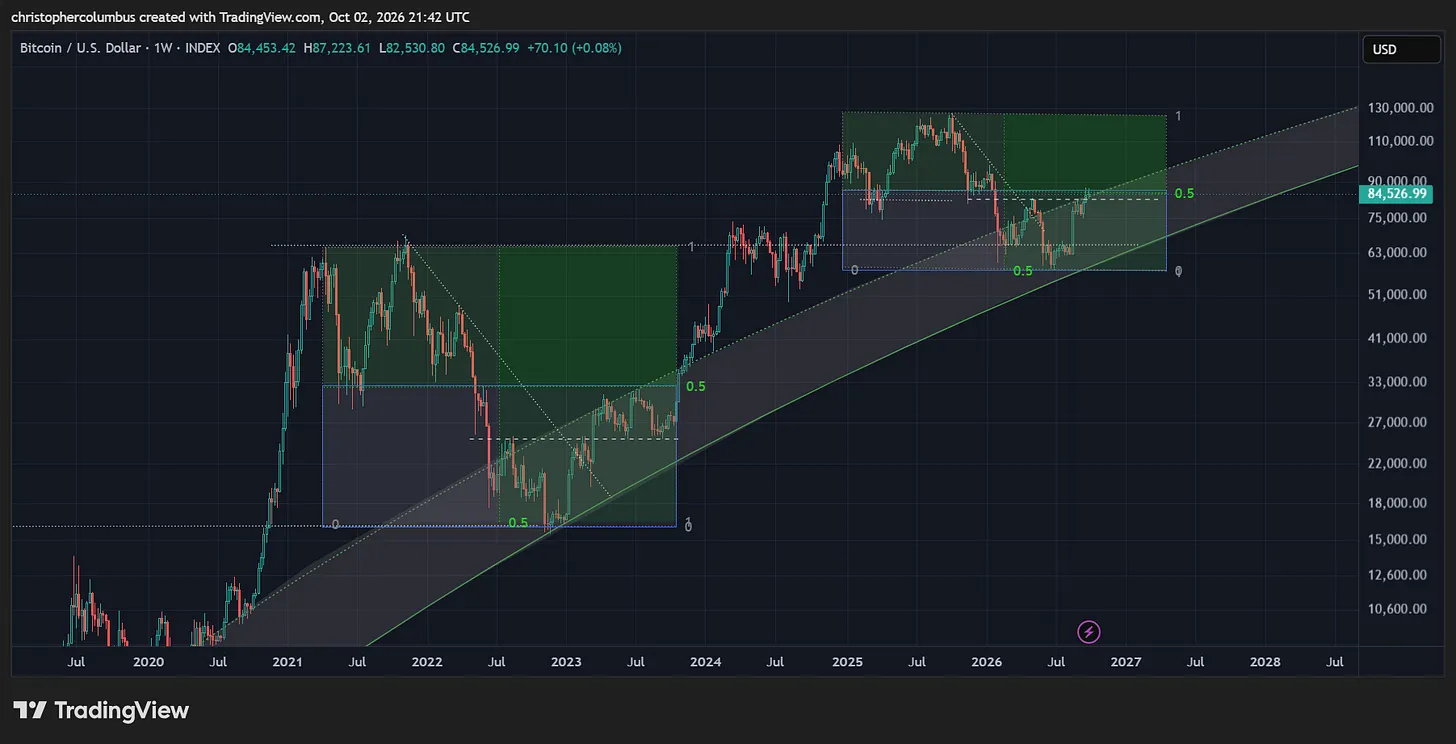
Something to keep in mind, in terms of market structure, is the following possible continued ranging within the ‘buy zone’. The fib extensions, both in terms of real price and in terms of price, provide some further support to this outlook.
The vertical price real fib extension shows price at a significant level as comparable to the previous cycle… resistance at that 50% level as measured from the top. With this in mind, some continued ranging of price, over the course of this 4th quarter would not be unexpected.
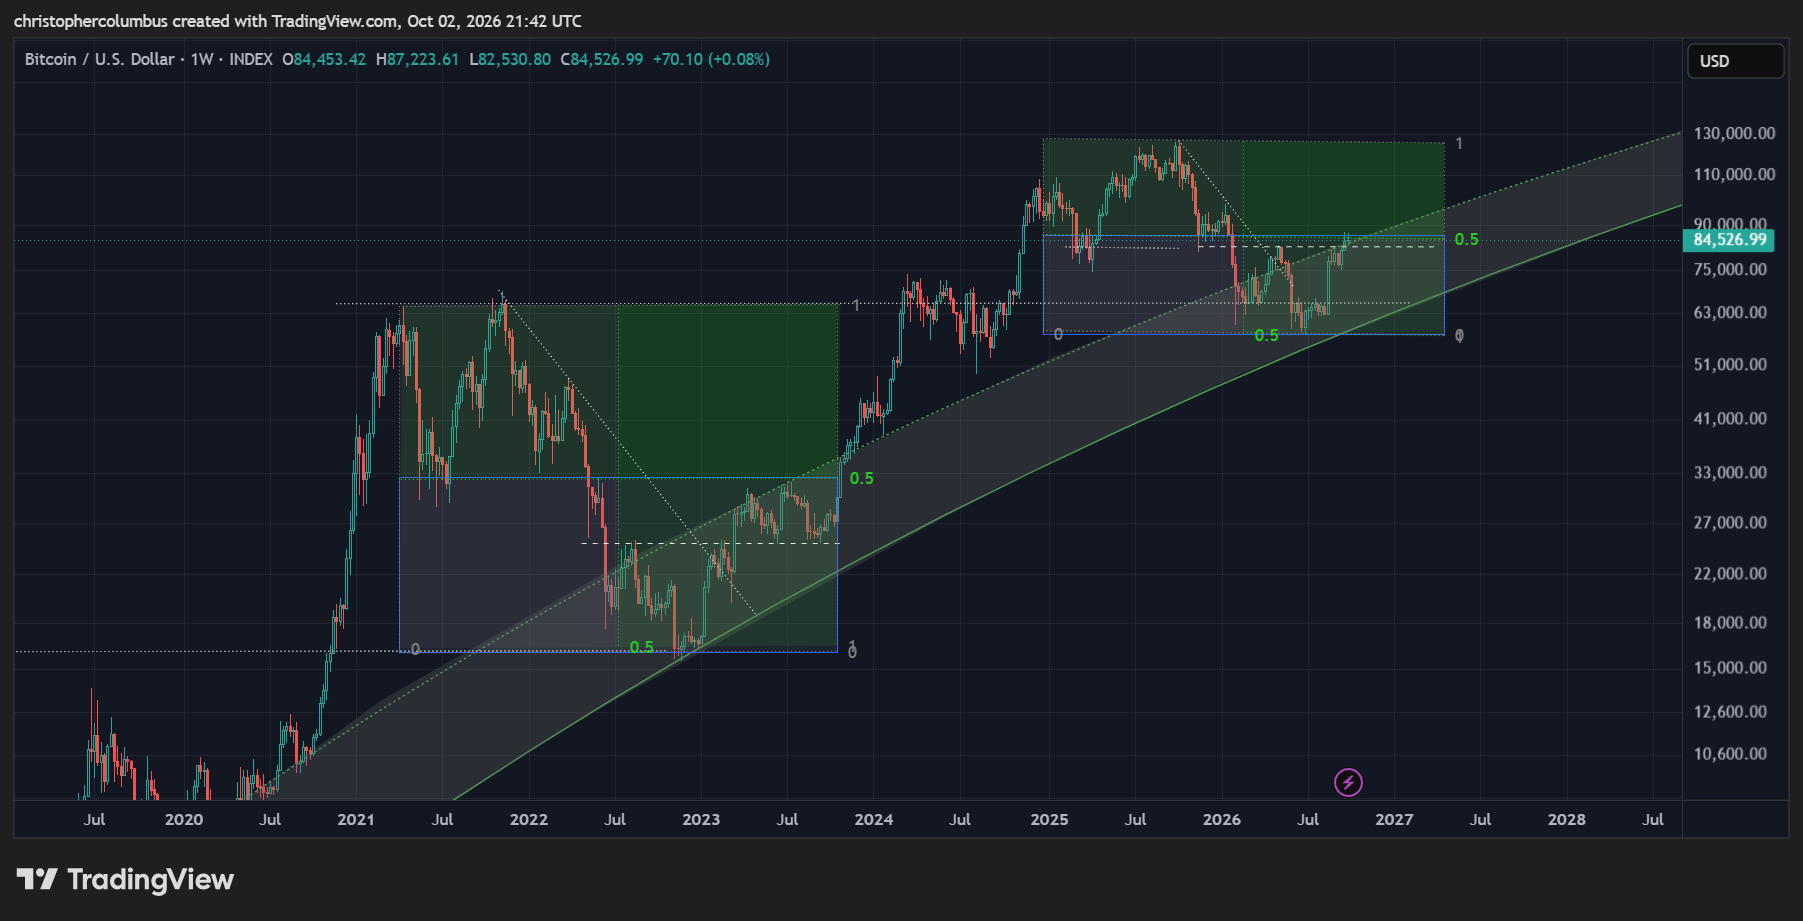
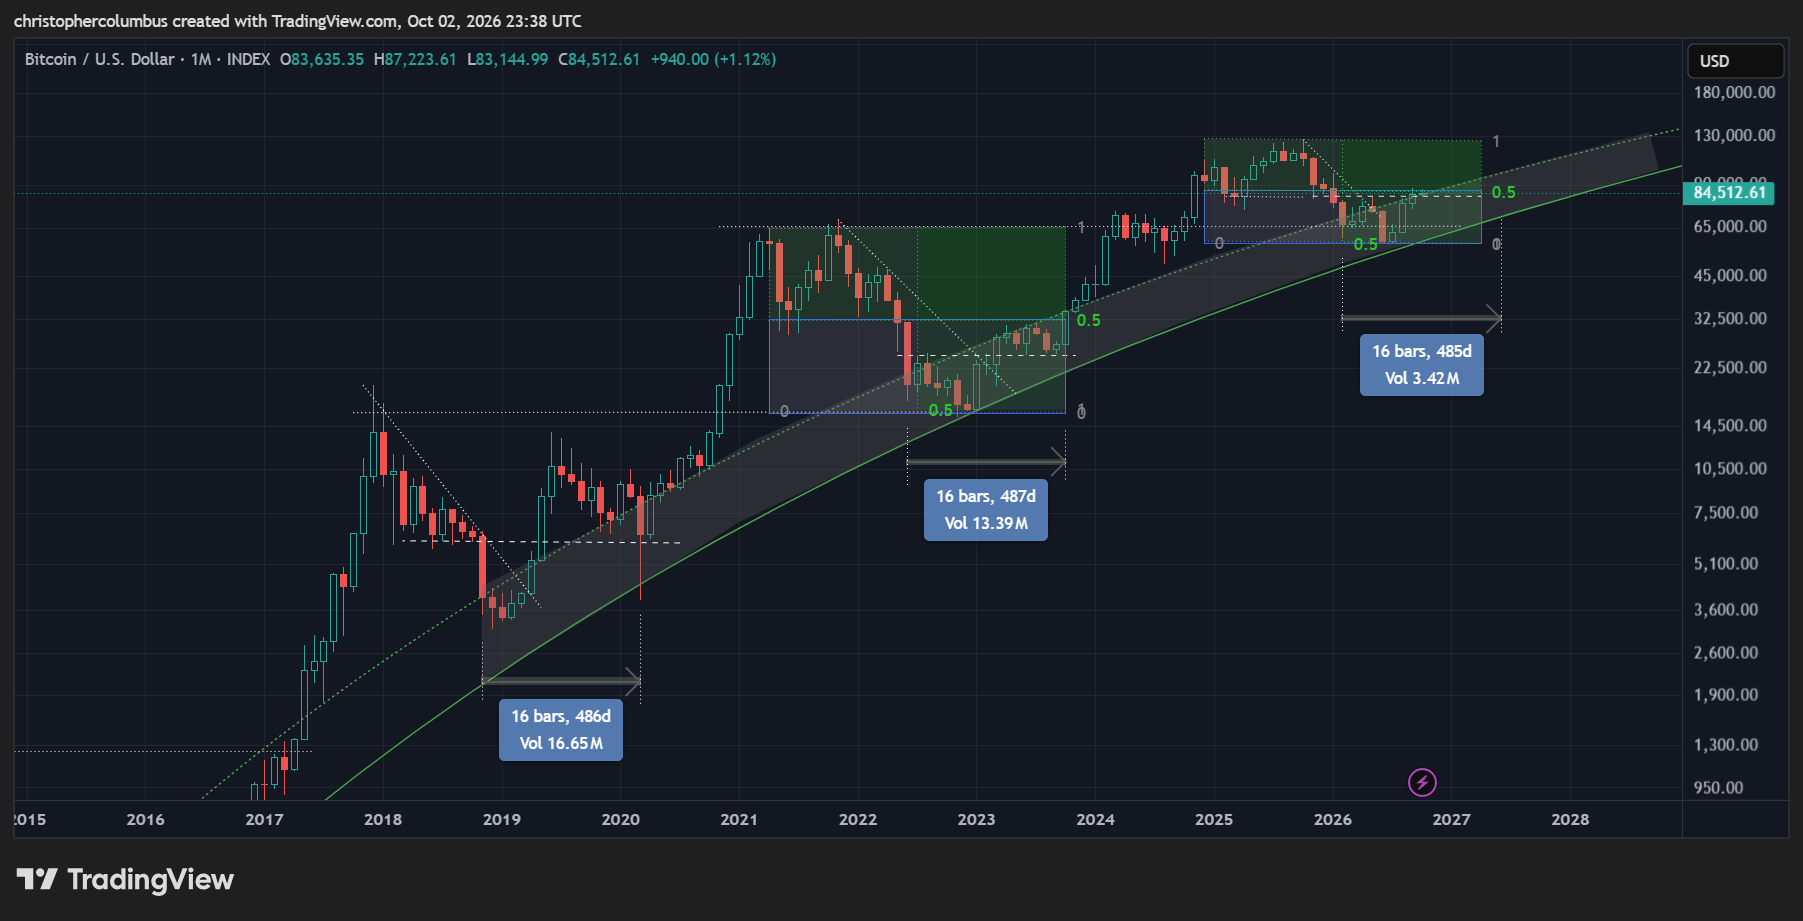
Add to this the time comparison, where price has remained in, or near, the LGC ‘buyzone’ for 16 months, and you have an outlook that would not be surprising with continued ranging… until next year.
That said, even with this relatively conservative outlook, THE bottom looks to be in. Next to this, there is of course always the possibility of a spike [similar to 2019] though likely to be less volatile.
Monthly MACD
Finally, an update on the monthly MACD, the most telling indicator in my opinion.
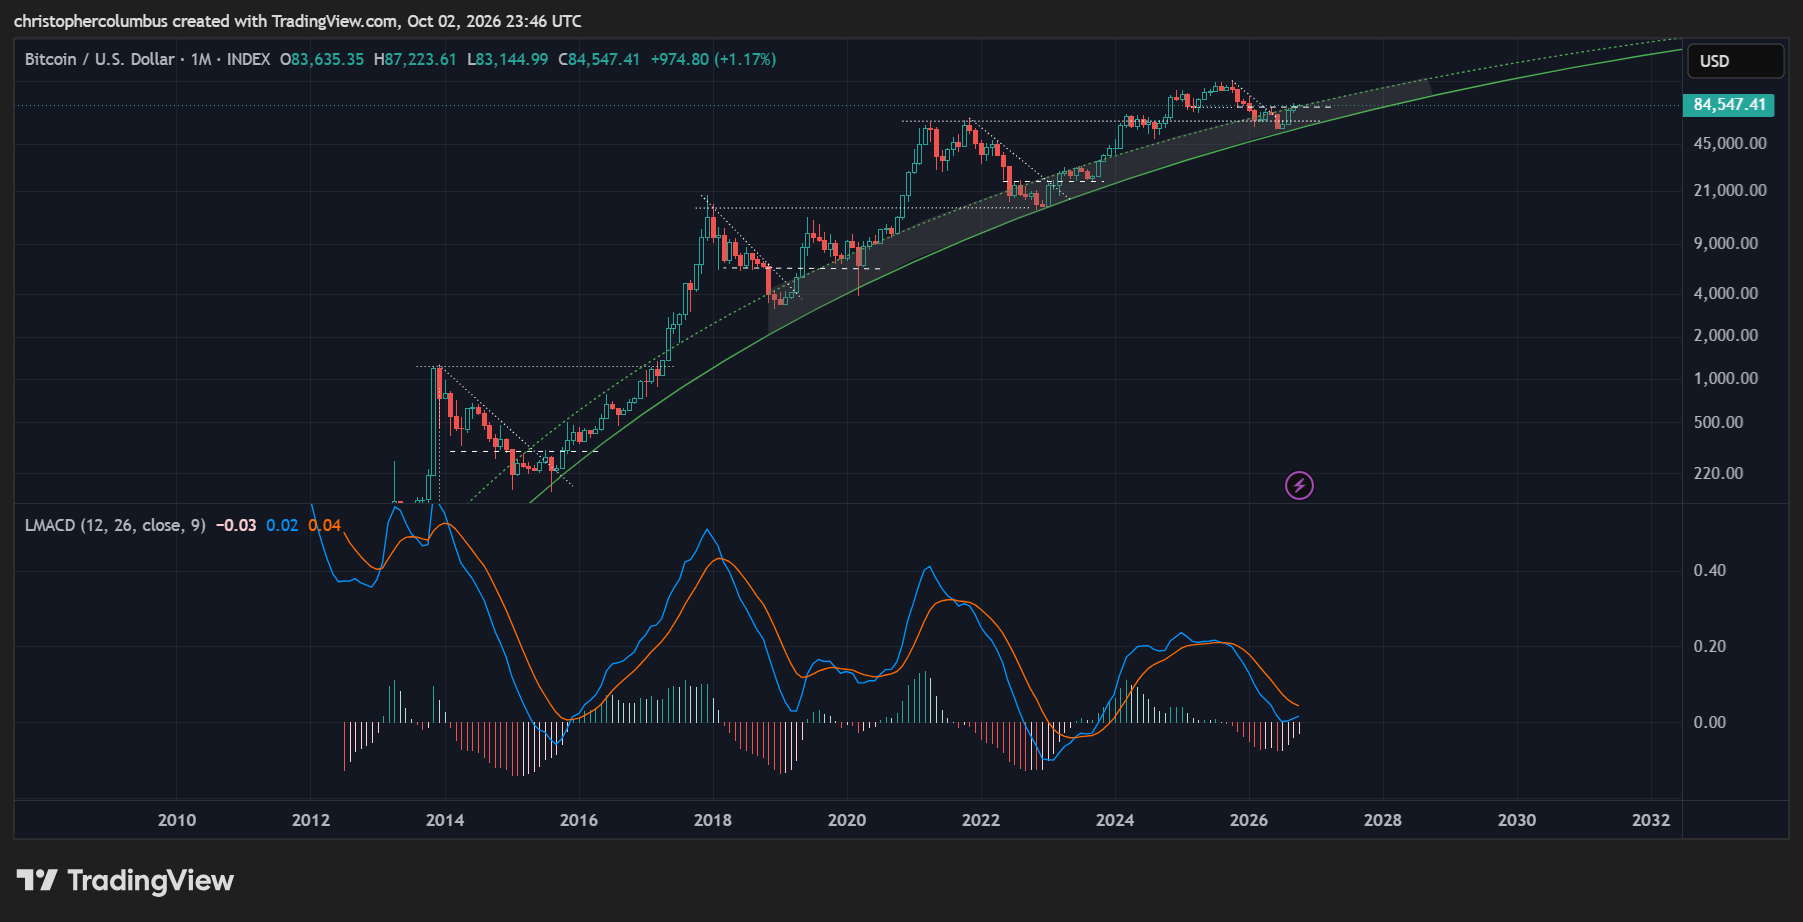
First of, overall a picture of reducing macro volatility/ price discovery as the volatility of subsequent cycles reduces. Next the monthly MACD itself retracing to the zero-line, and bouncing off it. And then the MACD about to re-cross its signal bullishly.
All in all, technically a solid outlook going forward.
Until next time,
Stay [relatively] safe out there,
Dave the Wave.