
BTC Update
Dear Readers,
Four months back now, I was posting on the idea of an extended reverse head and shoulders as a confirmation of the cyclical bottom, and in turn a base from which new local highs were to develop as follows:
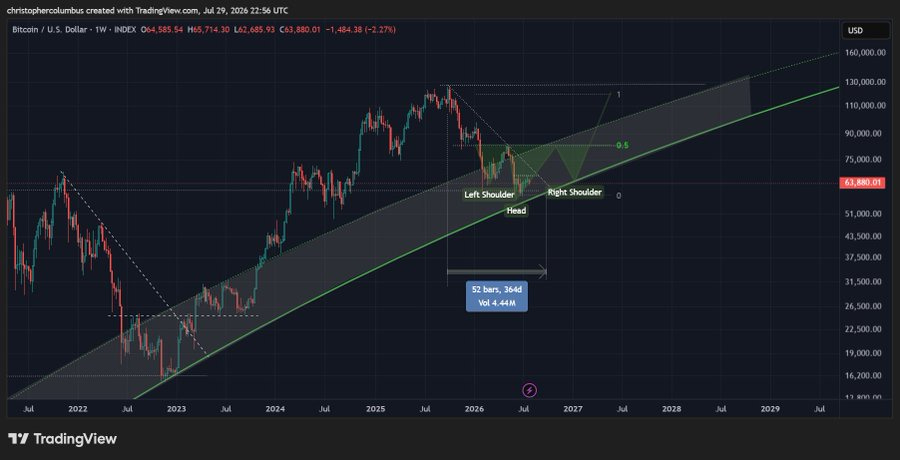
Price was then in the low 60K range, and we subsequently saw that solid move to the neckline of 82K… and then some more as we see on the updated chart below:
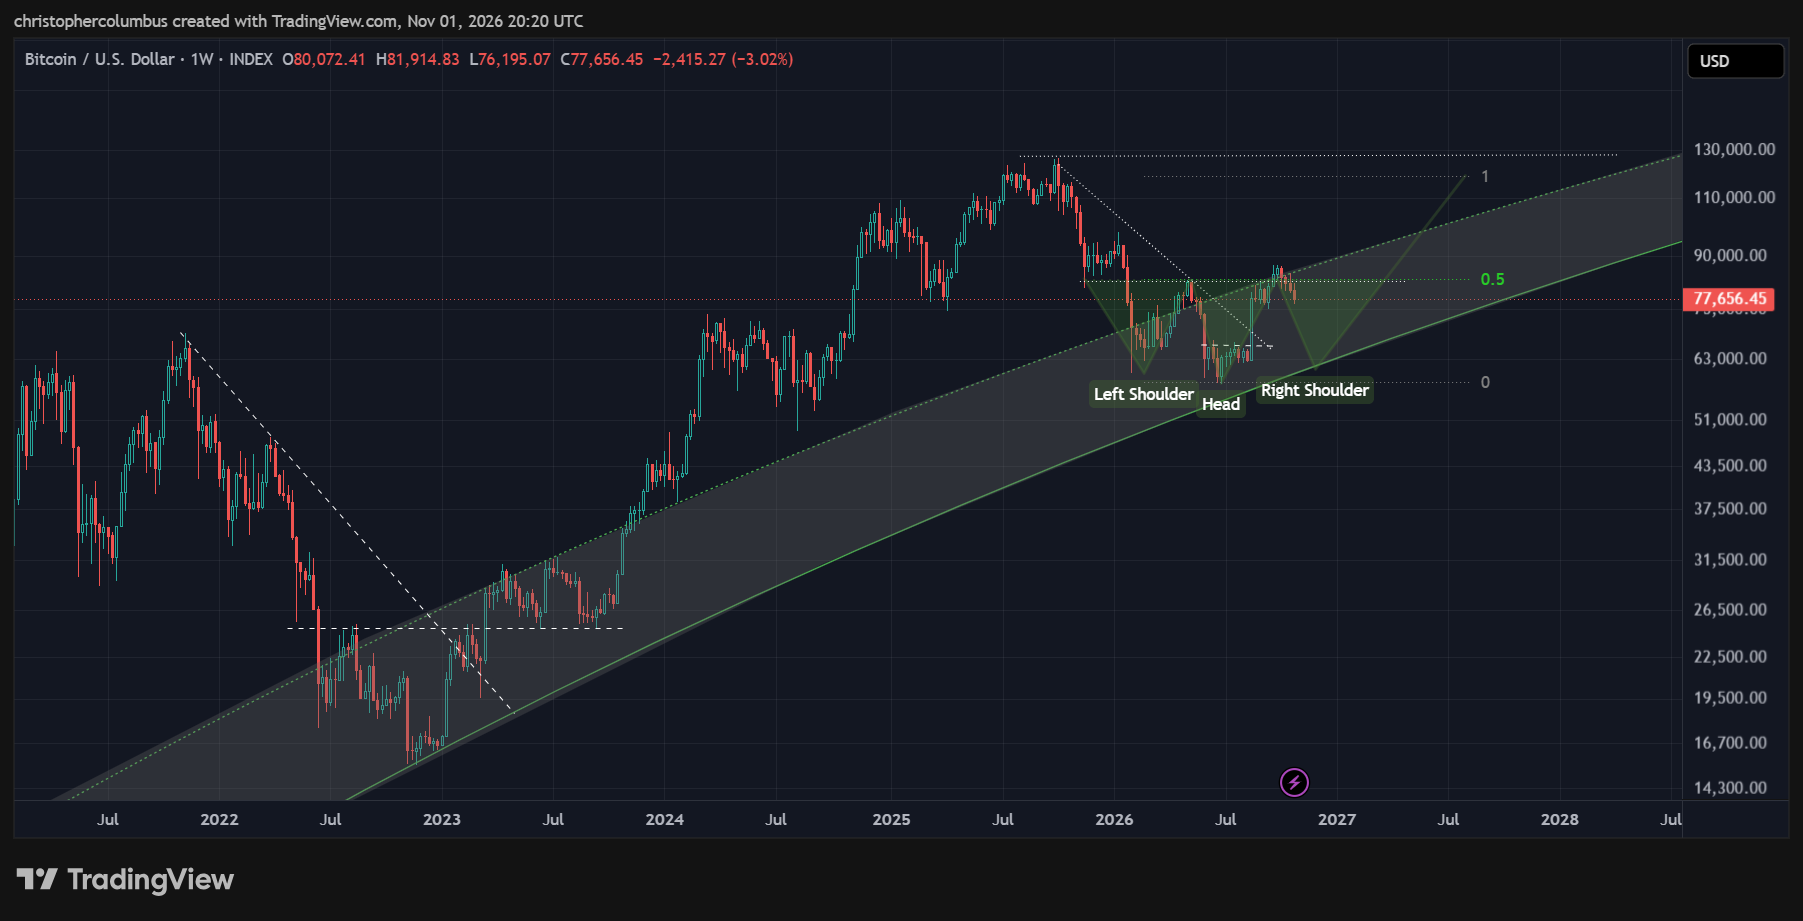
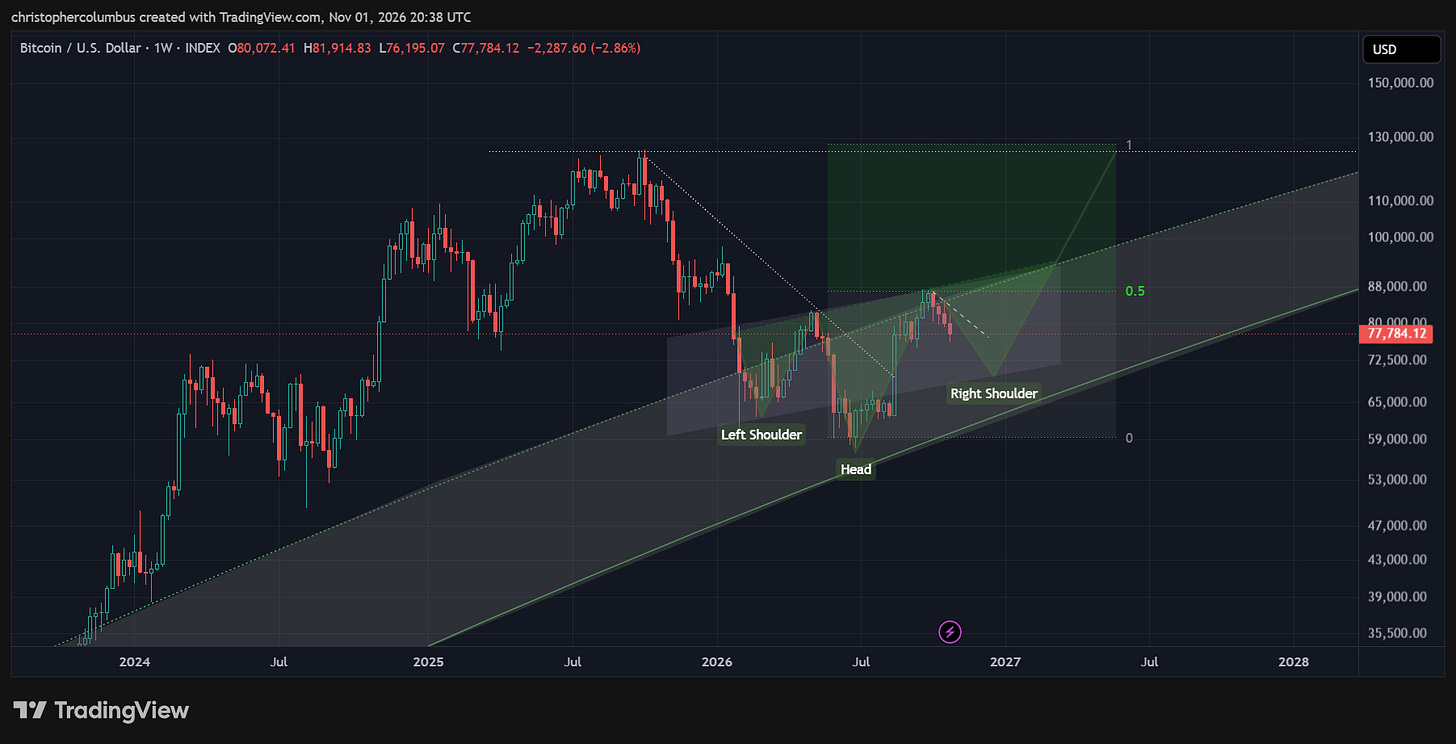
Given that price has not substantially broken through the neckline, where it has now spent a few weeks below it, I think it’s reasonable to say that this bottoming pattern is back on the table. It could now be seen as a skewed reverse head and shoulders, and where the neckline runs more relative to the base of the LGC [Logarithmic Growth Curve] as follows:
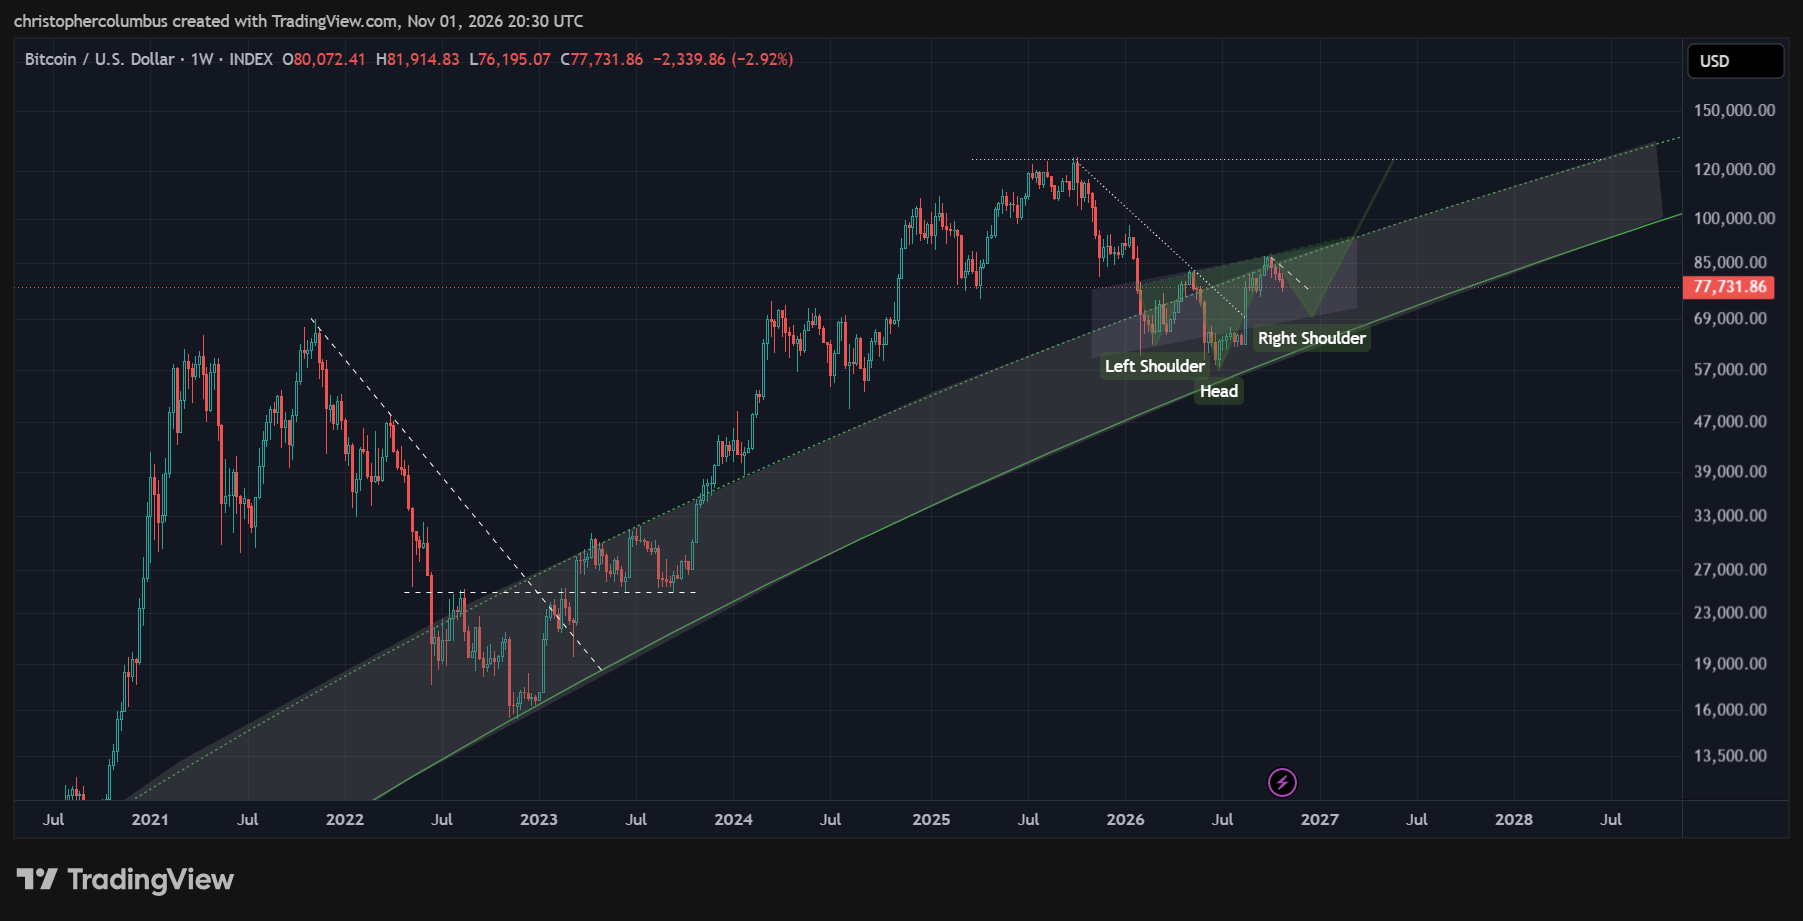
Should such a formation play out, price would consolidation over the period of a month or so to 70K. While it would allow a brief dip back into the 60K range, the 70K range is likely to hold… building the platform for higher prices over the course of the first quarter next year. Interestingly, the fib extension of this formation would also have prices testing and meeting resistance [in the shorter/ medium term] at previous all-time-highs.
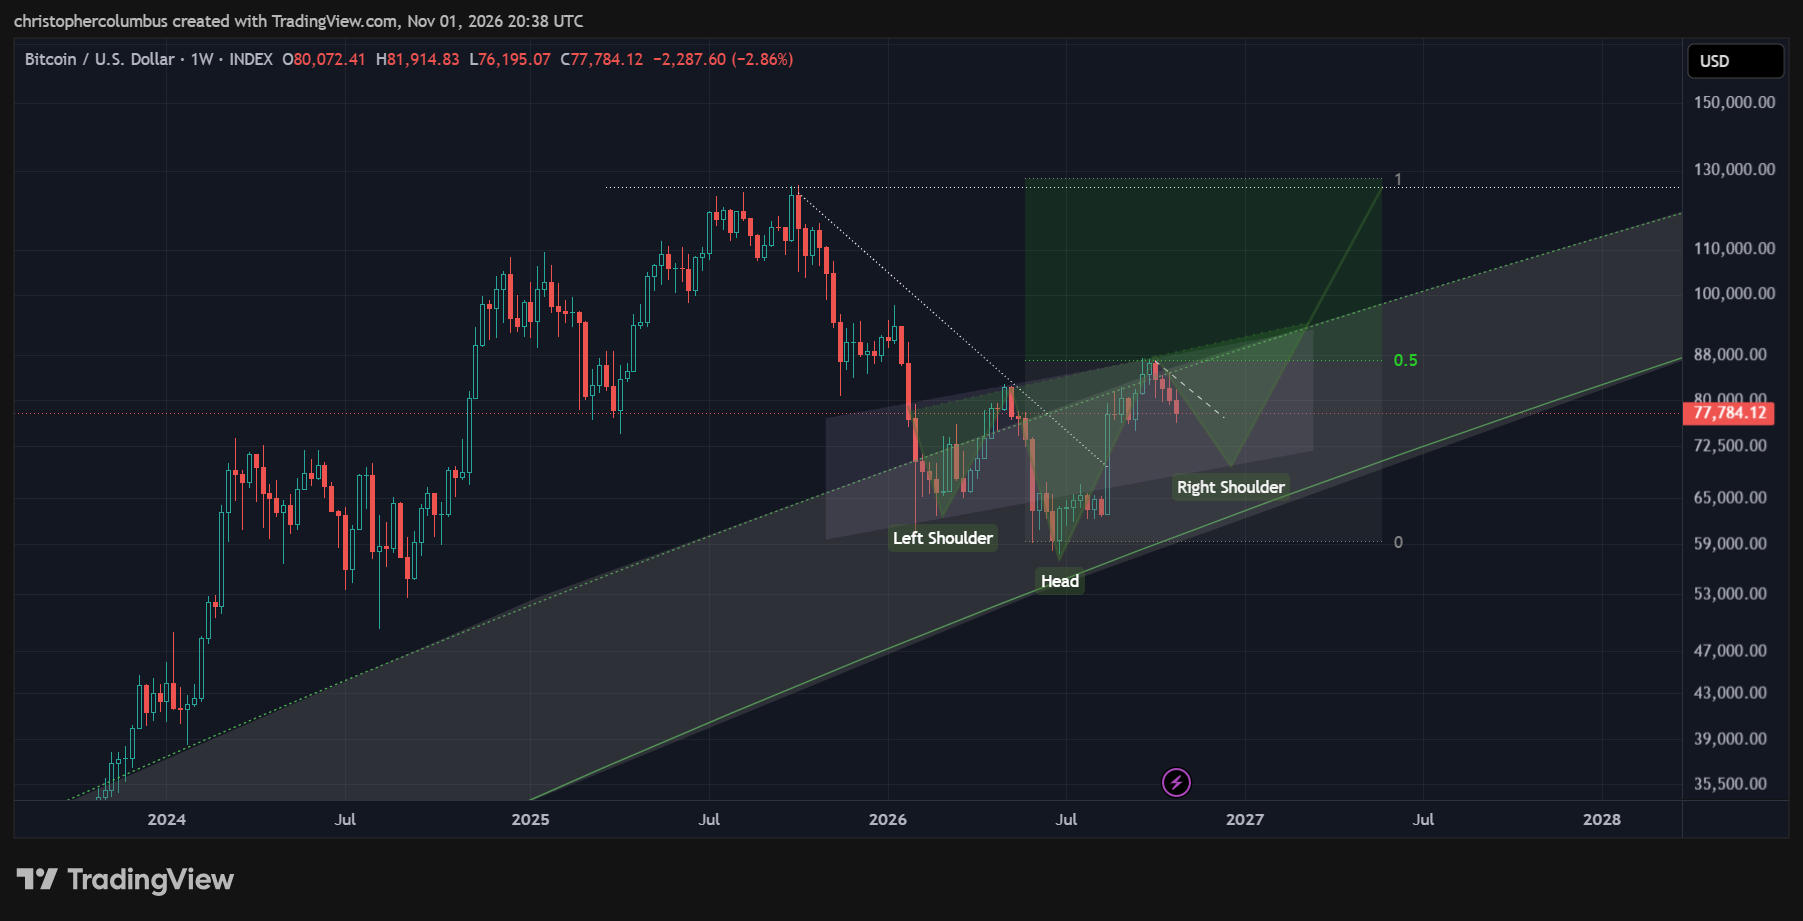
Technically speaking, you couldn’t have a better set-up and scenario than this. And given that the market is increasingly mature, it makes sense to consider technical patterns such as this as being increasingly applicable to the price action.
Weekly MACD
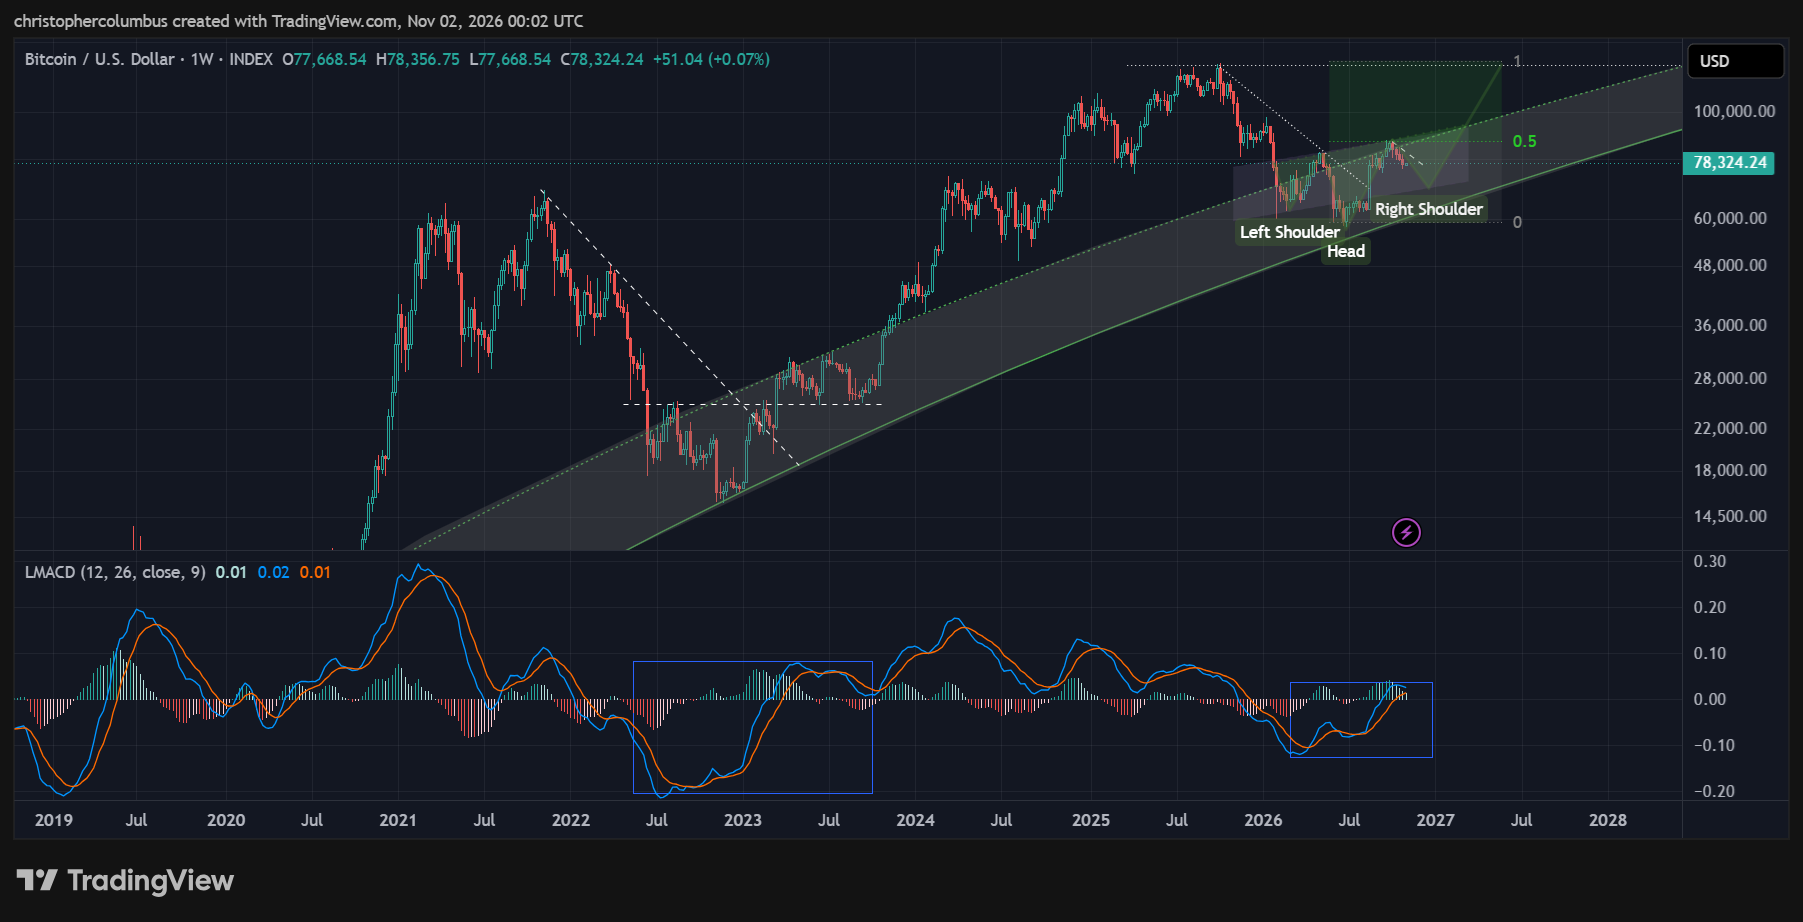
On the weekly MACD, we see both reduced volatility and a similar pattern emerging to the previous base that was formed. Previously, the MACD dipped a lot lower just as it had reached higher, and yet a similar pattern is forming - the MACD bullishly through the zero-line and then turning to consolidate to that line before a subsequent move up.
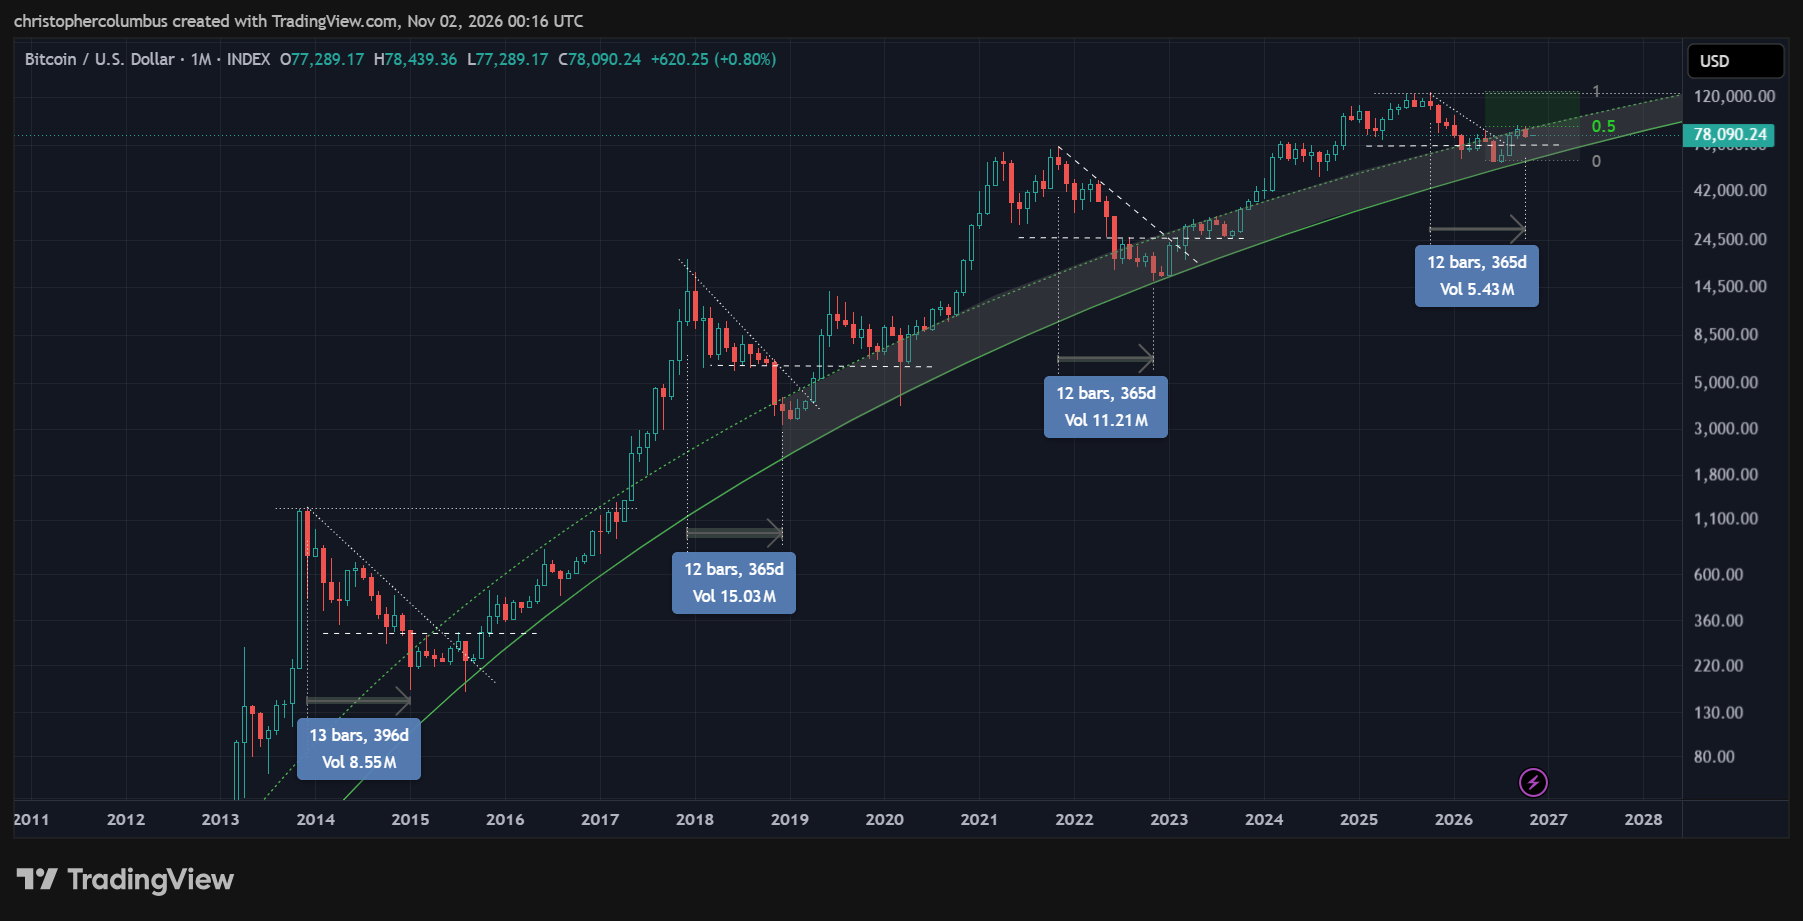
Finally. a reminder that the previous pattern of a 12 month correction has been completed…. not to mention the extended period of time within the LGC ‘buyzone’.
What may turn out interesting about this correction, if indeed a right shoulder is to be formed, is that THE low could well have ended up preceding that 12 month period.
Until next time,
Stay [relatively] safe out there,
Dave the Wave.