
Crunch Time for the Logarithmic Growth Curve
Dear Readers,
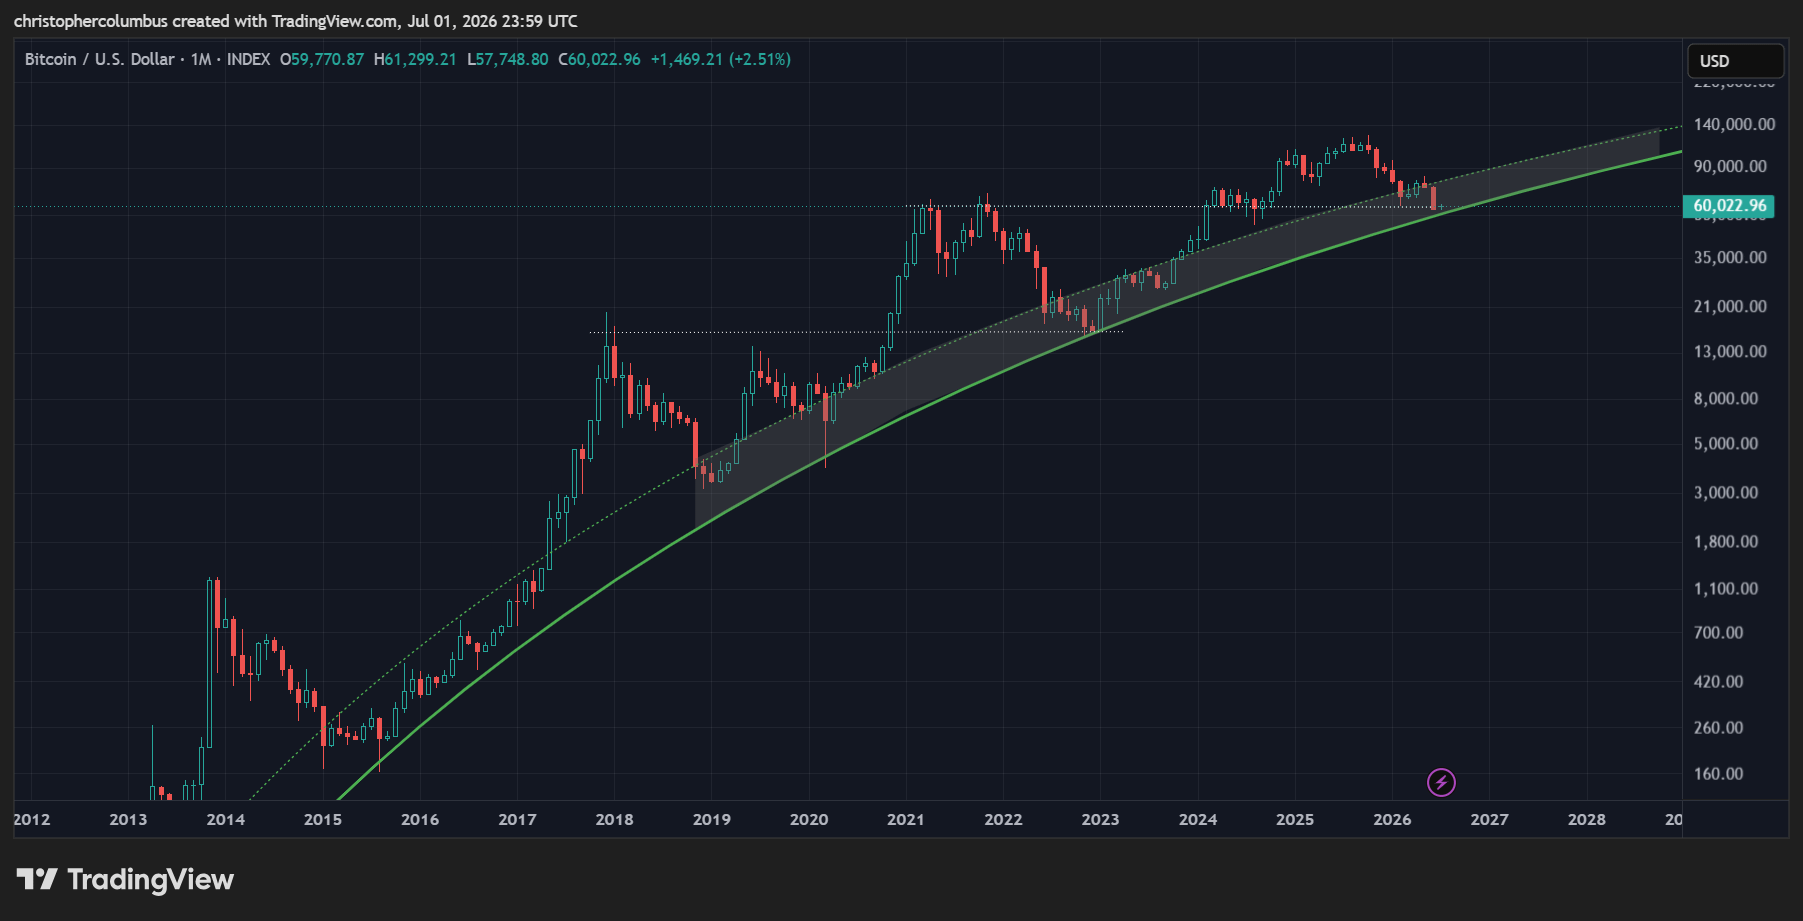
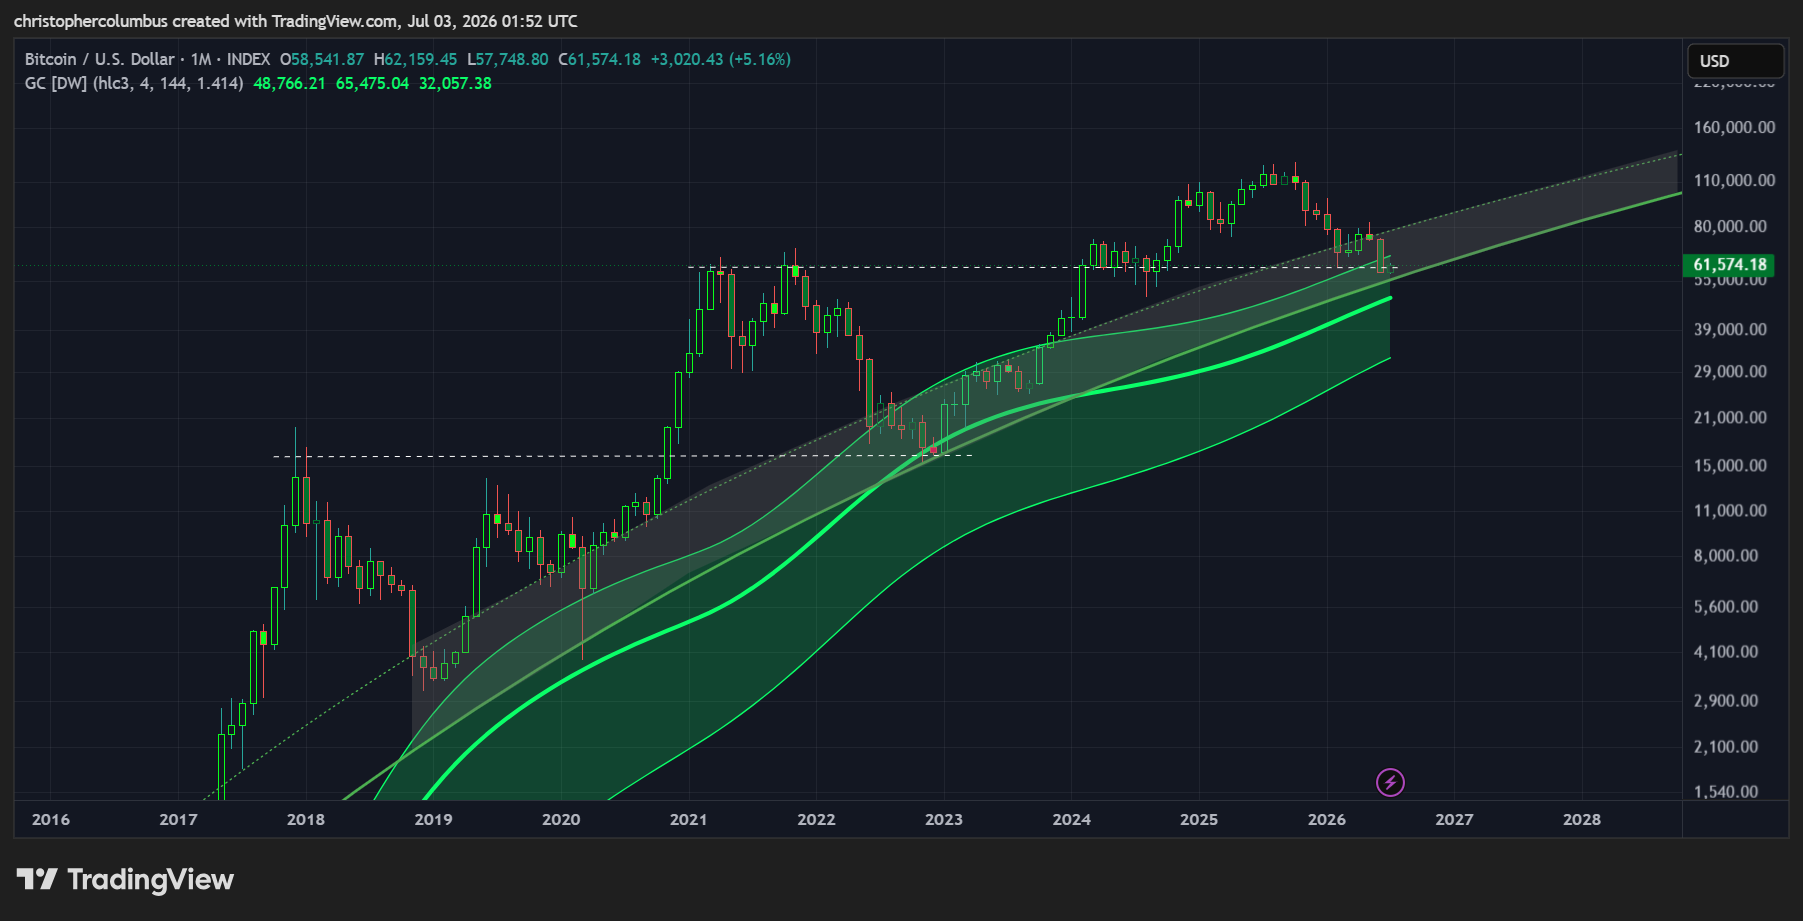
The price of Bitcoin is now on, or very near, the Logarithmic Growth Curve [LGC]. Since the drawing of this curve back in 2018, it has been thoroughly tested twice before - first in March 2020, and again in November 2022.
This time round, near 4 years later since 2022, price is 3.5x higher while similarily tracking through the lower shaded zone over multiple months [the ‘buy zone’]. Of course, sentiment has always been lowest during these periods, but a rational model, that has performed well since 2018, gives us reason for confidence.
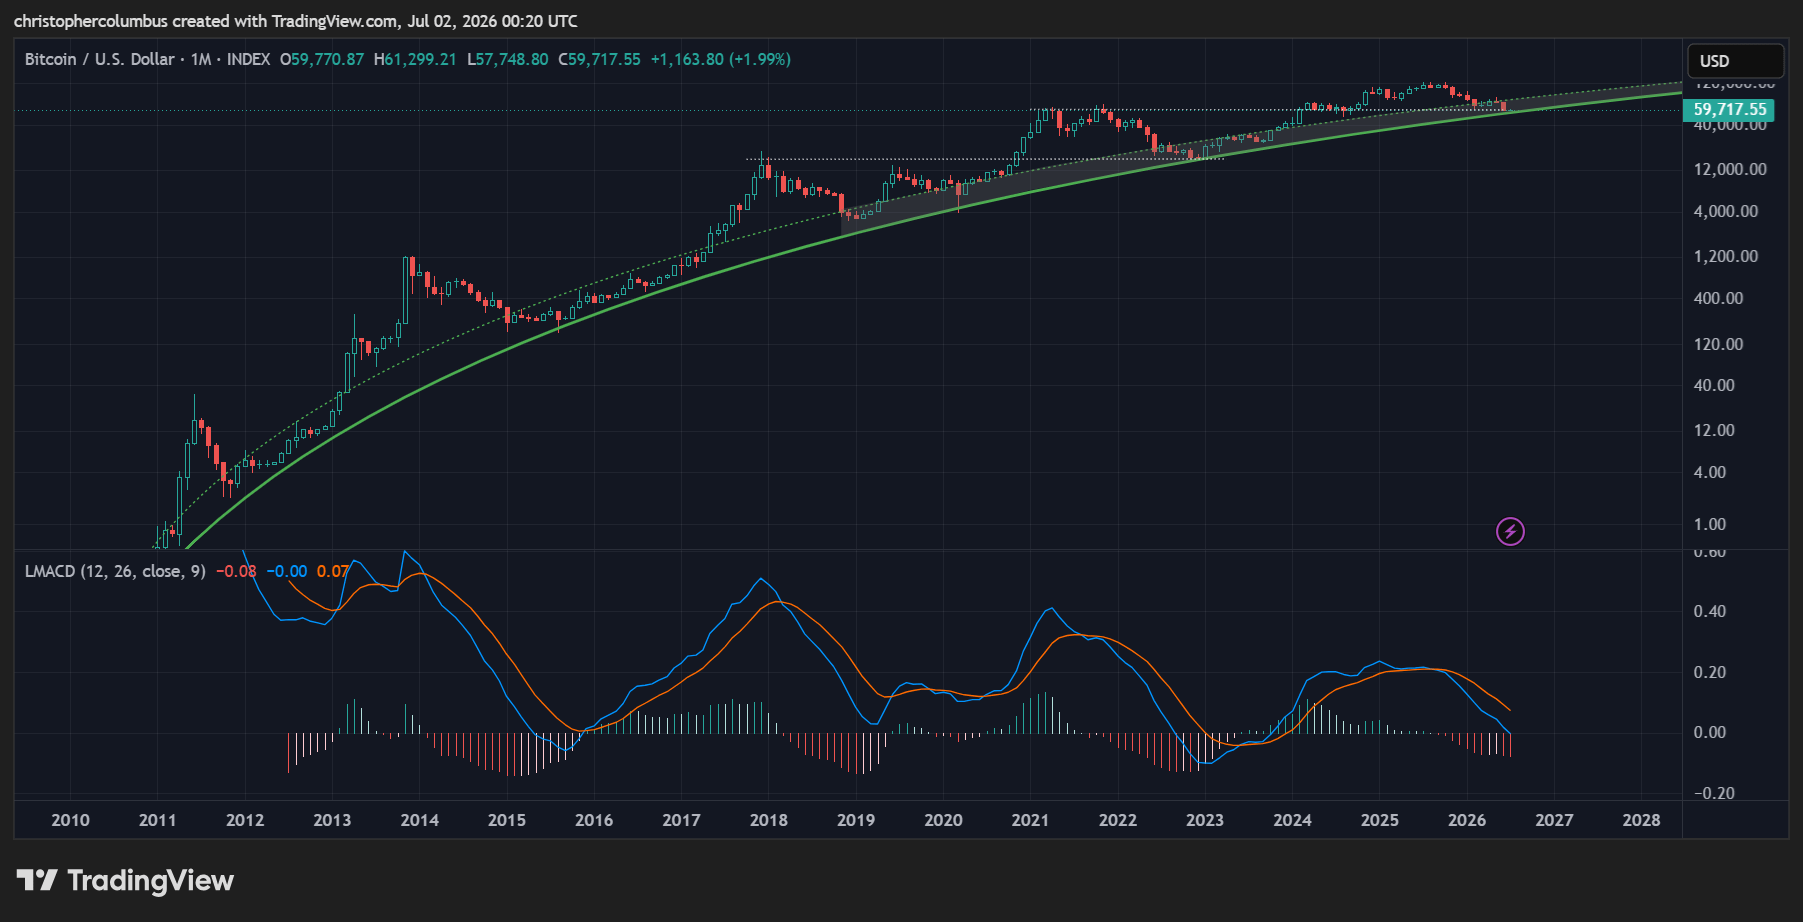
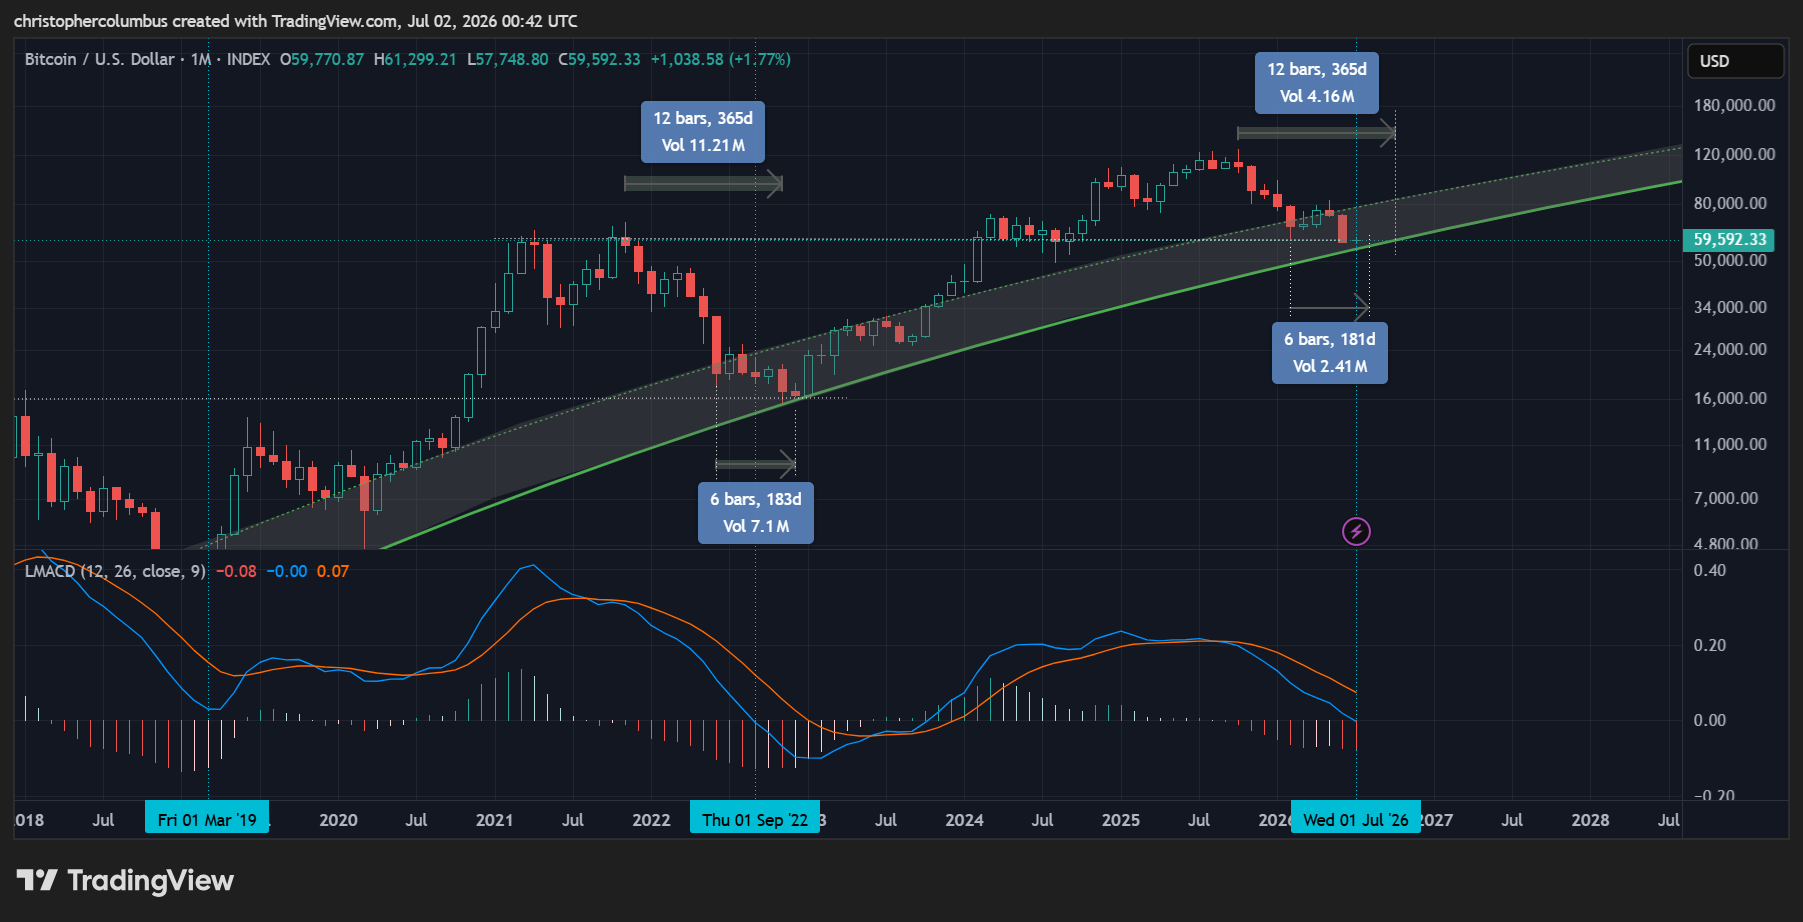
Also of significance here is that the monthly MACD has finally rebooted to the zero-line. This suggests the turnaround in price is due shortly.
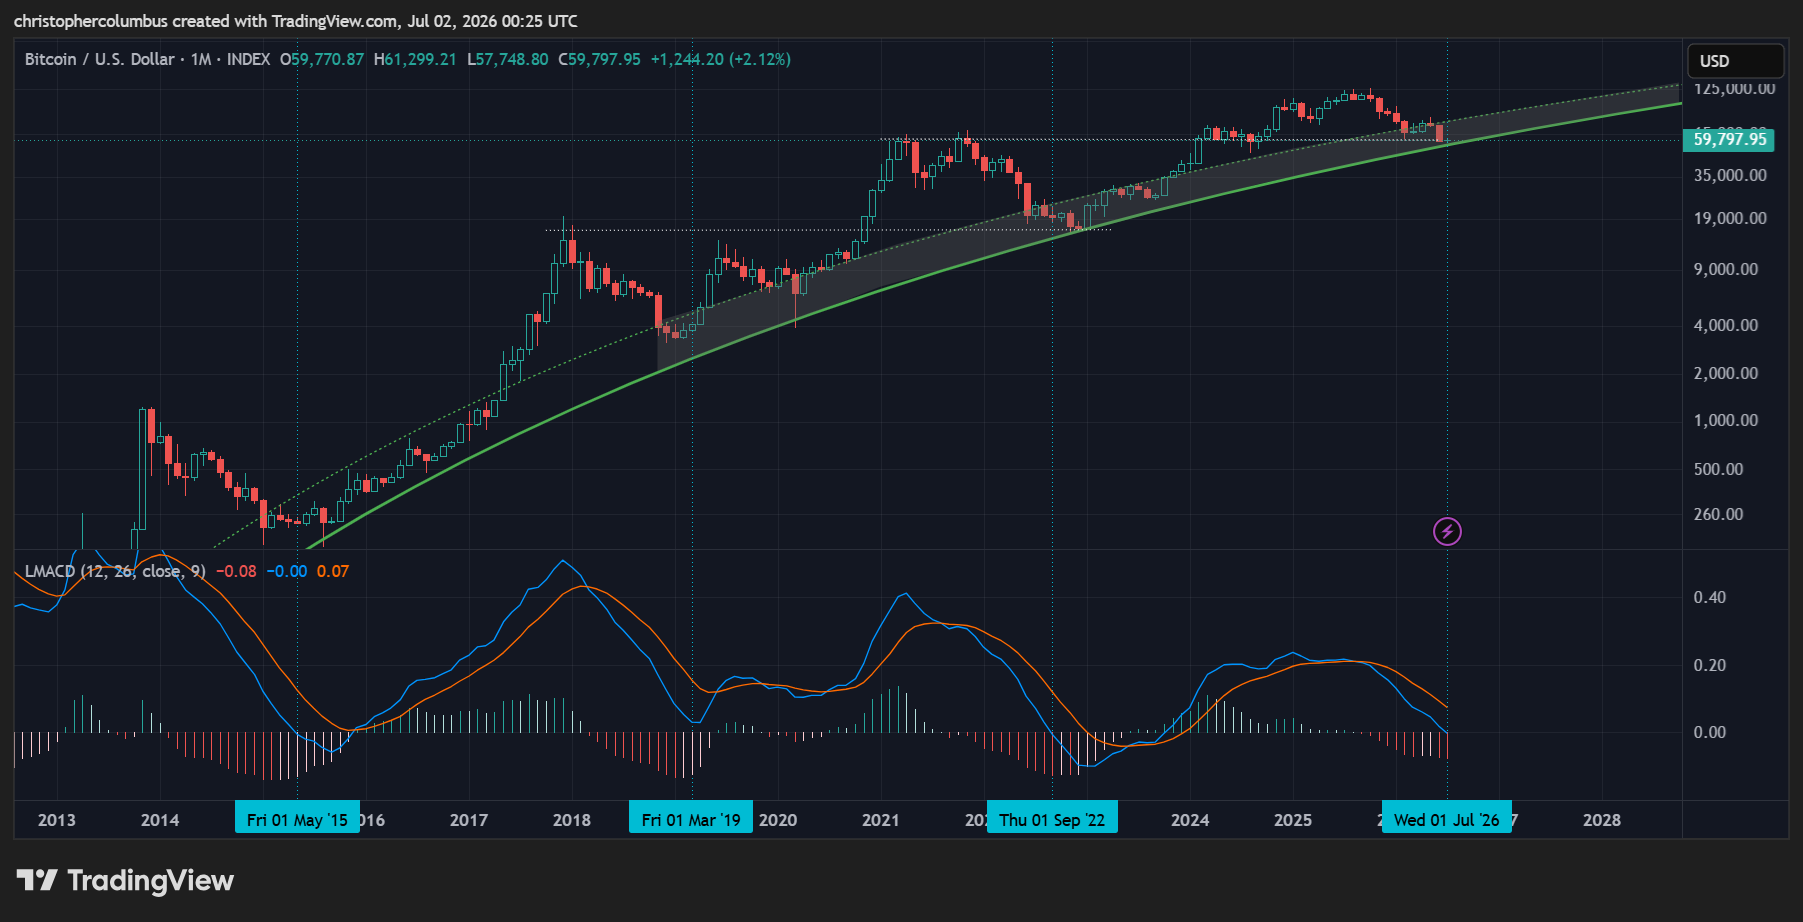
If we compare the previous times the MACD hit the zero-line, we can see that 3 months later price began tracking up [the bounce of March 2019 precluded the MACD hitting the zero-line].
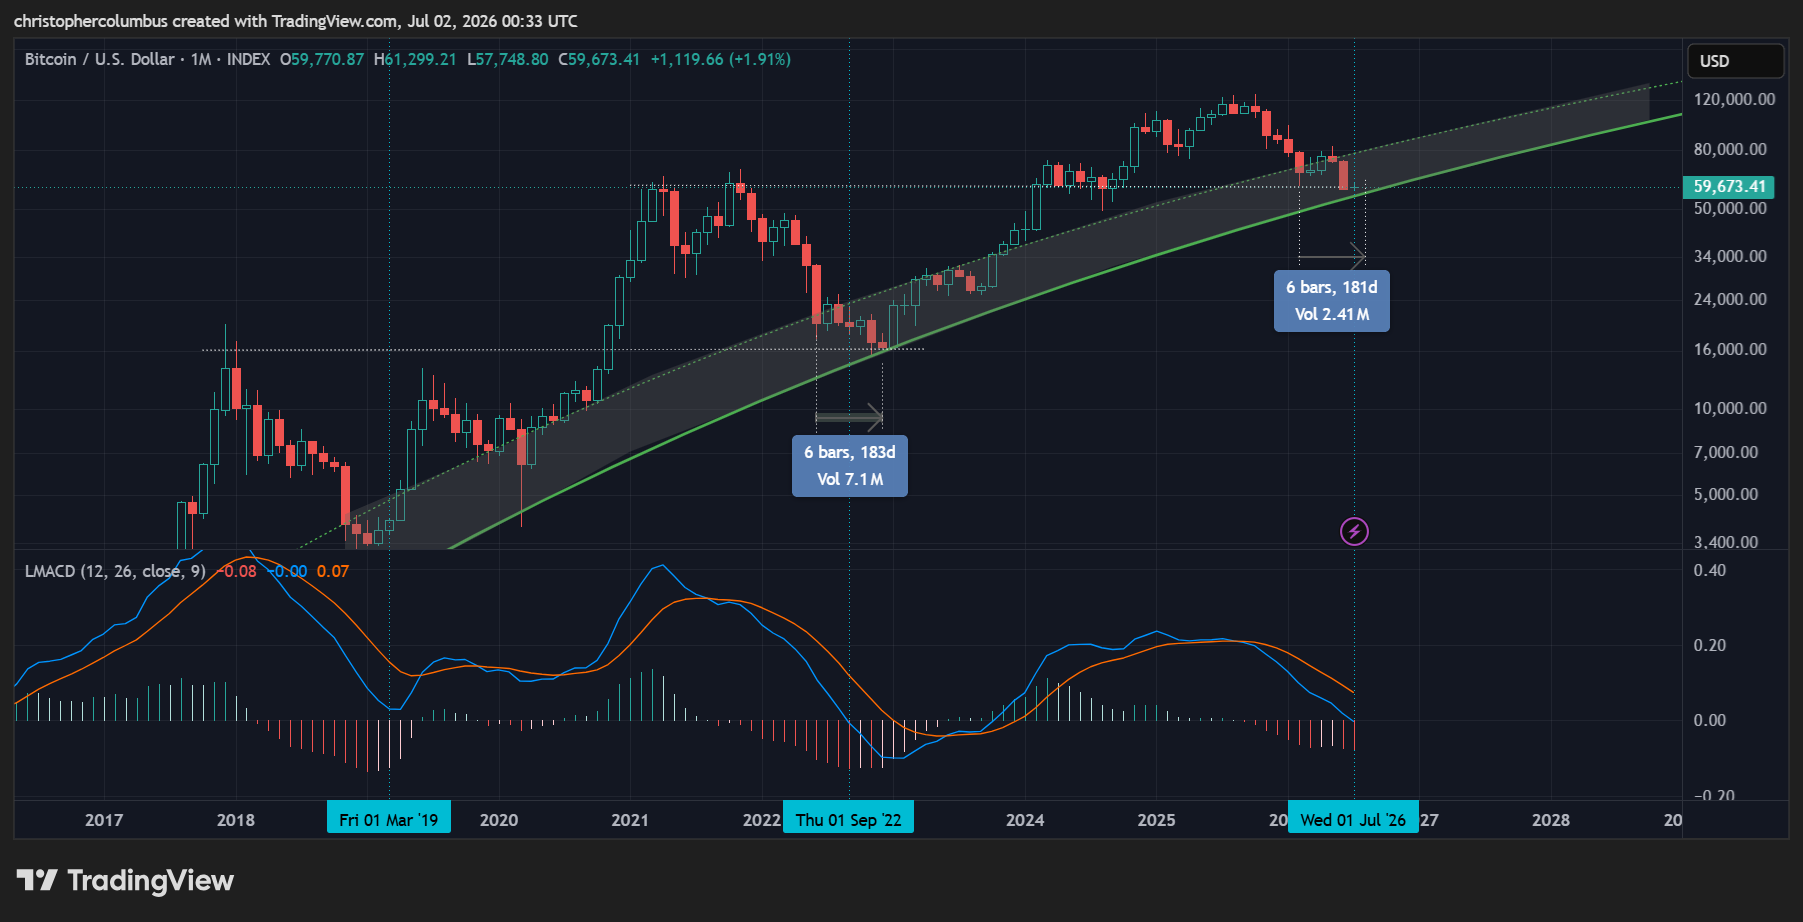
Add to this the 6 month sideward range in the ‘buy zone’ [and a similar large move down last month], and I wouldn’t be surprised to see a move up within a couple of months. If instead one were to apply the rule of a 12 month correction, October would be the month of the expected turnaround.
Gaussian Channel
Another indicator I’ve often followed over the years has been the Gaussian Channel.
“The Gaussian Channel is a statistical technical indicator that creates a super-smoothed moving average centerline flanked by dynamic upper and lower bands. It filters out market noise to help traders identify trend directions, support/resistance levels, and mean reversions across stocks, forex, and crypto.”
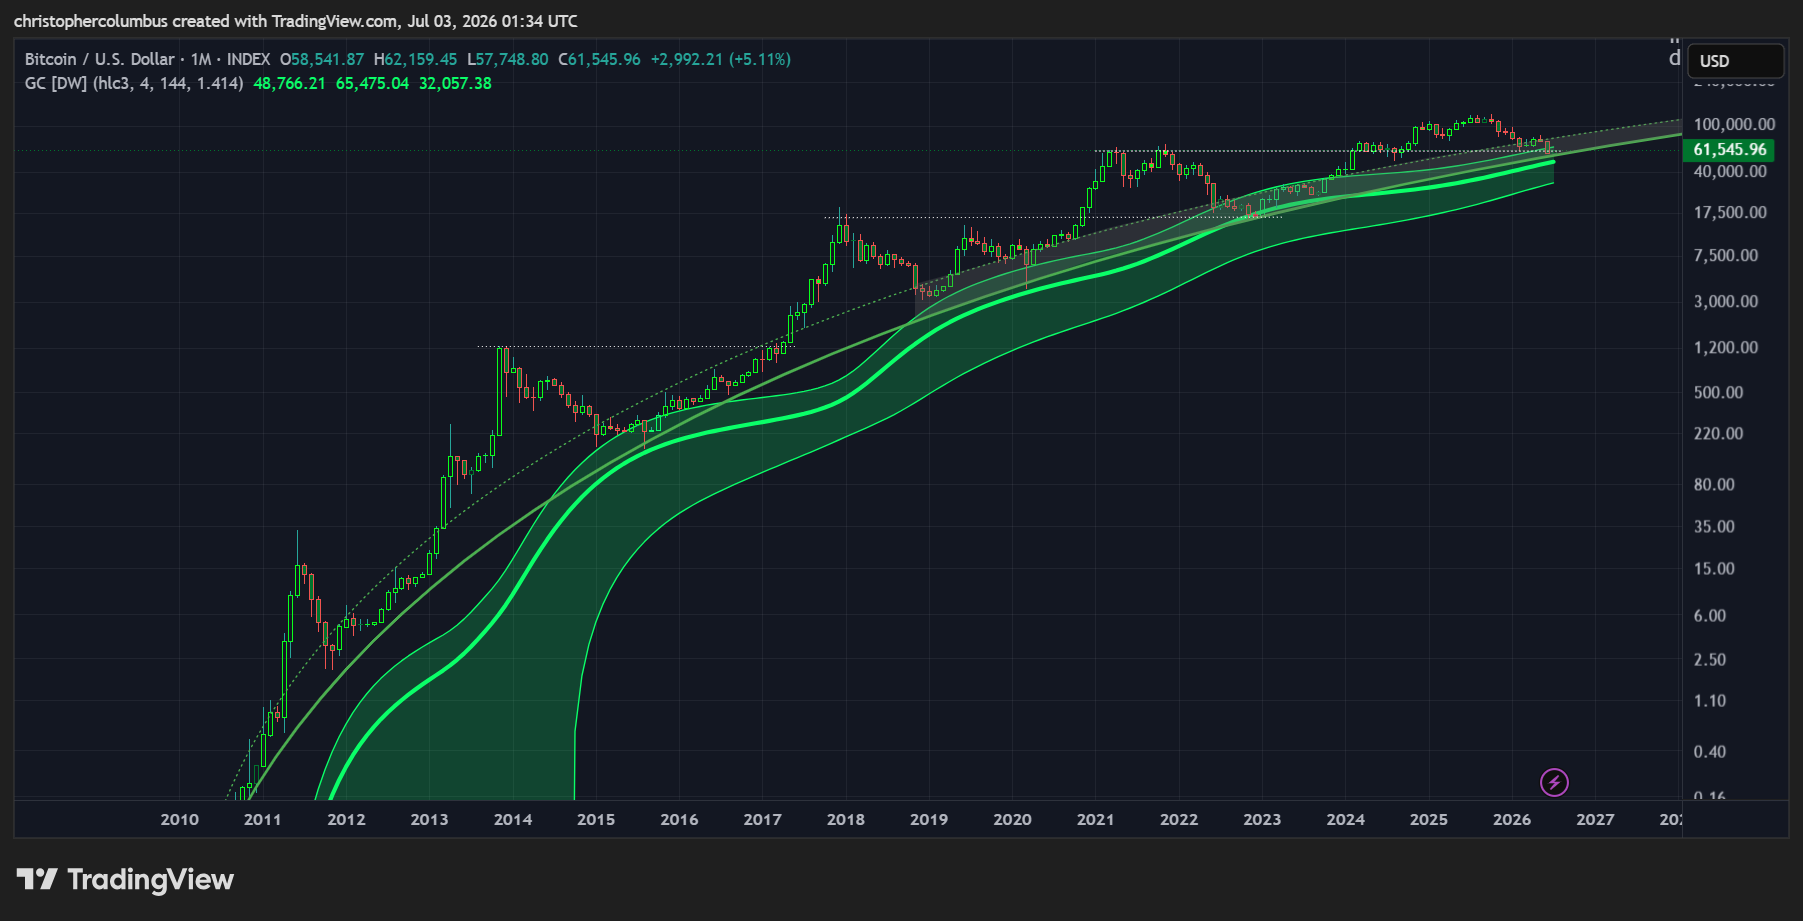
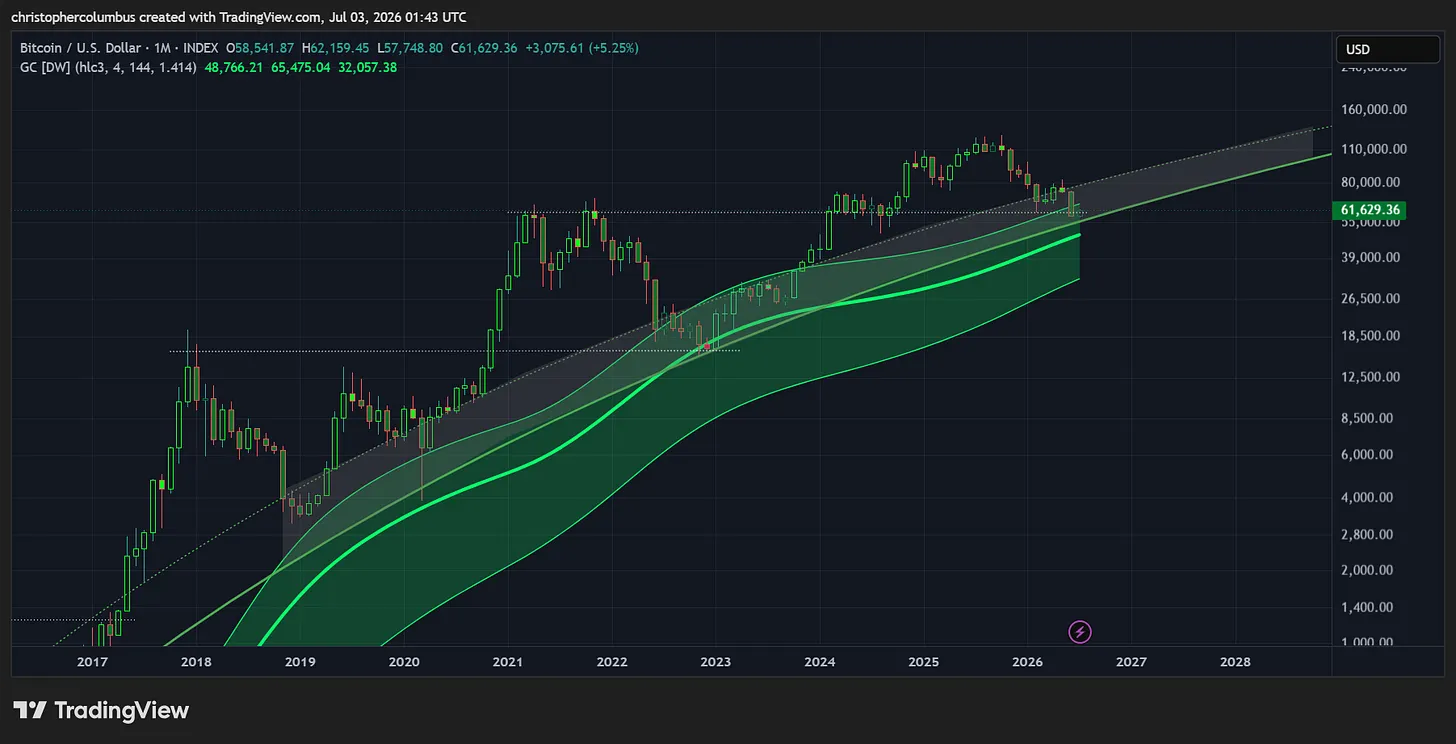
Just like the lower band of the LGC [the ‘buy zone], the upper band of the Gaussian Channel has functioned well over the multi-year cycles as long-term support. Buying in this area has performed as a longer-term investment strategy. Of interest is that the centreline of the Gaussian Channel is increasingly lining up with the LGC curve baseline.
Zooming in a little, we can see that price has finally dipped into the upper band of the Gaussian while also being in the ‘buy zone’ of the LGC. The two indicators serve to corroborate each other in suggesting that support is to be found in this price area over the coming few months. Currently, the base of the LGC sits at 55K while the centreline of the Gaussian is at 49K.
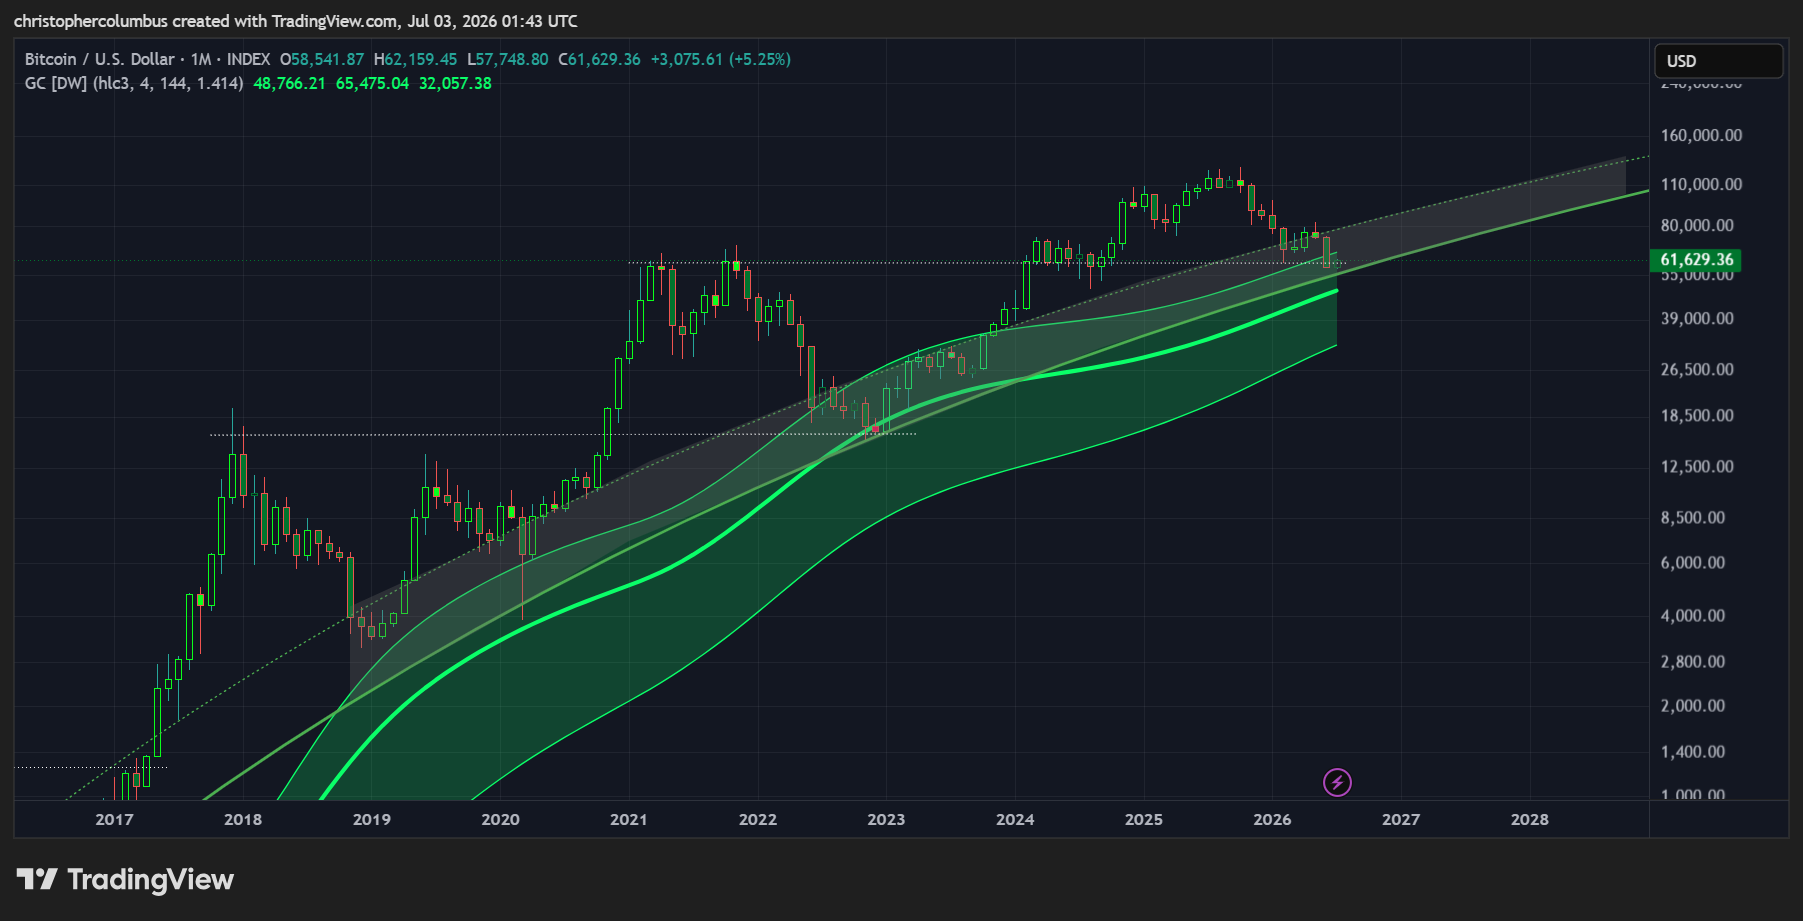
Add to this the previous peak come support, and you have a ‘trifecta’ of technical support in this area. All things considered, while there is no such thing as certainty about the future, I think we can be quietly confident here on BTC price going forward. Those with a reasonable exposure to BTC should not be overly concerned in my opinion… while those with no exposure could consider buying in tranches over a period of time.
Until next time,
Stay [relatively] safe out there,
Dave the Wave.