DEFCON Article 3
Dear Readers,

With continued weakness in the market, not to mention the liquidation event that has just occurred, it’s time to revisit the DEFCON system. This was put together two months back in order to manage the growing negative sentiment in the market by providing technical perspective. The idea being that there would be a process involving various technicals factors, which if compounded would lead to a more risk averse approach to the Crypto space.
Of course, to clarify, this is primarily for traders of Bitcoin that have entered relatively recently, and traders of alt coins [that seek to leverage the extra volatility in trading]. It does not, or should not in my opinion, affect the longer-term holders and investors in Bitcoin. These would do well to continue to sit in my opinion, especially if positions were entered at lower levels. Also keep in mind that many traders are hedging their long positions by trading.
Market Sentiment
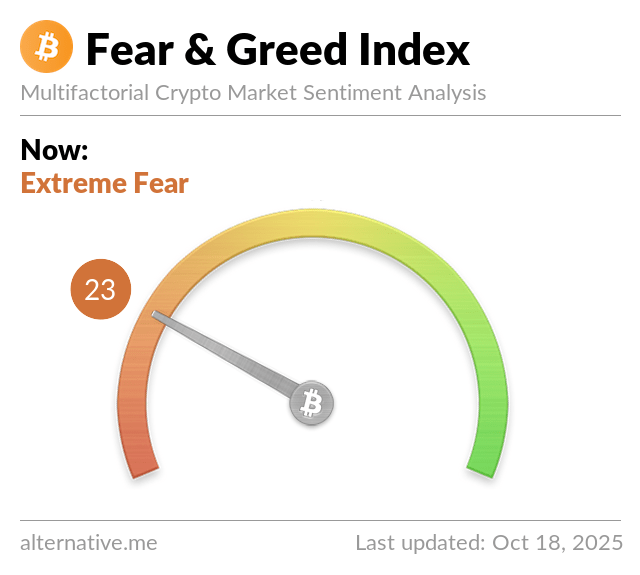
Sentiment has increasingly turned negative, but of course this can no way be thought of as definitive either way - if we look at the past, bottoms have obviously coincided with extreme negativity. That said, while the contrarian will always point this out, this does not mean to say the market can not go lower on extreme negativity. As far as market sentiment goes, the technicals can deliver us from this morass and confusion that comes from a focus on sentiment. The technicals create some objectivity, and though they can never provide certainty, they do enable us to manage risk more effectively.
Review of the ‘DEFCON’ Technicals
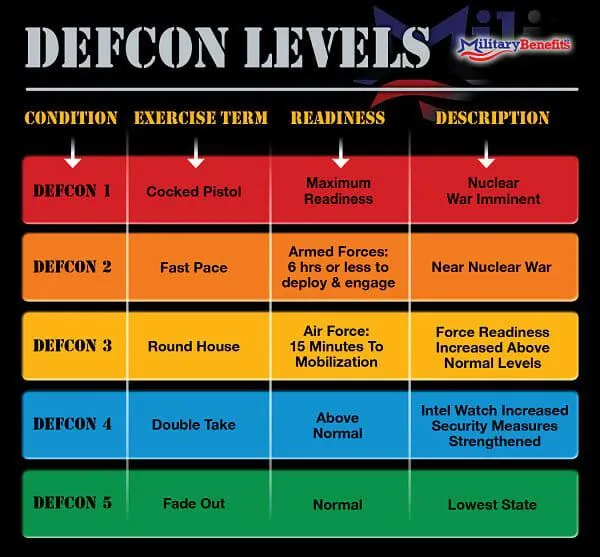
Here is the system of risk management put together 2 months back, and the parameters by which one would by steps become more risk averse to the market if they were met:
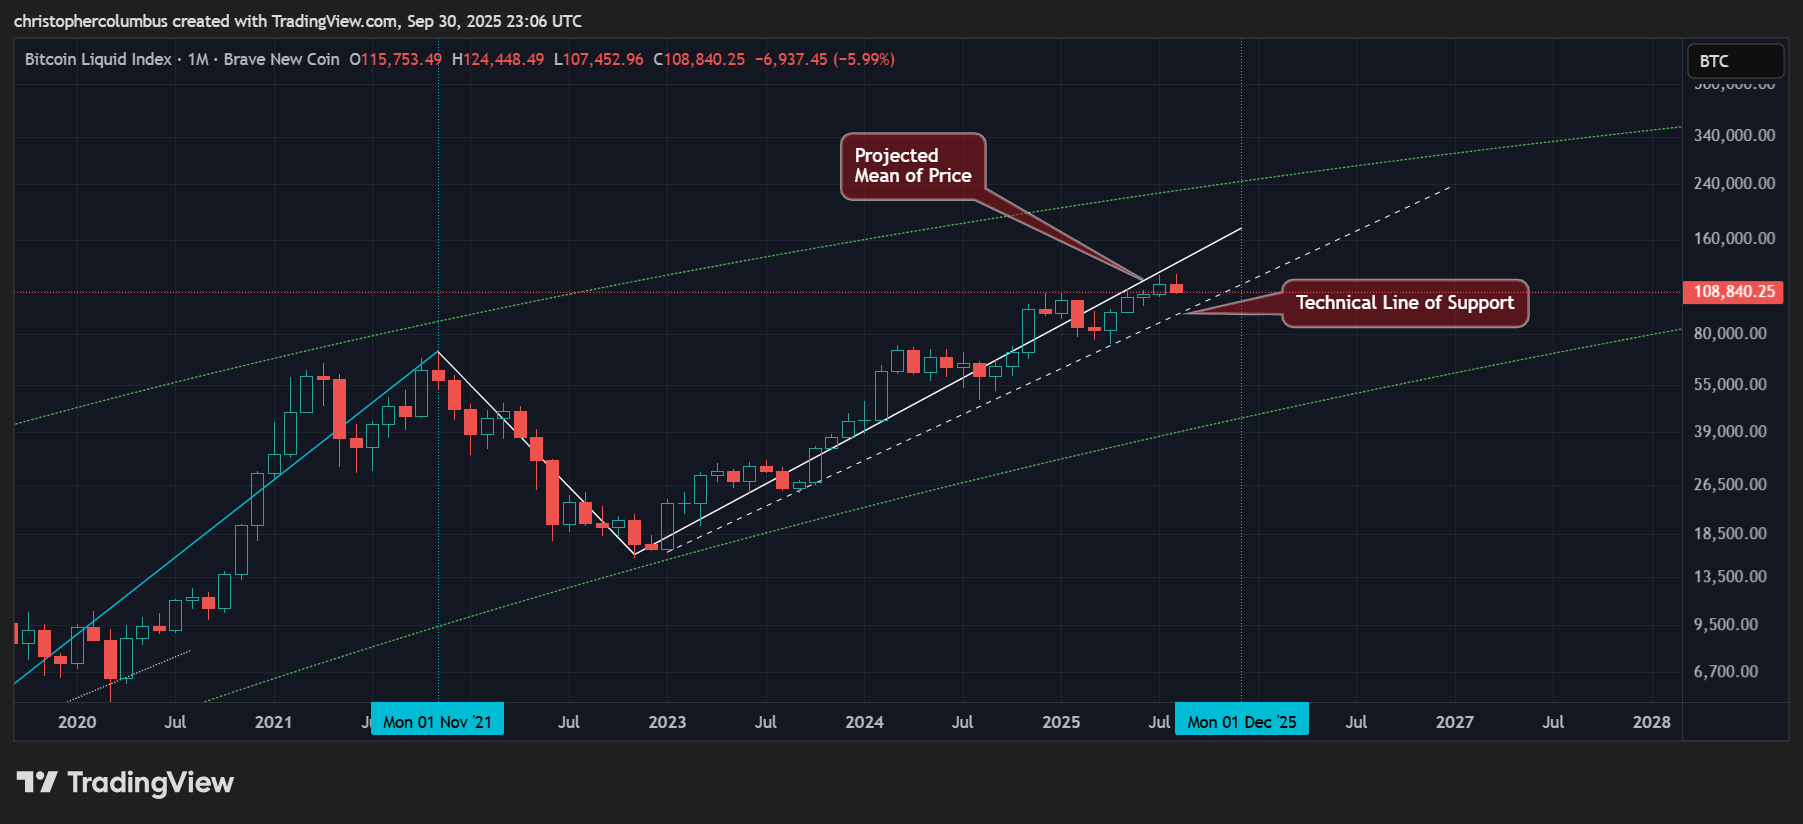
- 5 - Though a development, is nothing really to write home about. The break of the steepest multi-month upward trend while with horizontal support nearby
- 4 - Price through multi-month resistance come support
- 3 - Price through multi-year diagonal support. And here alarm might begin to register [signified by the larger 3 on the chart], and where price would be through the 100k mark
- 2 - Price falling out out of the wider multi-year channel
- 1 - Price finally making a lower low on the medium/ multi-month timeframe
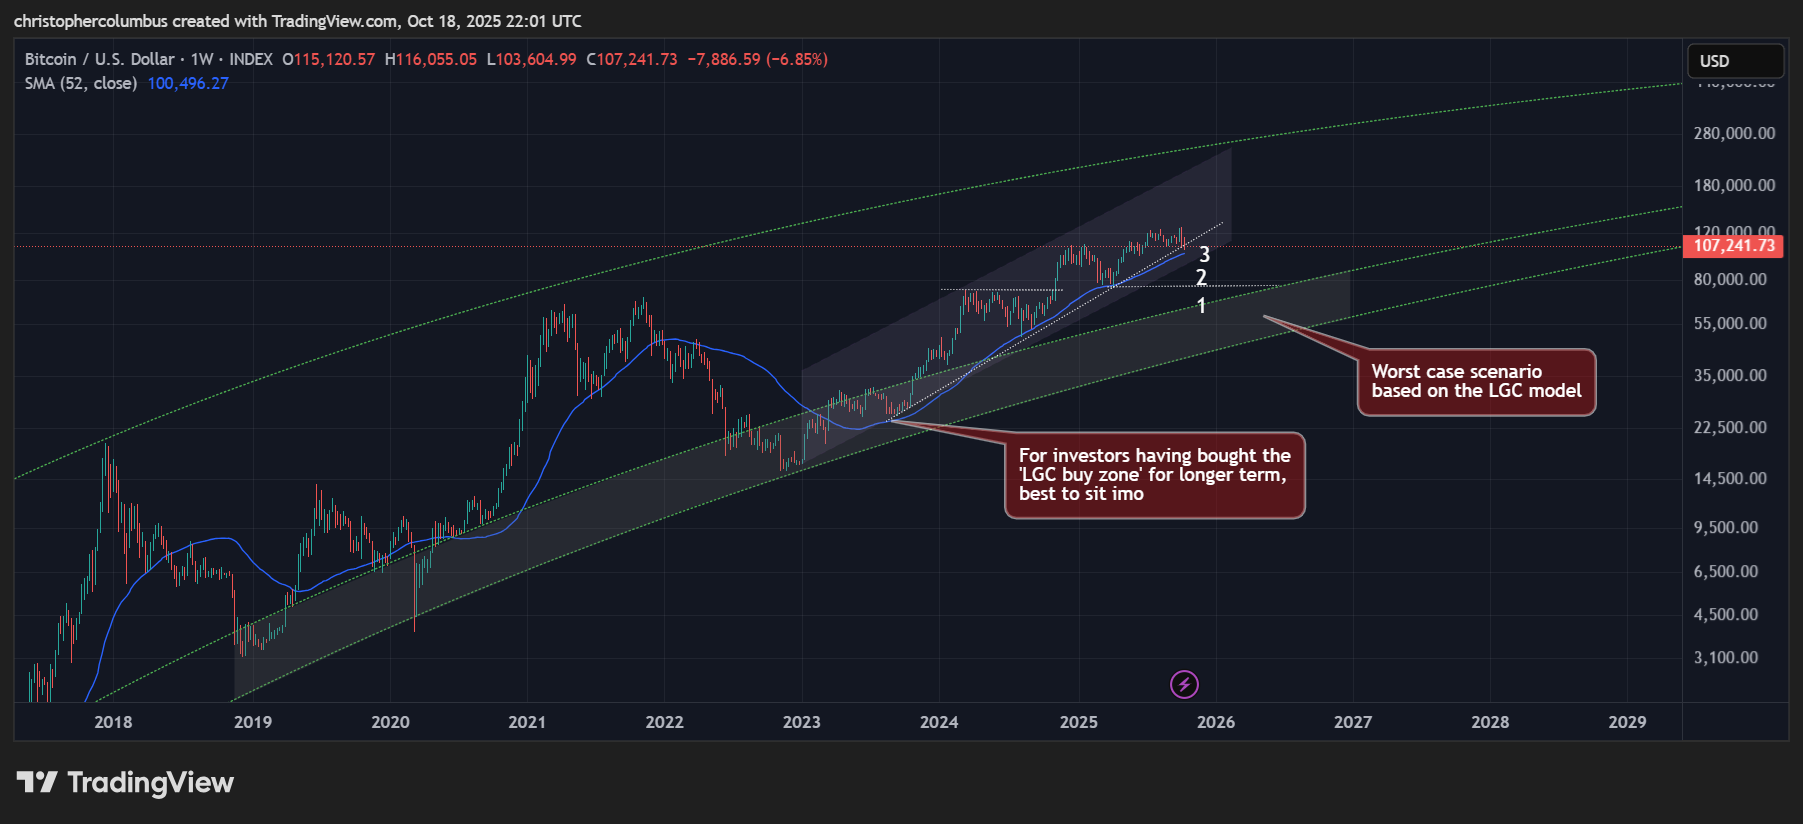
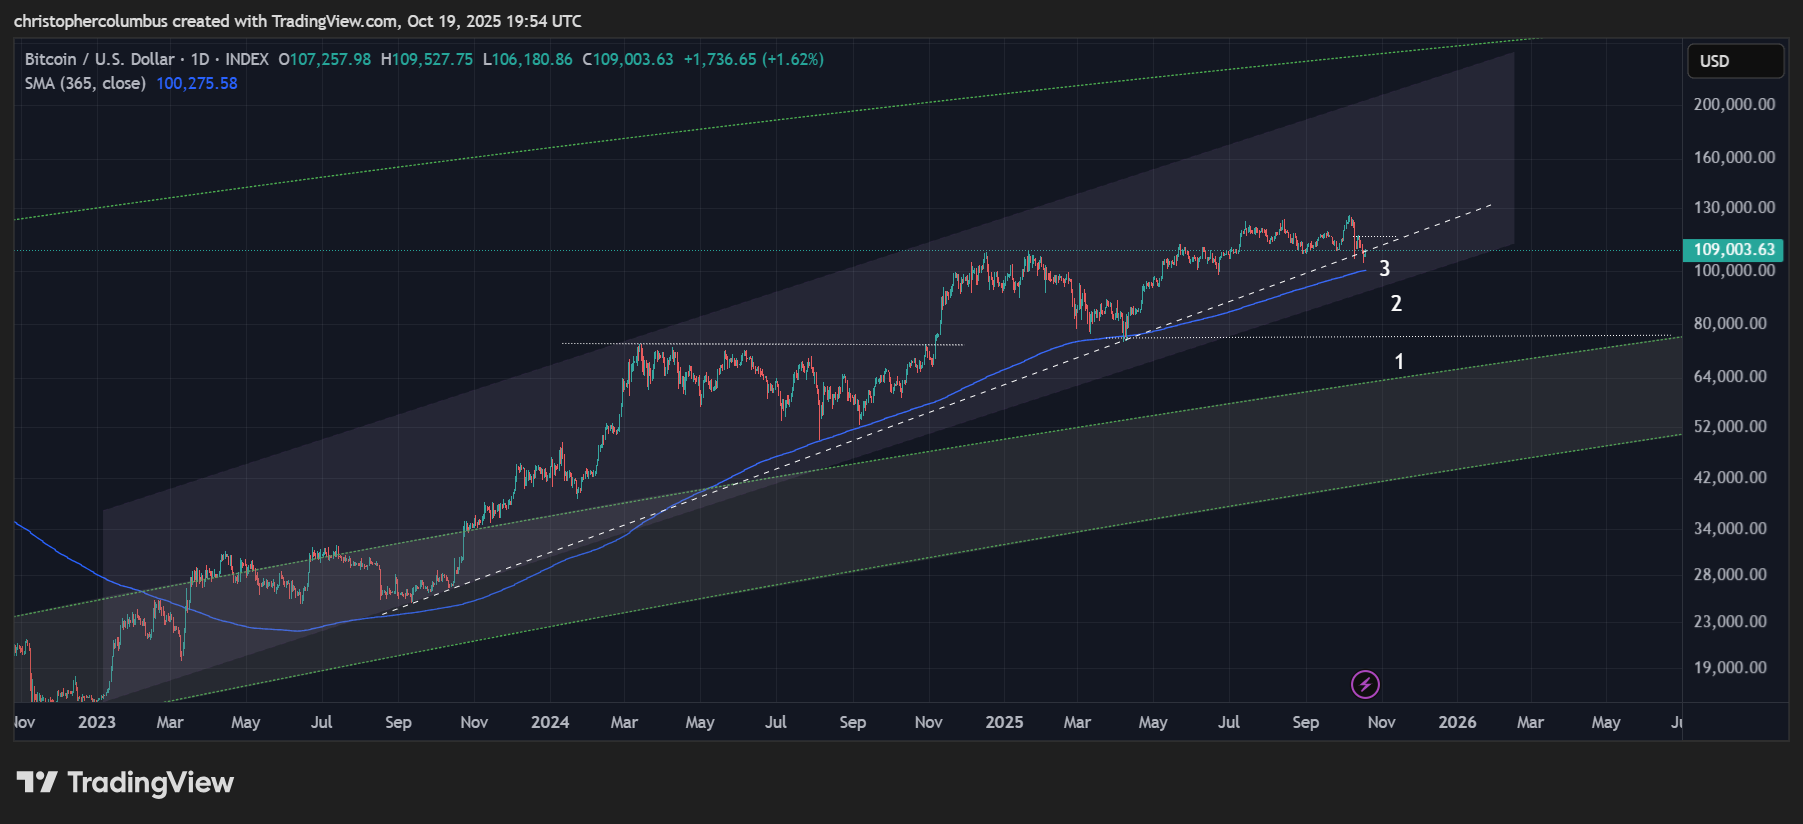
Below is the chart updated and with the 1 year MA added. As you can see, from the technical perspective not in dire straits yet: 4 and 3, the top range and the longer-term multi-year diagonal of support both currently being tested. Technically, no cause for panic stations though there is cause for a heightened level of alert [as per the system].
Notice the 1 year moving average coming through a little lower, and currently at the 100K level [keep in mind also that the 100K level is also of psychological importance]. I would take this as significant here - look to see it hold, if it doesn’t look to reduce risk [if trading BTC and alts]. Personally, the way I’d do it [with alt positions] is to sell positions over a period of time to re-establish a solid cash position. That said, it might not come to that should the market find support here and move up.

Zooming out in order to provide a more macro perspective for investors and holders, price in a maturing market has been relatively stable as compared to past cycles with price currently only midway in the LGC channel…which raises another point.
The Four Year Cycle is not Written in Stone
The worst case scenario above [for traders of BTc and alts] factors a continued macro correction from here [a cyclical bear market]. But this should not be assumed yet, rather we are talking risk management [given we don’t know the future]… in case it does eventuate. This would no doubt involve the start of a process of lightening up on one’s trades - just as one averages in, one averages out.
Yes, cycles have previously observed 4 year cycles, but this does not mean that they have to going forward. Indeed, the notion of a maturing market would suggest that they will be broken at some point… and considering the remarkably technical nature of the cycle [as opposed to parabolic] very possibly this cycle could be that breaking point. As I wrote in the previous article:
The most striking feature on this chart is the lack of parabolic price action and the more technical price action of this current cycle. A long-term diagonal support [lower line] runs from the low for multiple years while being tested at regular intervals.
If large one year corrections are the result of previous parabolas, then it makes less sense to expect such a drastic correction after multiple years of technical not parabolic price action. What the chart is showing is increasing price stability, which is something to be expected in an increasingly mature more liquid market.
Yes, the LGC channel is still predictive of consolidation of price but of something less steep and dramatic… given the more prosaic and technical nature of the previous rise.
Zooming In
If we were to approach this market in purely technical terms, ignoring for a moment the 4 year time line, then there is two outcomes more probable than a fourth quarter culmination of a 4 year cycle - that price continues to roll over here and through technical support or continues to find technical support into next year. Considering this, the technical nature of the market, it would almost be superstitious to insist on the 4 year cycle endpoint. Of course, it may happen, but the technical nature of this market should rule out that it must happen.
Summary
The aim of this article has been to illustrate the way in which the market has developed with technical factors in mind, to show that while we should be more alert to the possibility of a coming correction we should also not be hitting panic stations yet.
Looking at the chart itself, and without the assumption of a 4 year cycle, we see price now hitting longer-term support. In particular it is meeting both the longer-term multi-year diagonal, the 1 year moving average and the psychological significant 100K. In our ‘DEFCON’ system above, this is Level 3, which calls for readiness - readiness to start reducing trading exposure should that level be lost.
That the market is particularly nervous at this juncture is due mostly in my opinion to relatively small movements in price, as seen on the log scale, seeming larger given the nominal value [price] moves in multiples of thousands now, a variant of ‘money illusion’. This and of course the assumption of the 4 year cycle.
Until next time,
Stay [relatively] safe out there,
Dave the Wave.