
ETH
Dear Readers,

As long-time subscribers of mine are no doubt aware, I’m not averse to charting the alts from time to time [indeed, I devote a whole page updated daily to it]. The more resolute Bitcoiner may consider this a bit decadent, but keep in mind that I chart and trade alts primarily as a hedge against my long core hold/ investment in BTC - the alt trade is a pure play on volatility, and as we’ve seen this market if anything is super volatile to both sides beyond expectations.
The aim of this article will be to focus on the ETH/ USD chart* as a proxy for the alt space. If BTC is the king, which as a Bitcoin centrist I believe it is, then we could consider ETH the queen of Crypto. Accordingly, if I can show that the correction of ETH is proportional and well within what we could consider a healthy correction from a technical perspective, this would then bode better for the whole crypto space as a whole. It would give us some confidence in both continuing to hold positions bought at reasonable levels, to average in at low prices, and to buy levels that could be considered a break to the upside… if and when it comes. All of which should once again be hedged [preferably done previously] in the trading of alt volatility in order to re-build cash balances that serve to counter-balance your long Crypto.
The ETH Chart
On the face of it, on the reading of the fib levels of the comparative retracements, the current correction is commensurate with the previous - presently we have just over a 38% correction compared to the 50% previous. This provides some confidence that exponential returns will once again return to this asset class… though perhaps not to the same extent - just as the recent 54x return followed on from the previous 206x return, we should expect the next return [if it comes] to be somewhat less than 54x. To speculate, where 54 is roughly a quarter of 206, so 54 quartered might give a future 13x odd [1200%]. Of course, there is no pretensions to clairvoyance here, just a technical comparison… that some may even consider quite conservative.
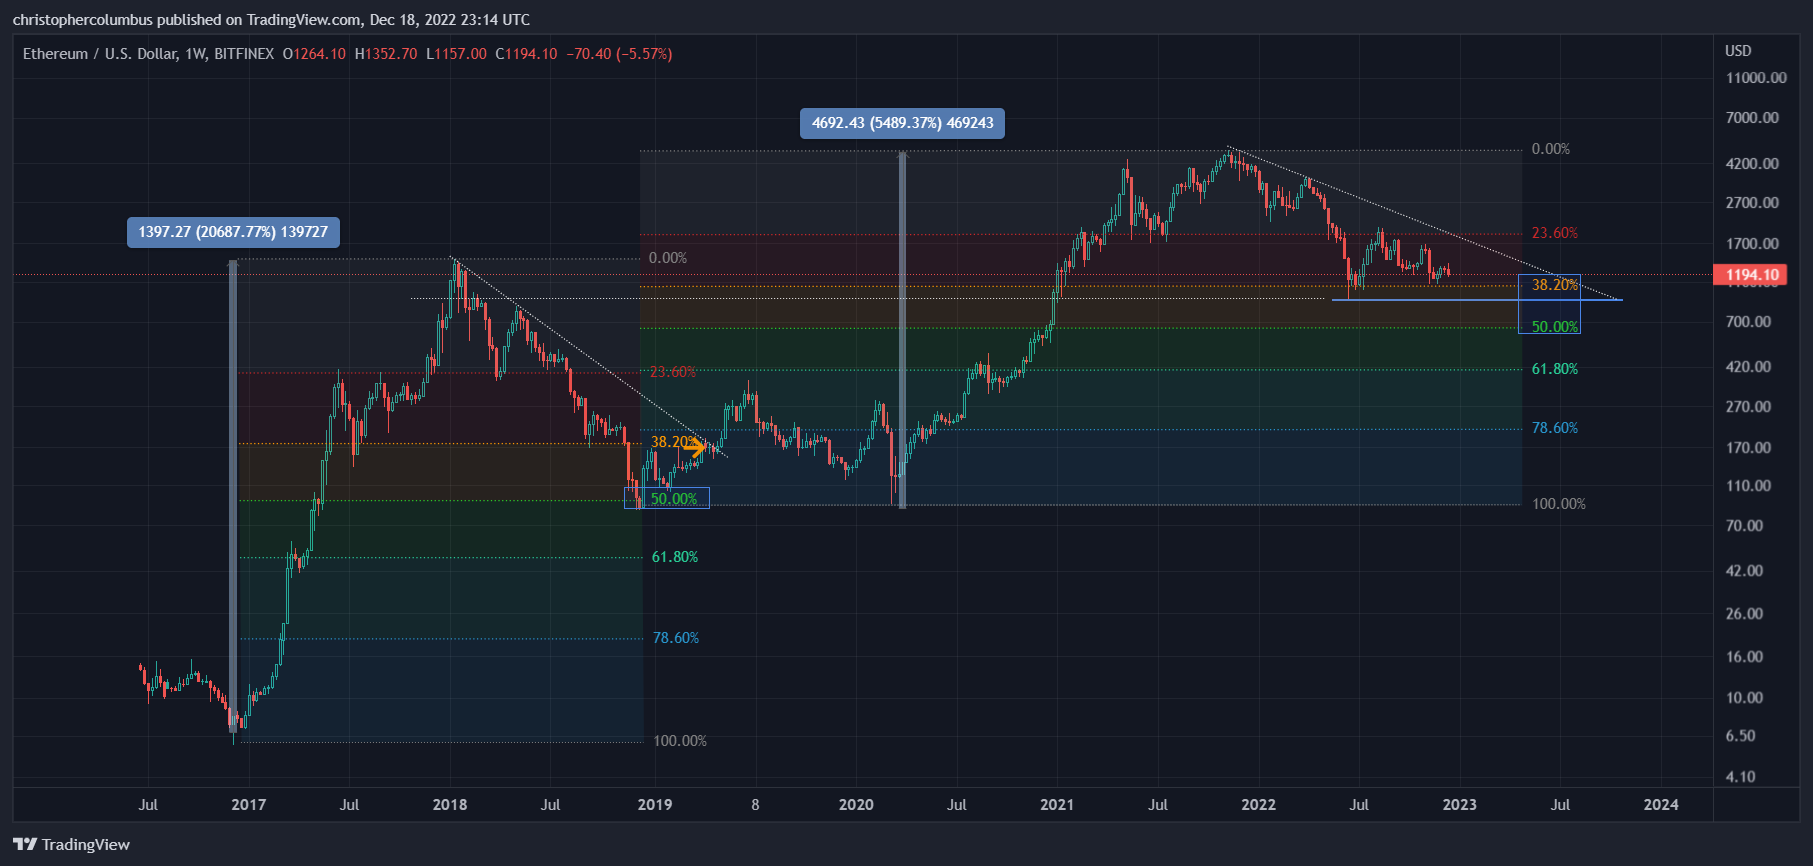
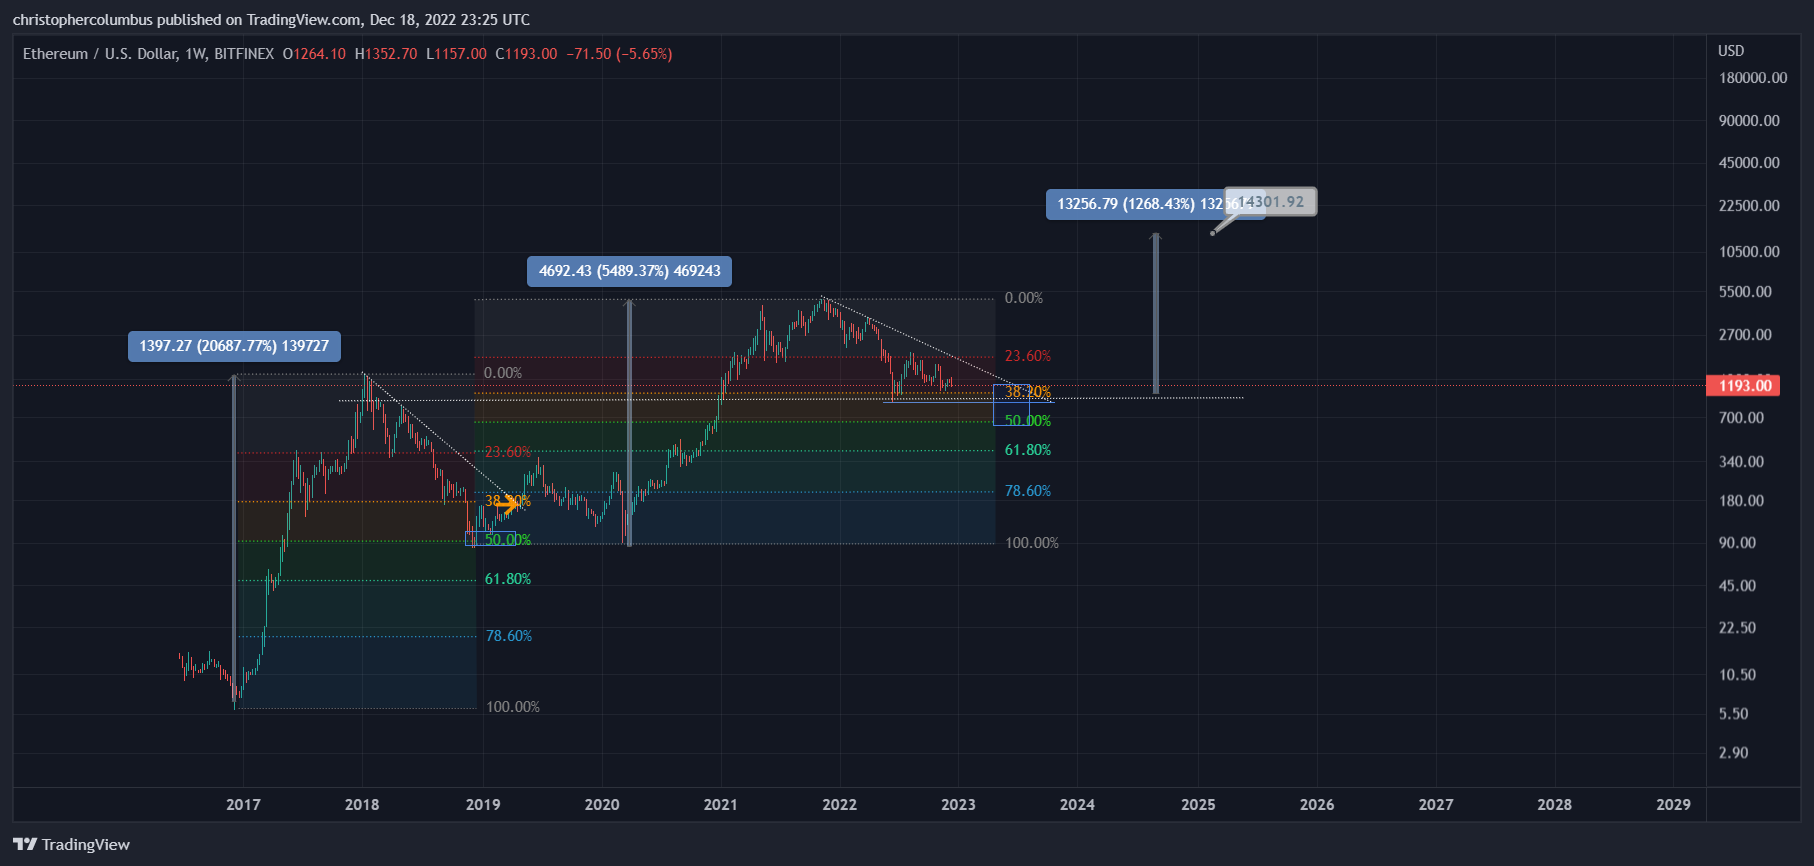
However, the focus of this article is not the hypothetical high in a relatively distant future, but the establishing of a reasonable confidence in the bottom being in at around these levels…. and what this in turn may entail for a buying or holding strategy going forward. That said, the sketching of a future high is worth consideration insofar as it provides sufficient appetite for taking a calculated risk, one that may eventuate in a handsome reward.
I think a further explanation of these particular fib levels may be in order as the connoisseur of charts, who takes an interest in the particular instruments utilized, might find that they are not often used.
The Fib Retracement Tool on the Log Function
Crucial to any measurement of an asset that moves exponentially is the use of the log scale. Not only are prices to be measured exponentially [on the price/ y axis], but so too is the fib tool [it should be changed to the log function in settings]. What the fib levels on the log function then give you is the relative retracement of the real [ROI] move up [from $87 to $4841]. On the log chart, this relative measurement is also a spatial measurement. In contrast the linear fib, along with the percentage decline from the top measurement, simply gives a reading of the nominal decline from peak price [the slightest if difference as seen between the linear fib and the percentage decline is due to the linear fib taking as its start point the very low price near zero. The percentage decline reading is simply read off the peak price].
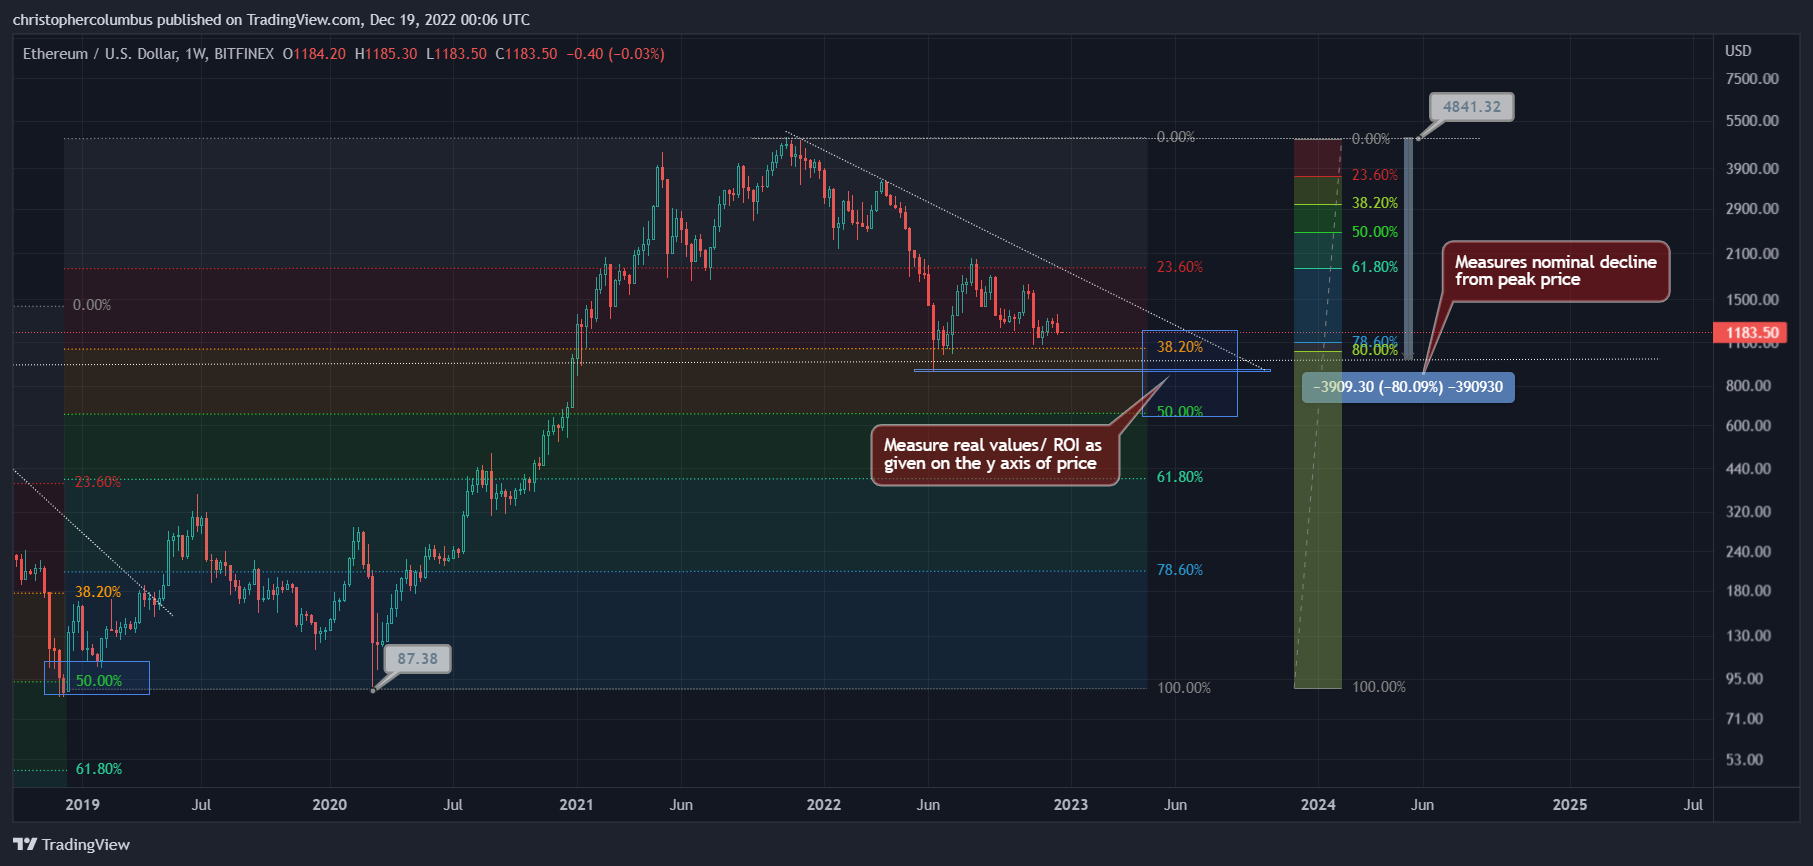
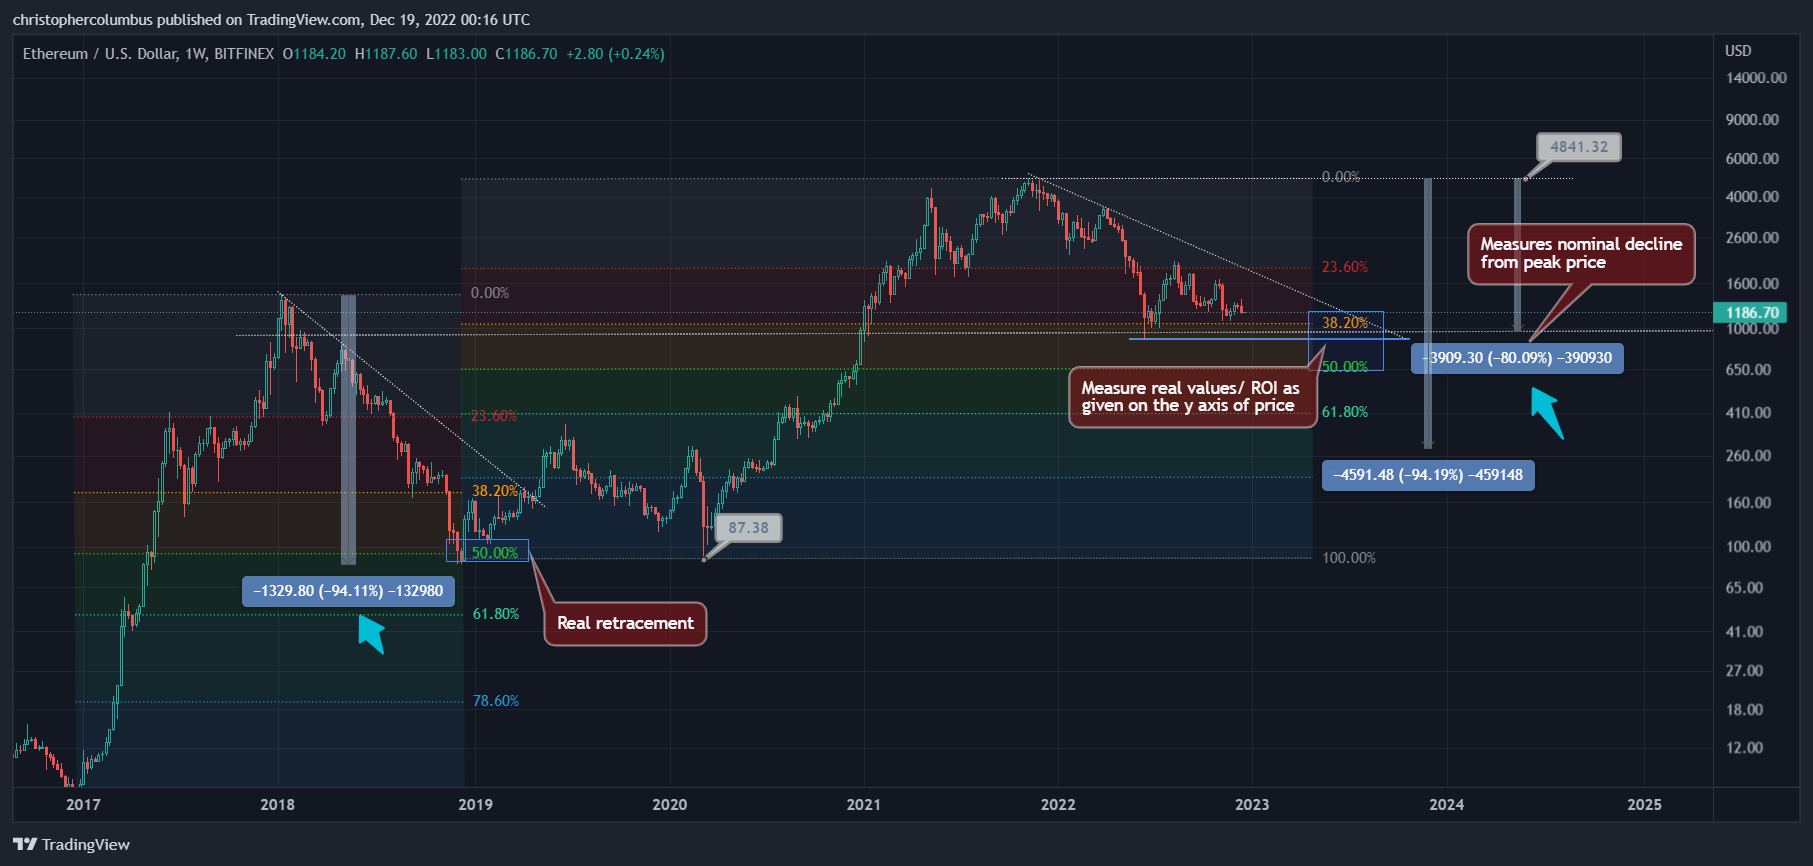
It’s my contention here that without the reading of the real/ log fib reading of the correction, one will be all at sea in regards to identifying a possible bottom. This can be seen clearly from the following chart, where, if simply using nominal measurements, one might think price here needs to correct another 14% [to be comparable with the previous 94%. Where the linear/ nominal measurement suggests price needs to correct a lot further, the log measurement has price near its comparative low [if the low is not in already]. Of course, the point here is not to provide an absolute argument that the bottom is in [which is unknowable] but to suggest that buying at these levels is reasonable, given the risk/ reward. If one were to cover risk to both sides, while also spreading risk in buying, you’d have to think a policy of buying in a few tranches over a reasonable period of time would be the optimal strategy going forward…. with the last of your buys [or perhaps the bulk of them if more cautious] being a break of that downward diagonal at a later date.
Conclusion
The reader may well be thinking by now - after an article of what is essentially a bullish outlook going forward - that I have too much of a ‘bias’. In brief answer to which [that I’ve covered more fully in other articles], a couple of points.
Contrarianism
First of, an active trader/ investor must of necessity take a position [positive or negative] toward the market, and in this sense will always have a ‘bias’ toward the market… never really attaining to a state of pure objectivity. The question is how to modify what is essentially the negativity of the term ‘bias’. More than often a contrarian stance to the mass sentiment of the market will put the trader/ investor in good stead [bearish when most are bull, and the converse]. Of course, this would just be a factor to consider among other factors - an absolute blind blanket contrarianism will not be helpful, for there are times when you want to be running with the ‘herd’. The contrarian bias [ a weighting against general sentiment] will allow one to take profits when the going is good, and to establish positions when it seems all is lost…. which brings us to the second point.
Hedged Uncertainty
“But Dave,” the reader may ask, “what if everything is lost? What if the whirlpool of a general contagion takes everything down?” To which I’d say this worst case scenario should already be ‘priced in’ to your trading/ investing strategy [where one is not over-exposed and takes right-weighted trades… not to mention selling the countering swing trades]. This is the hedge that is resolutely based on the uncertainty [of all of our biases]. This is also what I’ve termed negative capability - the ability to think one thing, the bull, while allowing the bear its voice. Is this schizophrenic? Not really. It is simply a higher order rationality based on uncertainty. It allows the ‘animal spirits’ their sway in a super-speculative market that stampedes first one way, and then the other.
Lastly, my own actual heavy trade taken in ETH to show the practicality of the strategy involved in trading the alts [and that I’ve skin in the game].
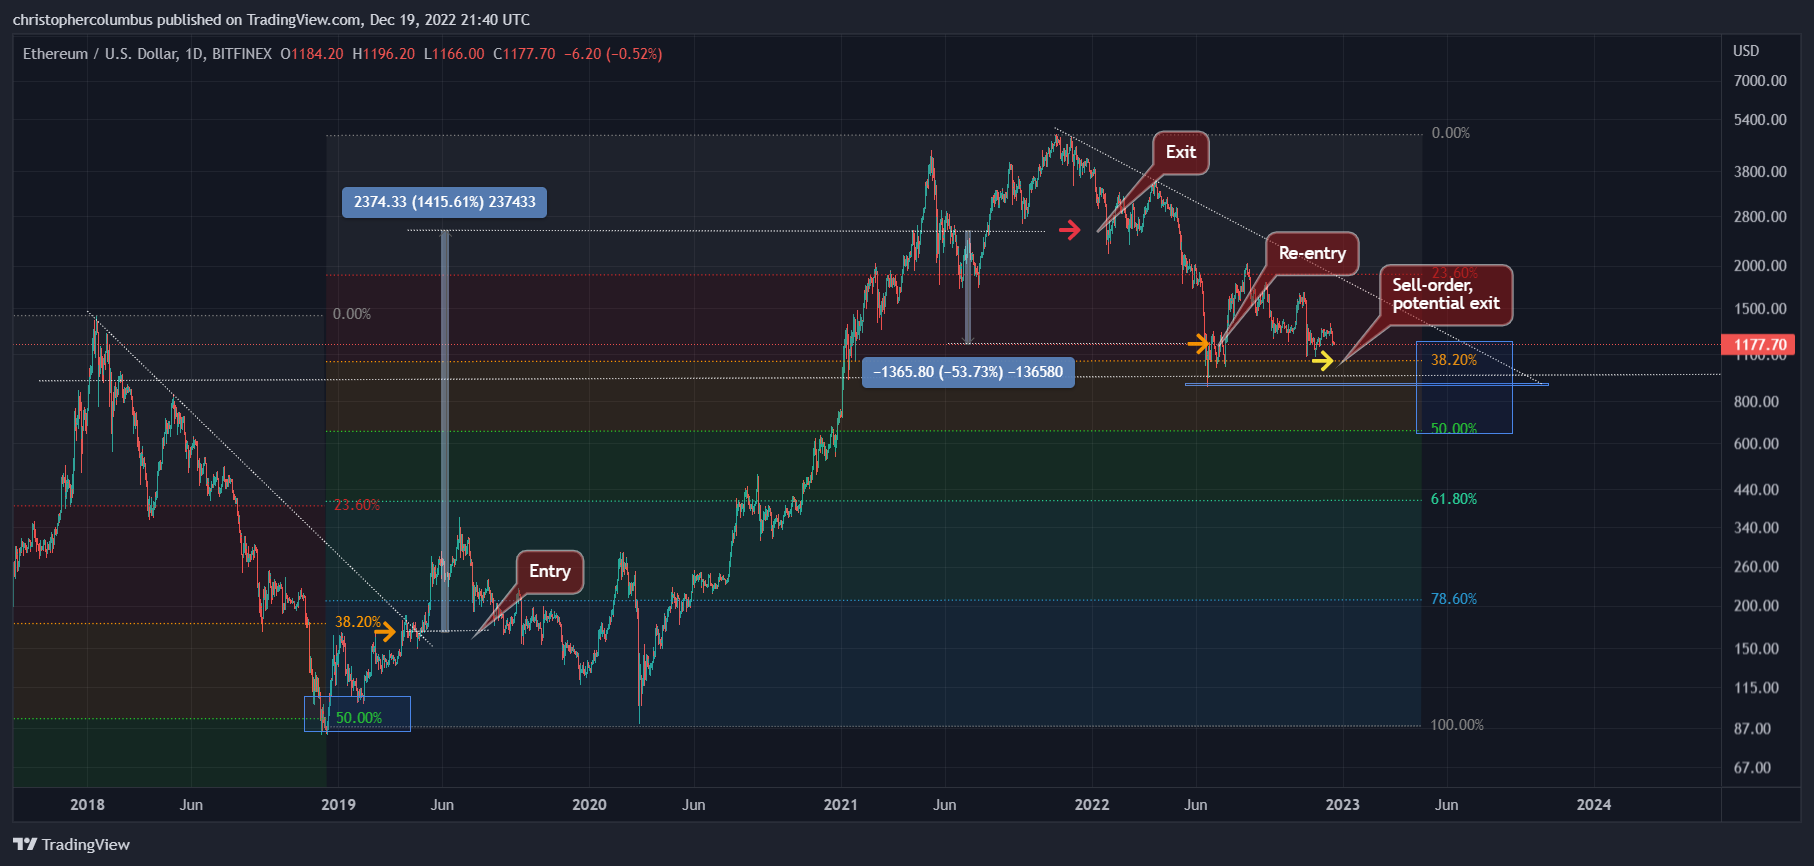
Notice the length of time taken in this trade to give the eventual 15x. Notice I also did not get the top in this trade, not perfect… but good enough in my book. And then the re-entry/ double-up at a 53% discount. The re-entry has so far survived six months. Time will tell whether it pays out in the future. Notice I have a sell-order placed in order to secure the profits of a previous bull market.
Well, that’s it from me for this year. Have a happy Xmas and a great New Year.
Until next time,
Stay [relatively] safe out there,
Dave the Wave.
*The alt/ USD chart/ trade [not alt/ BTC] must be used to take advantage of USD volatility, and for the re-accumulation of USD in order to strategically hedge/ counter-balance your longs in BTC and major alts.