
Evaluating the LGC Model
Dear Readers,

Another fortnight down, and another period of time closer to a future bull market. The elephant in the room, time, is here the crucial element for the investor, and is also the crucial element for making sense of a price model… insofar as it is to be rigorously tested [and so evaluated] in the marketplace.
This article will be something of a companion piece to the previous one. Where the previous article outlined the theory of what a model actually is [and seeks to do], this article will apply the general theory of a model to the particular LGC model itself. The idea here is to evaluate the LGC model, where I’ll argue that it is currently the most valid one in the marketplace of ideas. More than just a theoretical exercise, the practical aim here is to provide further confidence for the investor, who has invested, or is thinking of investing, in Bitcoin. I’ll first look at the over optimistic price projection that undergird other models as compared to the LGC, before going on to look at the predictions, performance and validity of the LGC.
Previous Modeling
First of, most of the models in the market place circa 2019, for one reason or another, had something like the following in mind, where the exponential rise in prices that were seen in the past would be duplicated going forward. The move to five figure prices [and the eventual million] was thought to come relatively quickly. This was the basis on which most got caught out on the double top, where, though new all-time-highs were seen, there was not that expected ‘blow-off top’ [a different kind of blow-off top was envisaged here at that time].

A repeat of the previous price increases [on the log scale] has failed to eventuate, and accordingly, based on the criteria of failing or non-performing price prediction these models have been invalidated:
What really matters is results - the predictive power of both TA [preferably on a higher time-frame] and modeling. Accordingly, a model is not valued because it is ‘right’ in say data-driven terms, or mathematical certainties, or explanatory verities. Rather, a model is valued insofar as it’s further confirmed, validated, supported, or corroborated. It is valued/ valid insofar as it has passed crucial tests that involve prediction [future price prediction] and performance [the subsequent observance of those predictions]. Given this, the language of ‘right and wrong’ is wholly inapplicable to the hypotheses of TA and models - they are simply considered valid or invalid [of value or not] at the practical level.
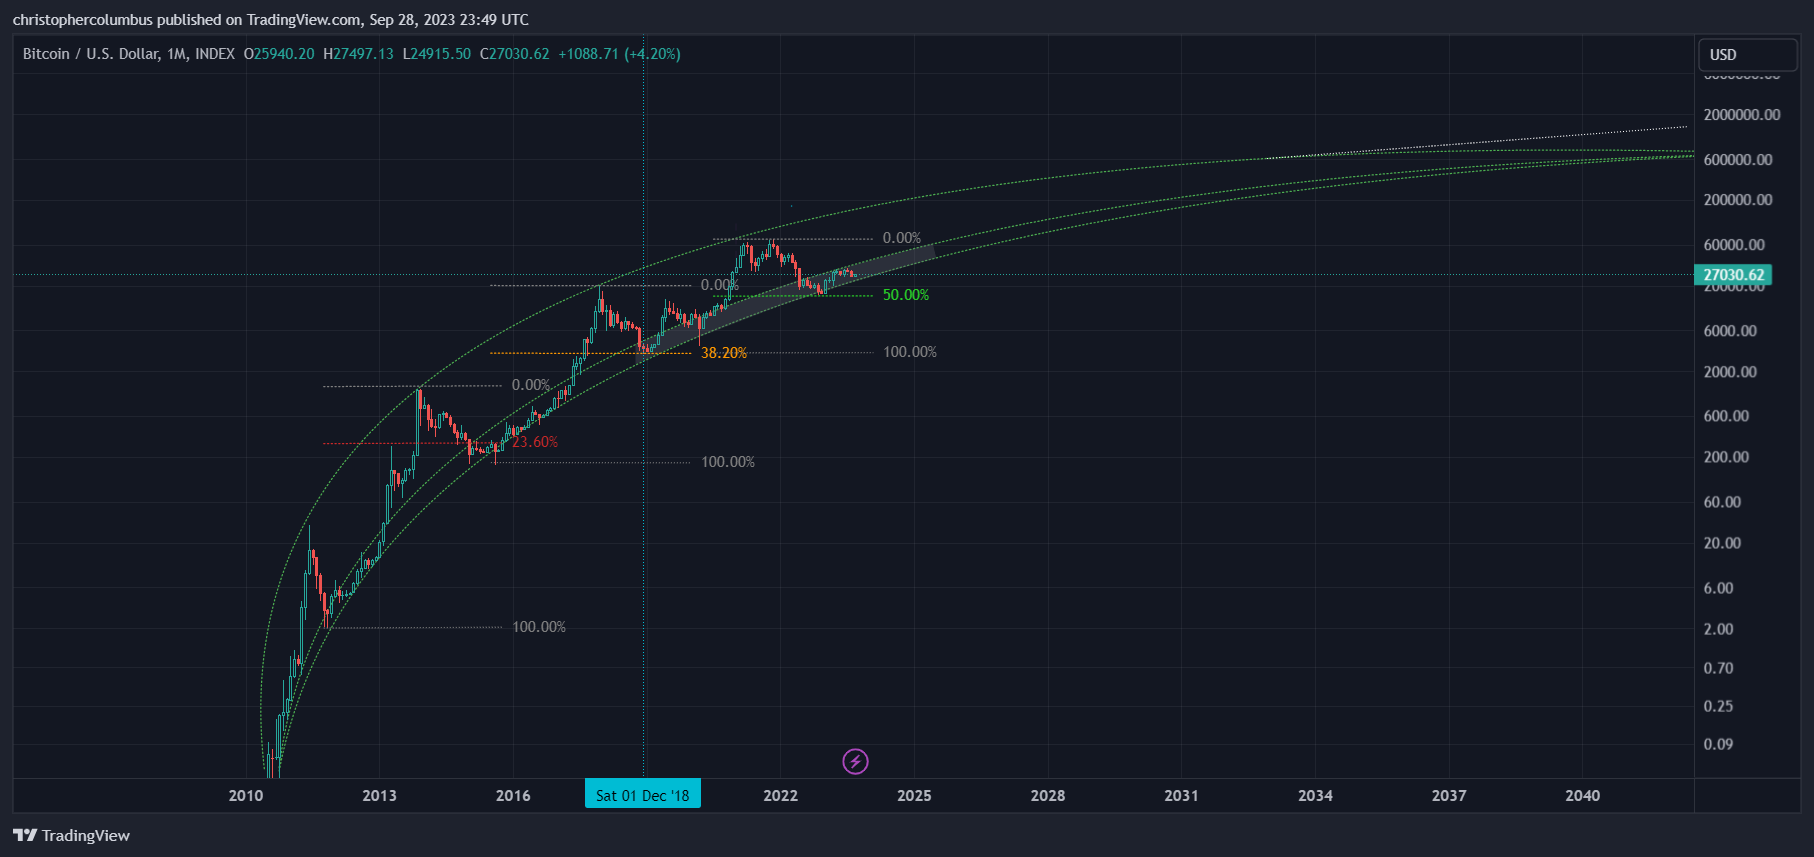
This brings us to the price predictions of the LGC model. Where there had previously been various forms of log regression charts, these had tended to function around a mean of prices drawn through past price action as follows and depicted by the orange line:

Though this was an advance on the previous models, in allowing for the idea of diminishing returns, it yet failed to really provide future price direction by which investors in Bitcoin could find some orientation in a confusing arena. It was the final capitulation, at the end of 2018 and as marked on the chart, that provided the pivotal moment for the LGC model.
The LGC Established
The problem that plagued the models with a log regressive mean of price was that it tended to create a perma-bull bias in the observer. For myself, this was quickly dispelled by the 2018 capitulation, where I sought to construct a model that was more realistic and more discriminate - one that could more realistically predict the more opportune times to invest. The essential component of this was to drop the previous mean of price in order to have it function more technically as a line [or curve] of support. Added to this was the macro concept of a logarithmic growth curve [LGC], a well-known force of nature, which would serve as the further projection of that curve. The explanatory component of all of this is that what the LGC represents is the rapid capitalization of an alternative of nascent currency - initial gains coming quick, later gains taking more time as depicted in the following chart.
And a comparison of price projections of previous models as relative to the LGC:
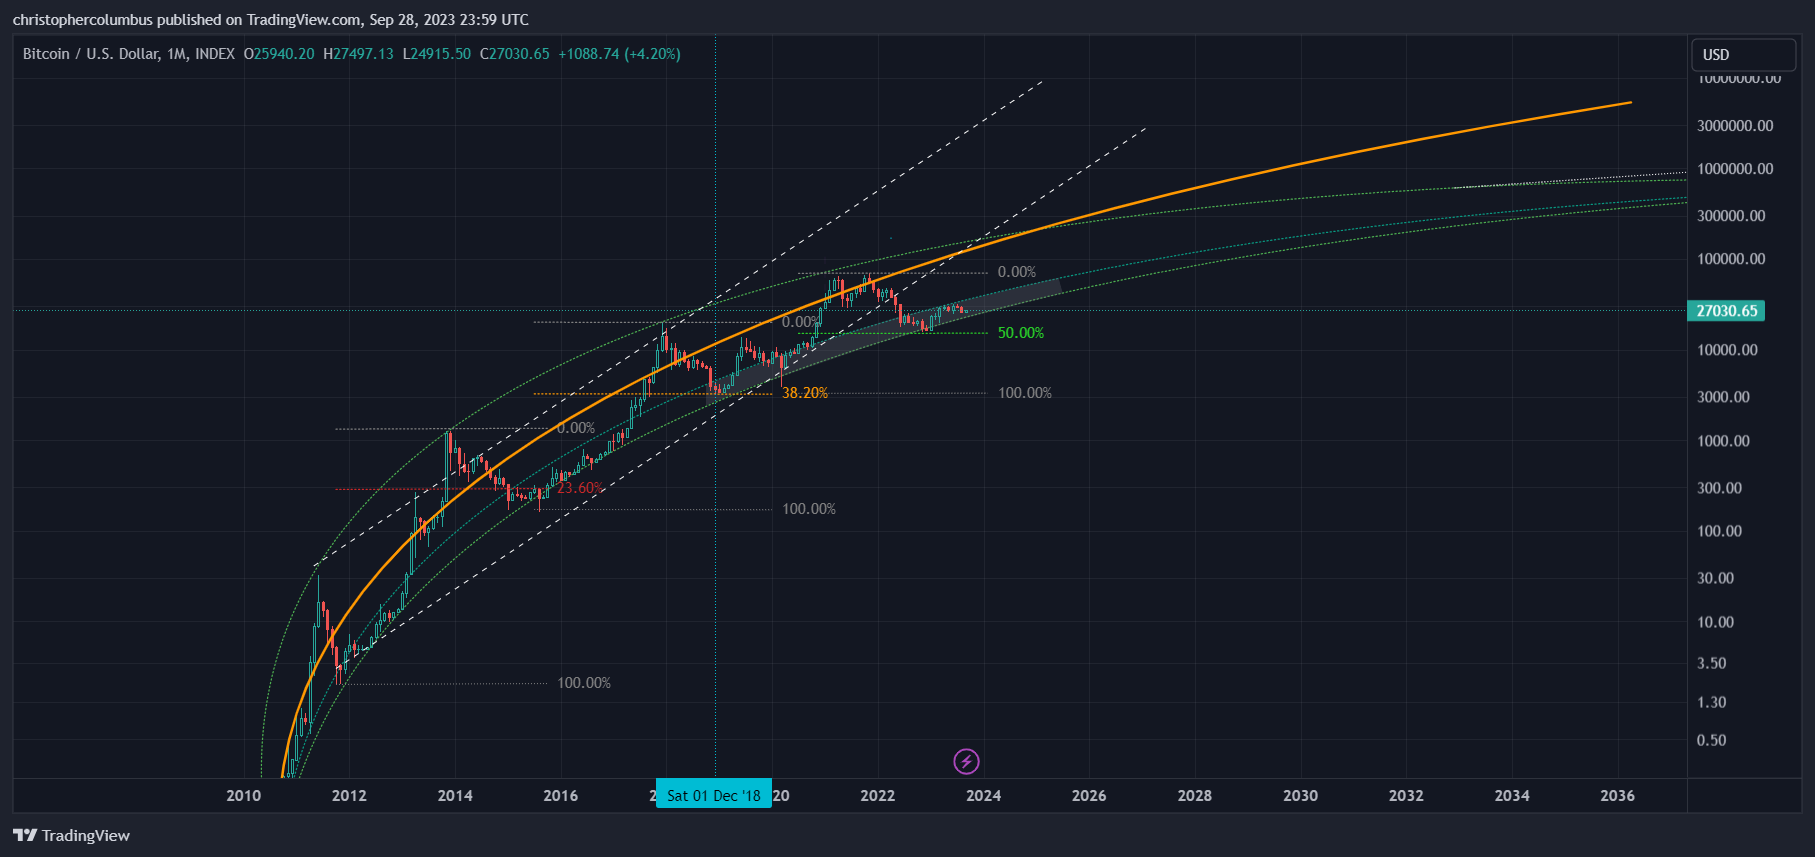
Keeping in mind that this model was first established and curves first projected at the end of 2018 [as marked], time now to evaluate the predictive strength of this model.
LGC Past Price Prediction and Performance
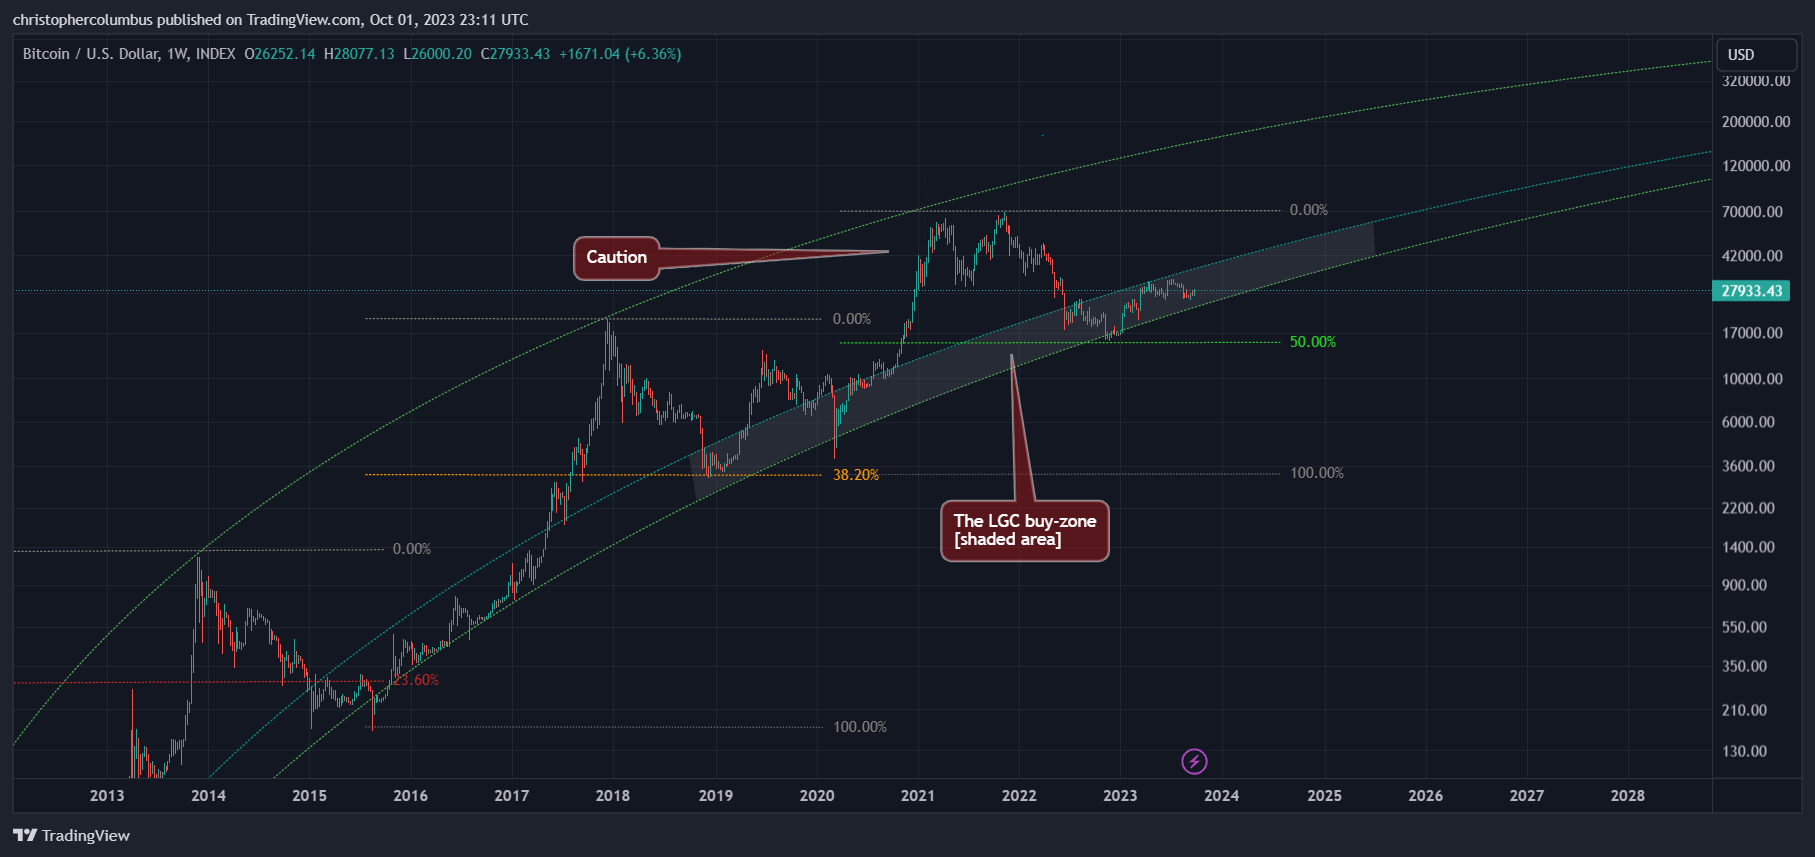
The prediction of the LGC model, pure and simple, is that price will range through the channel going forward. The model per se does not predict how it will range in cyclical terms [however, this does not stop technical analysis, over and above the model, attempting to do so]. The reader may object that the range is too wide. And yet when you consider that this channel is converging and plateauing, and also thus far has ‘contained’ the price, the LGC channel from the macro perspective is relatively narrow. This bring us to the important point that it is testable/ falsifiable [as per the quoted passage above]. And so to the prediction [LGC curves] given in real time at the end of 2018:

The green arrows predicted support, and also lie in the ‘buy zone’ [the lower shaded band]. Investors that bought these have done well…. and the earlier, the better [keep in mind that we are looking at building a long-term core position in Bitcoin here opposed to trading it].
The red areas denote ‘resistance’, where price is getting too high in an over-heated market. The first red arrow points out what was considered, on the basis of the model, a ‘mini-parabola’ at the time, where price had moved too quickly out of the ‘buy-zone’. Sure enough, it corrected to a level where investors could once again buy at more optimal prices [if they hadn’t already bought earlier]. The point of the model is to establish your BTC position and then just sit on it [as for taking profits, this is covered in other articles… involving some use of strategy].
I think the reader would agree that the model has been severely tested several times now and has passed with flying colors. Does this mean that it is true, certain, or a sure bet? No, it means that it is a valid model as covered in the previous article. It means that the investor can have confidence in their risk-managed positions.
If the particular form of rationality we know as hypothesis were recognized, those armies of commentators ‘clashing by night’ would neither take a model dogmatically nor would they rubbish all attempts at modeling per se. They would take a model pragmatically, consider its predictions, observe whether those predictions in turn come about in subsequent performance, and evaluate the model invalid or valid based on that. If a model has continued validity/ performance then it is still only provisionally ‘true’ [valid] and open to being invalidated at some future date. All models are useful until invalidated… and so all models, considering what a model actually is, are hedged against in the most basic and conceptual terms as well as positions taken.
The question facing us now is what the LGC model further predicts for price action going forward. Also relevant are the price levels at which it could be invalidated, for the LGC is a model and not a dogma - it will continue to be tested in the real world of future price action in the marketplace.
LGC Present Price Prediction
One thing you can be near sure of is that there is always some kind a variation on the theme. So for example, the theme of the model last time provided the range of price, and yet the variation was the double-top which was near unpredictable.
This time round, the theme [of the LGC channel] should hold on the basis of the general model. More difficult will be to predict the inevitable variation that price will take within the channel, where the peak price is achieved. Of course, the market tends to be most interested in the ephemeral peak, and yet the investor will be [or should be] more interested in optimal buying prices and longer-term price. This is the difference between the investor mindset and what I would term ‘retail’.
That said, what follows is a shorter-term speculative peak projection based simply on the pattern of the past. This should be taken for what it is and not mistaken for clairvoyance. It provides some sense and orientation to where the peak could reach in an over-heated market…. both price-wise and time-wise.

If, in the future, price action panned out differently to this would this then mean that the LGC model would be invalidated? No. For that to happen, the LGC channel itself would have to be broken, to either the upside or the downside as in the following chart - the crucial test by which the model can be invalidated [indeed, at some point a maturing market is likely to break the nice neat 4 year cycle as discussed here]. The point here is that the LGC model is not tied to cycle theory.

In summary, based on the past performance of the LGC model, the pragmatic investor has some confidence in buying a risk-managed position, or a series of risk-managed positions, while price remains in the LGC buy-zone. There is no sure bet in life, but given the macro trajectory of the LGC channel, and the series of speculative episodes that have contributed to that trajectory, the investor surely wants to have some kind of exposure to this market. Interesting to note that with the passage of time where the LGC told a cautionary tale before about peak prices, the LCG buy-zone is now creeping up to those very prices where on the basis of the model they become more optimal.
Until next time,
Stay, relatively, safe out there,
Dave the Wave.