
New Year, New Move Up in BTC?
Dear Readers,
First of, with the first newsletter of 2026, Happy New Year to all! And it does seem a happier one for us Bitcoiners - after a multi-month correction, we now have printed on the chart a multi-month basing pattern. Price has held up well after the 4th quarter correction that panned out instead of the 4th quarter fireworks. One positive of this is we remain in a technically solid market as opposed to a parabolic blow-off… with its concomitant one year correction [does this suit long-term investors more… increasing stability?]. Accordingly, given the more technical nature of the market, the correction may have played out. Though this is not a certainty, it does function to distance ourselves from the assumption that a 1-year-long correction must play out.
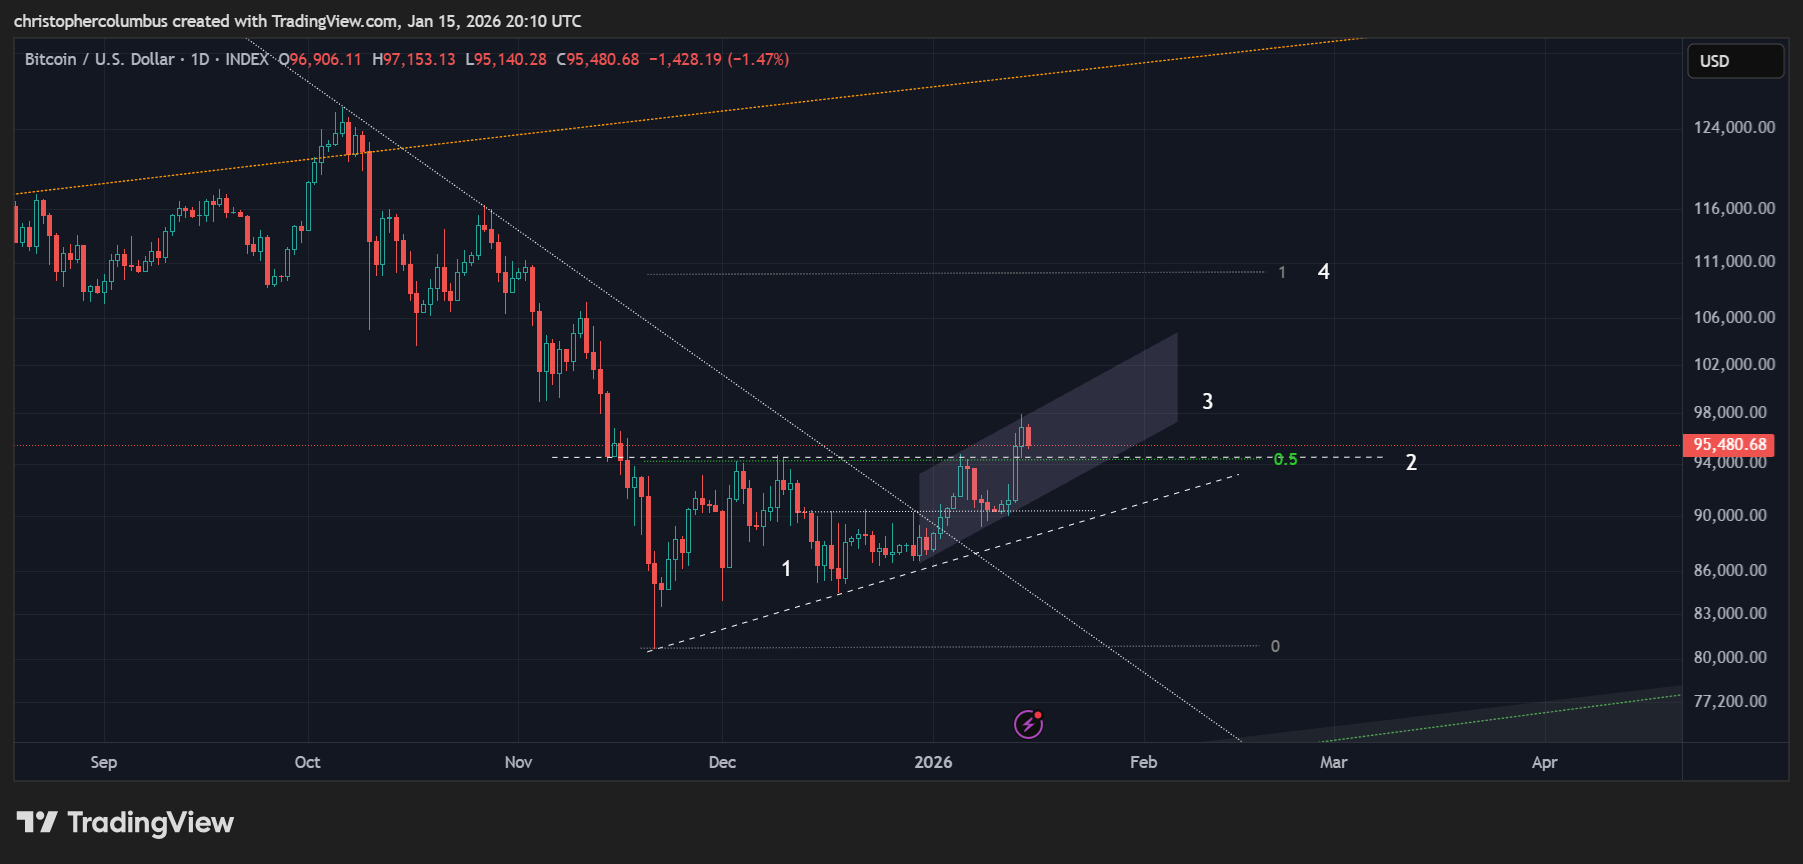
And to the chart, where current price action looks to be confirming price entering a new phase:
1] A multi-month ascending triangle effectively putting a base under price
2] Multi-month resistance broken to the upside. Looking for resistance to become support
3] Shorter-term upard channel formed… some room for short-term consolidation
4] Fib extension target of 110K, well through the 100K mark, which would be a significant psychological factor for the market
For the longer-term investor, all seems relatively quiet on the market front… nothing too alarming at all. For the unexposed trader, they would no doubt be considering an entry on the basis of the technicals… to in turn futher bolster upward pressure on price.
Zooming out a little for the chart that has to be of more interest to longer-term investors [to which this newsletter is primarily directed].
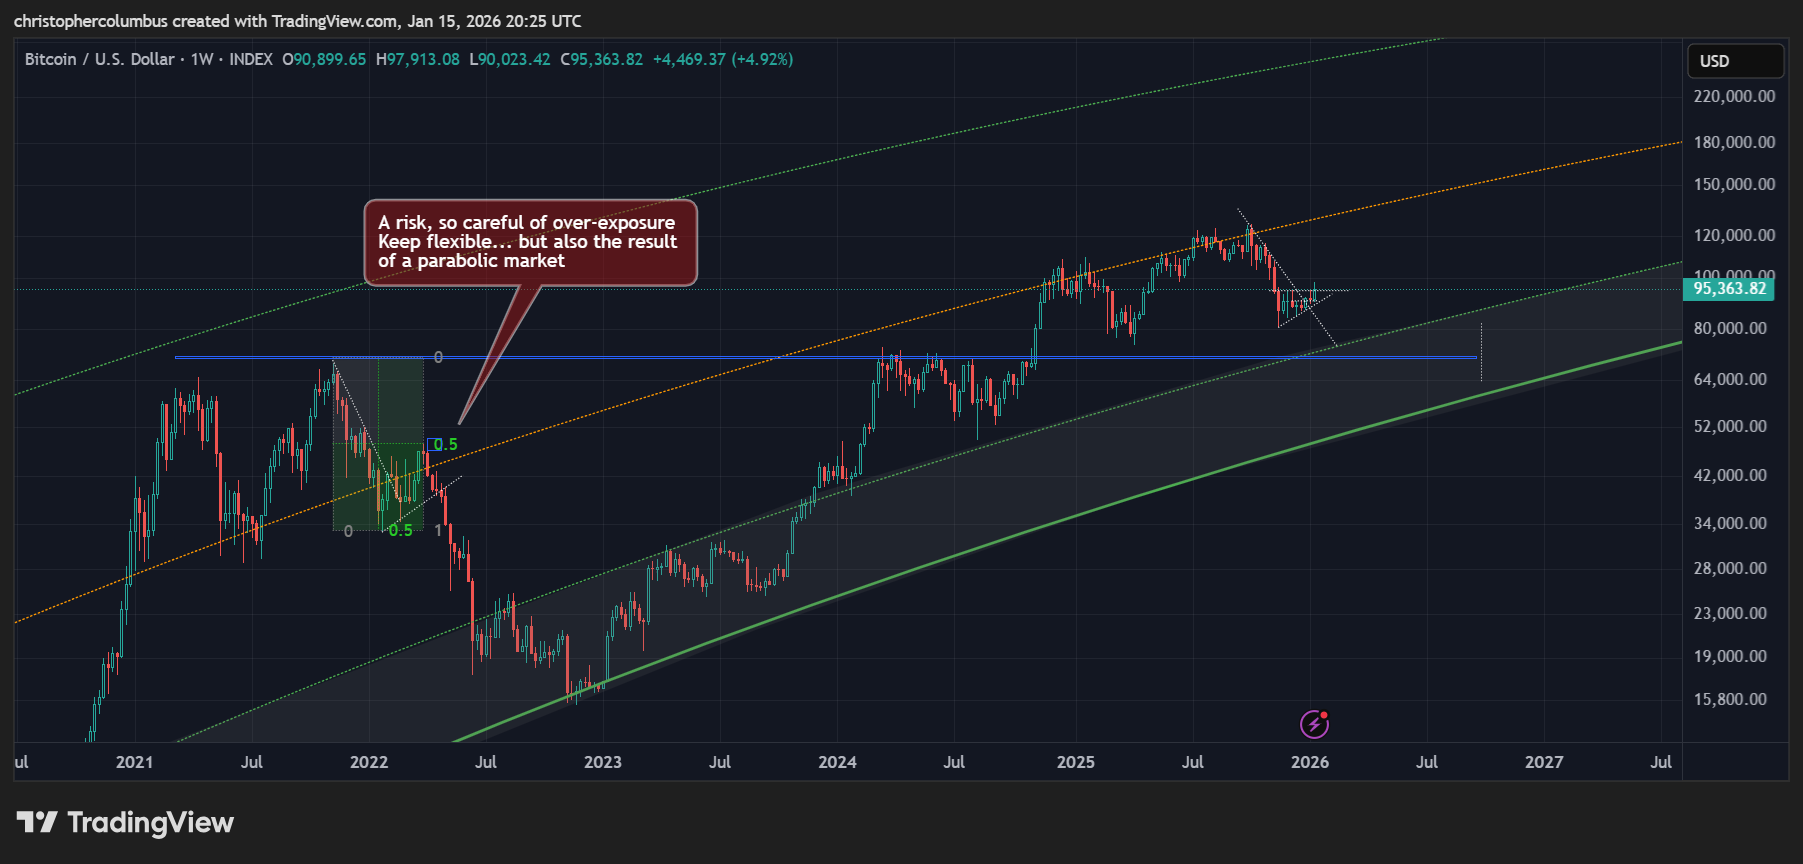
Having looked at upward pressure on price, and not wanting to ‘sugar-coat’ the chart, a risk remains - that of a further correction to the buyzone and the multi-year macro resistance come support area [blue line].
The factors mitigating this risk:
1] We have not seen that parabolic rise in price that was expected, the logic being no parabolic rise, no year long lengthy [and deep] correction
2] An increasingly liquid market [along the lines of logarithmic growth] will lead to an increasingly stable price on the macro [even if it doesn’t seem stable in nominal/ price terms]
The factor supporting the risk of a further correction is that the multi-year cycle is not quite dead and buried yet. Either it will be falsified here [the logic of a maturing market/ increasing stabilization of price] or it will be further validated by a possible secondary correction.
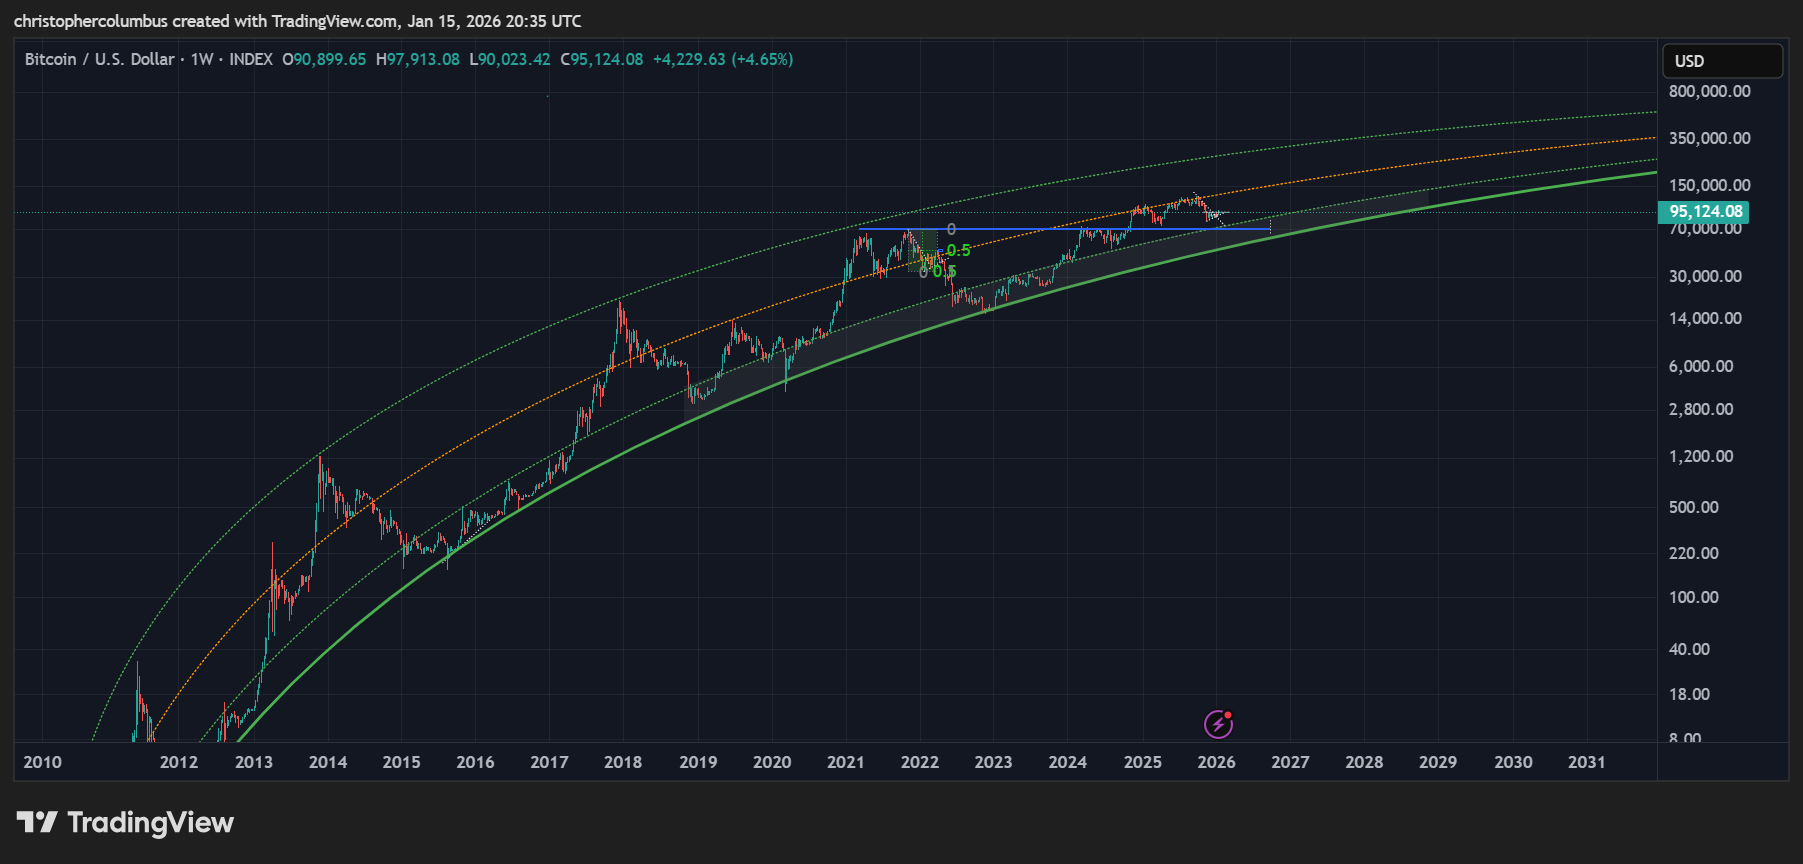
Zooming further out on the macro chart, the longer-term investor should be fine with both eventualities playing out within the logarithmic growth curve [the LGC, a model that has held since 2018]. Also notable is the more subdued nature of the macro price action in the LGC clearly showing a process toward price discovery and price stability.
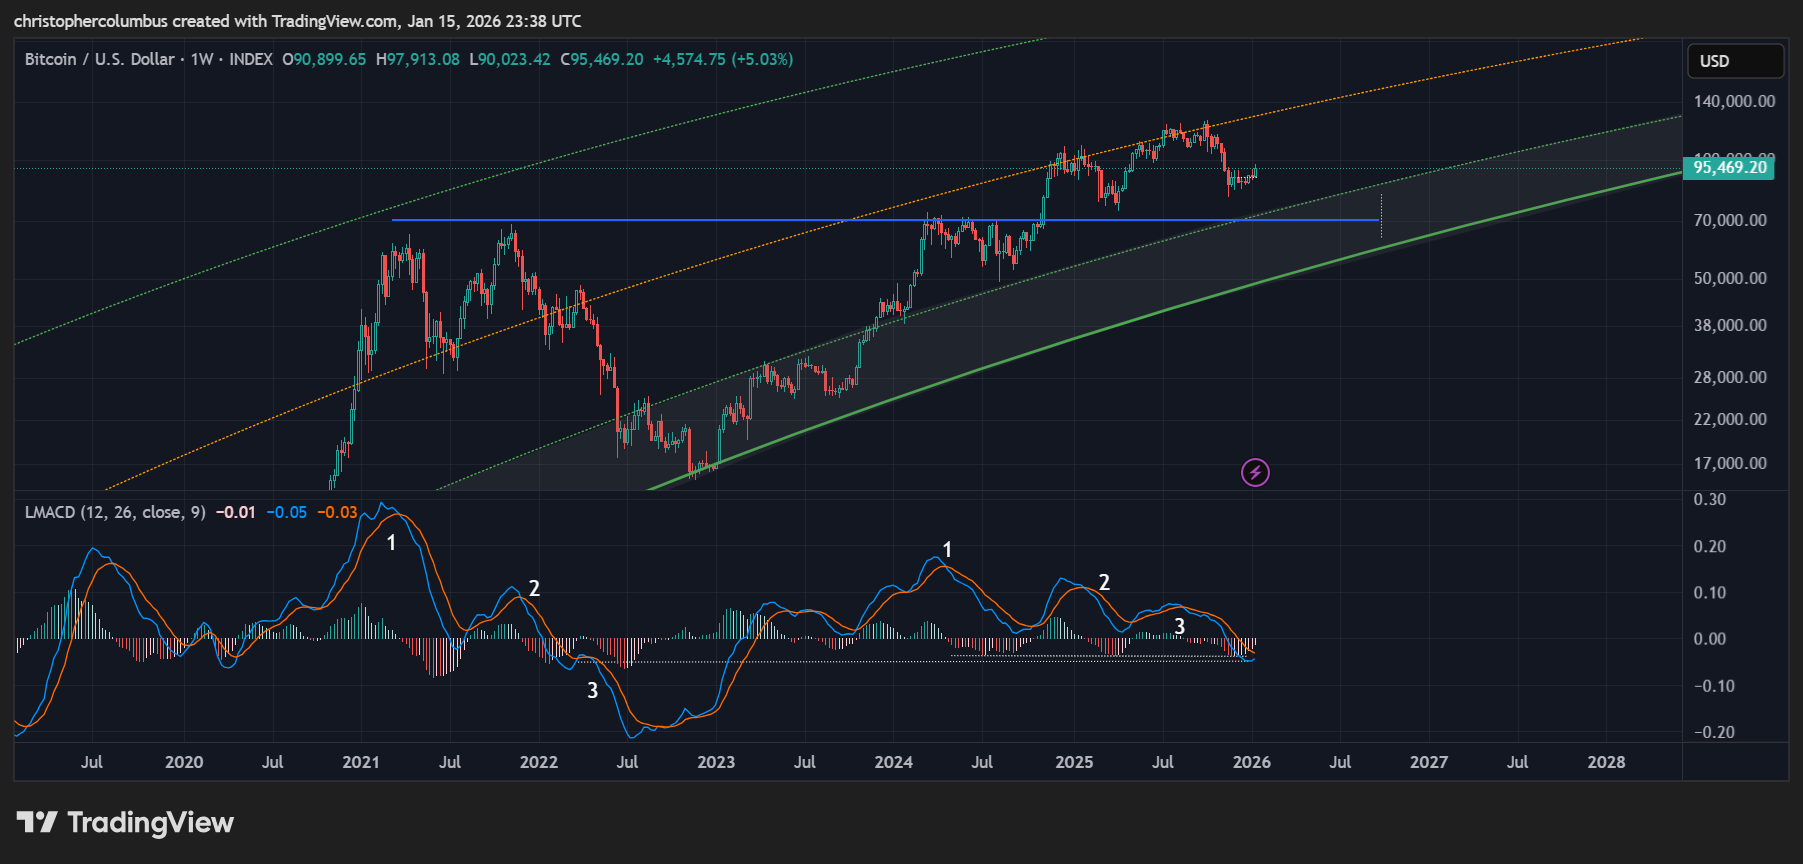
The weekly MACD [here on the log scale below] well illustrates the nature of price position at the moment. The MACD itself has corrected to the zero-line and then some. the histogram is contracting bullishing, the MACD is turning up. All positives, but the reader will naturally trace the line back to 2022 and ask whether we won’t see that secondary correction. Off-setting this - the MACD never got as high as last time, and, interestingly like last has already ‘re-booted’ three times toward the zero [showing the unparabolic nature of the recent cycle]. IF there were too be another move down, I highly doubt it would be that deep with support found at that resistance come support, and the LGC ‘buyzone’.
In summary, I would say that we can remain quietly confident about BTC price.. while also remaining alert and flexible to various outcomes. Something else to keep in mind is that BTC is digital gold. With all the geo-political uncertainty about these days, this is also likely to put a floor under price.
Until next time,
Stay [relatively] safe out there,
Dave the Wave.