
Prediction and Confirmation of a Maturing Market in BTC
Dear Readers,

Though TA proceeds by an autonomous set of rules isolated from exterior conditions, namely by analysis of price action in the marketplace, an eye is always kept on those exterior conditions such as the current geopolitical situation in the middle east. Those conditions should not really have impact on one’s analysis of TA at all, for the danger is getting overly bearish [or bullish] on the news of the day, and we all know how wrong that often goes. Rather, in hedging the positions we take [on the strength of TA], we meet the risk of any possible meltdown in the markets. In this sense, such a danger is already ‘priced in’ to the exposure we have.
I thought an article on the concept of a maturing market would be timely given that I’ve noticed an increasing number of BTC commentators describing something like this, in regard to the current cycle, usually phrased in terms of increasing liquidity, increasing institutional buying etc. The descriptions are largely ad hoc [to this], retrospective, coming after the event, describing what has actually happened in the market.
Of course, in order to profit from a market, you want to be positioning yourself before the event, and this is where prediction, extrapolation, and theory all come into play. Years back I was predicting that such a maturing process in the BTC market would play out in terms of the cycles, and that indeed the whole theory/ model of the LGC is best understood as a process of maturation [or capitalization of a nascent alternative currency].
This article will first review the previous prediction and its current confirmation. Then, with the LGC model further corroborated, or strengthened, it makes sense to once again predict the way in which price action in the near future could develop within the confines of this model, and of course with the idea of a maturing more liquid market in mind.
Overview
Over 4 years back, I was looking at the notion of a maturing market in Cycle Theory Revisited
On the chart, the ‘cycle’ seems to be breaking up just as giant ice-sheets would in warmer waters. Nor should this surprise us in the face of a general principle, where a maturing market and increasing liquidity is understood to lead to reducing volatility - the single major volatile spike [and correction] may be broken up into a series of more minor volatile spikes [and corrections]. And so it is that the increased liquidity of a maturing [and very speculative] market suggests a re-visiting of what has to be the current ‘orthodoxy’ of cycles.
In Superseding the Cycles a few years back, a rationale was provided for the bottoming of the market at a time when the wider market was in fright and flight mode [buy when there is blood in the streets as they say]. the following points were made:
- Diminishing returns [currently observed]
- Diminishing/ irregular cycles [arguably yet to be observed]
- An eventual level of price discovery [relative to the radical volatility observed previously]
Of course, diminishing returns were always part of the LGC model [since 2018], but the notion of irregular cycles was introduced to account for the idea of a maturing market, where those grand 4 year cycles would eventually be seen to break up. To be fair, the 4 year cycle has, strictly speaking, held time-wise so far. The irregularity as of yet is to be found within the price action of the cycles themselves:
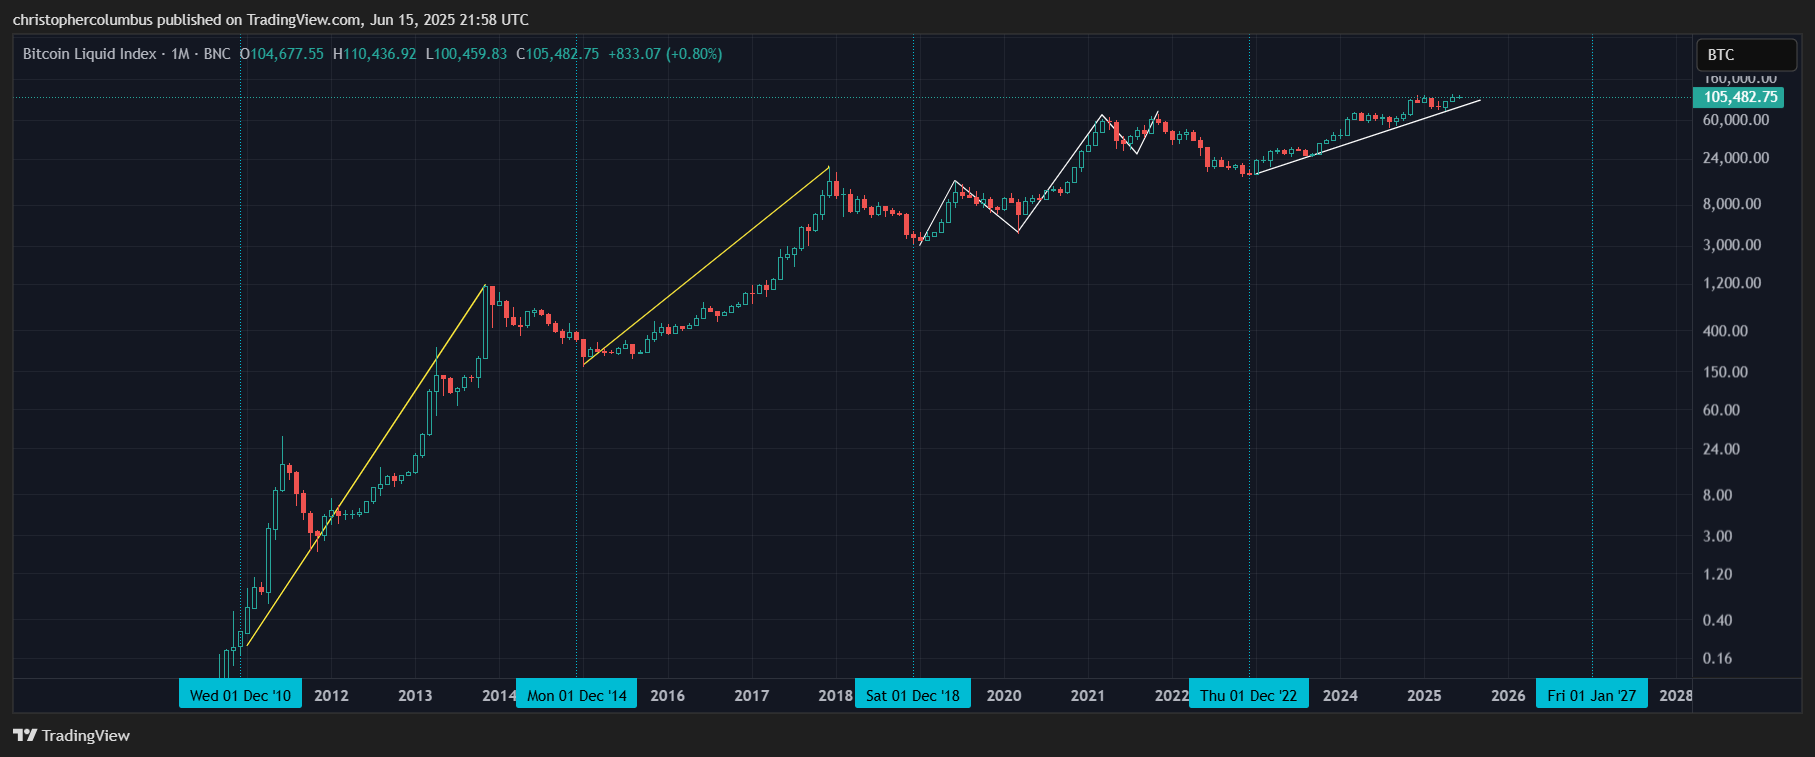
In looking at the above chart, one has to wonder how the 4 year cycle became so well-established in the minds of retail. You’ve the clean parabolic pattern of 2014 to 2018, but it hardly reflects the previous pattern… which is irregular. Of course, it was the 4 year halving narrative that dominated at this time, and where that halving event was supposed to determine price action. This was a version of fundamental analysis outside the discipline of technical analysis [where price action is all that matters].
The writing was on the wall for the idea that cycles would repeat regularly and parabolically akin to the previous… and it was also on my earlier articles. This narrative based on halving was soon invalidated as its predictions failed to eventuate. Instead the returns were radically diminished as compared to the astronomic returns previously [though returns now are still stratospheric]. A double top eventuated last time, where the LGC channel predicted price had got ‘toppy’.
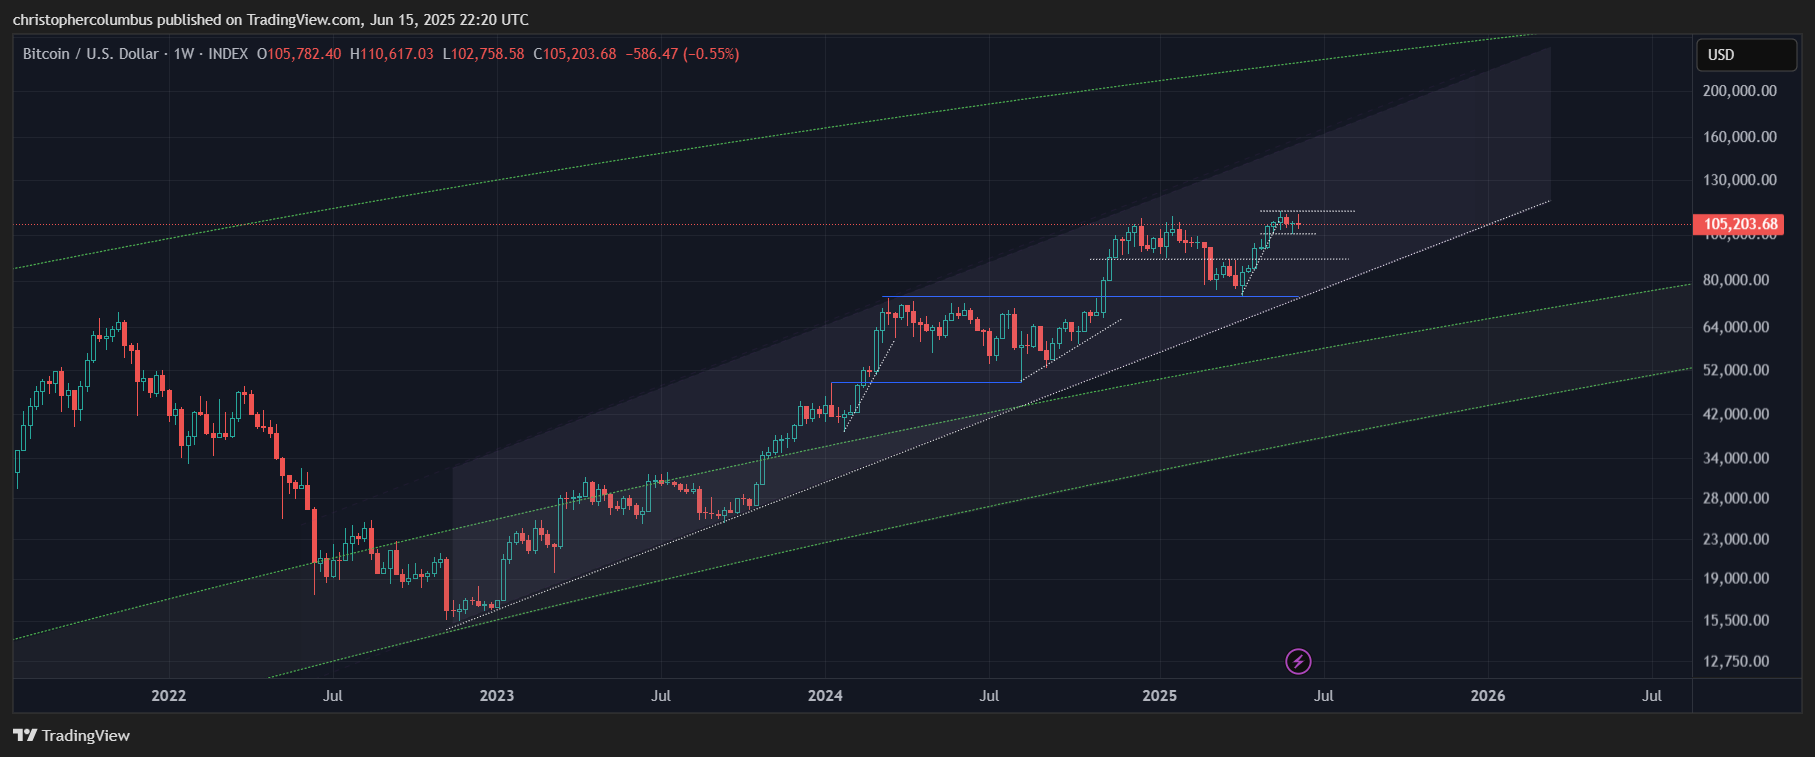
Whereas the previous cycle was irregular [in first a ‘mini bubble/ speculative episode’ followed on by a double top], this time round we have a remarkably steady and modest increase of price over multiple years - the transition to a more technical market as predicted.
Of course we’re all asking ‘what now’. Technical analysis cannot answer this, for that would require a claim to clairvoyance which is quite beyond its discipline. But it can sketch a possible price action based on the extrapolation of the recent past, a 4 year cycle [that strictly speaking still holds, the LGC channel and a subsequent correction at some point. This would provide the investor/ trader with some confidence [always hedged] in sitting on their position while also anticipating a correction at some point that would not take them by surprise.
This Cycle
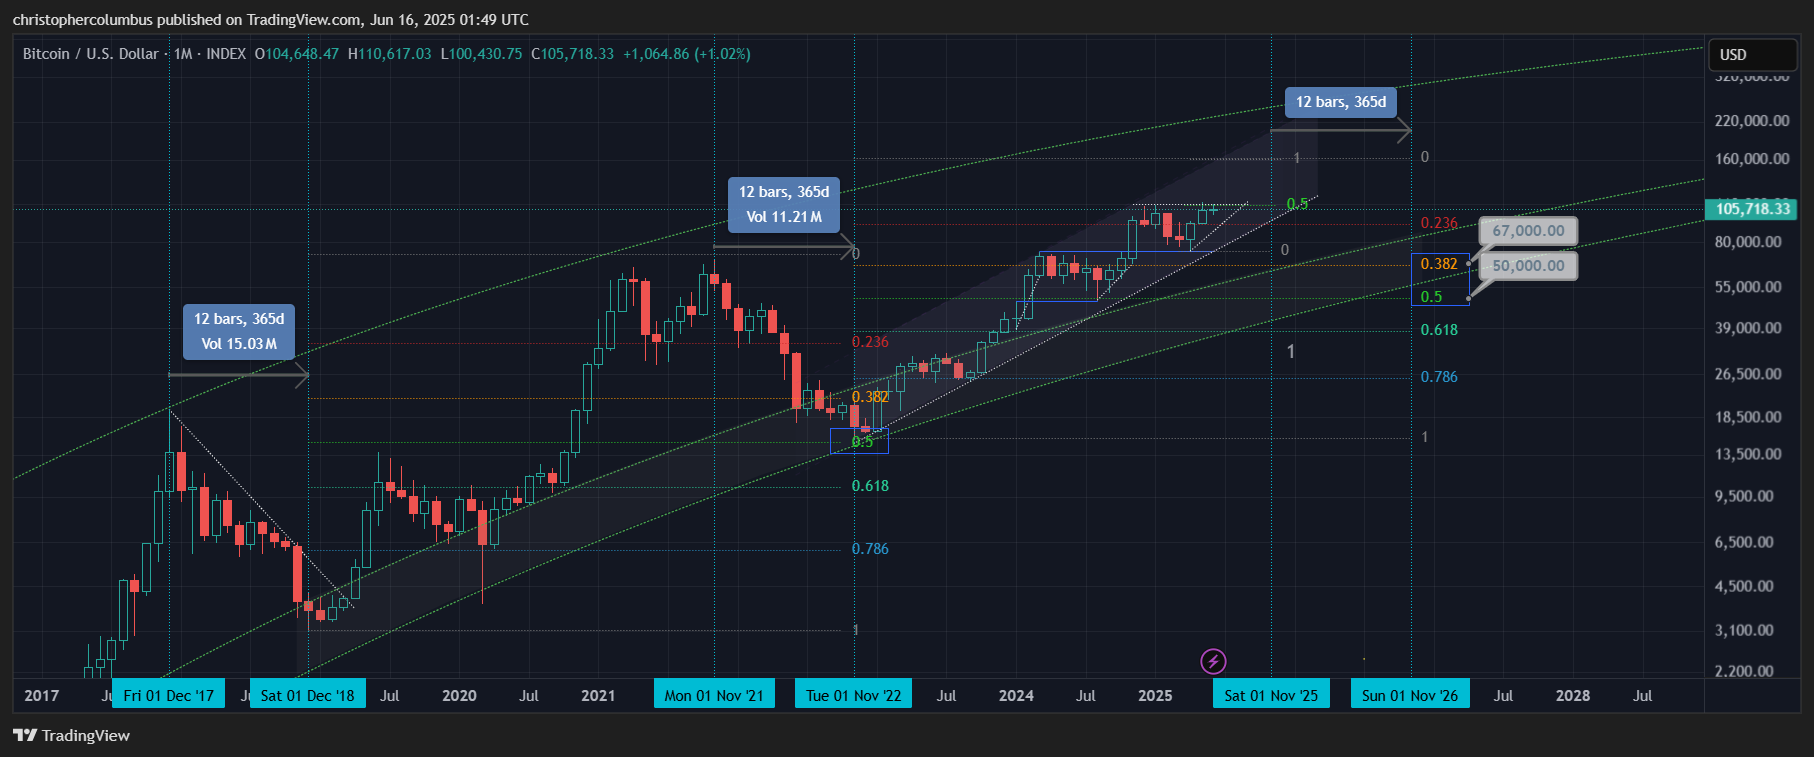
The advantage to be had in a maturing cycle is that it becomes more amenable to technical analysis. We can therefore zoom in onto the cycle itself and map a technical framework onto it. While the macro model of the LGC channel might be put aside for the moment, it also remains as to provide some parameters within which total price action might develop.
Where some might be disappointed with the lack of parabolic action, the technician on the other hand is satisfied to see the remarkably technical nature of the price development over the course of multiple years. The moves up and subsequent consolidations in price set up nicely for the next move up [remember, parabolas tend to correct harshly].
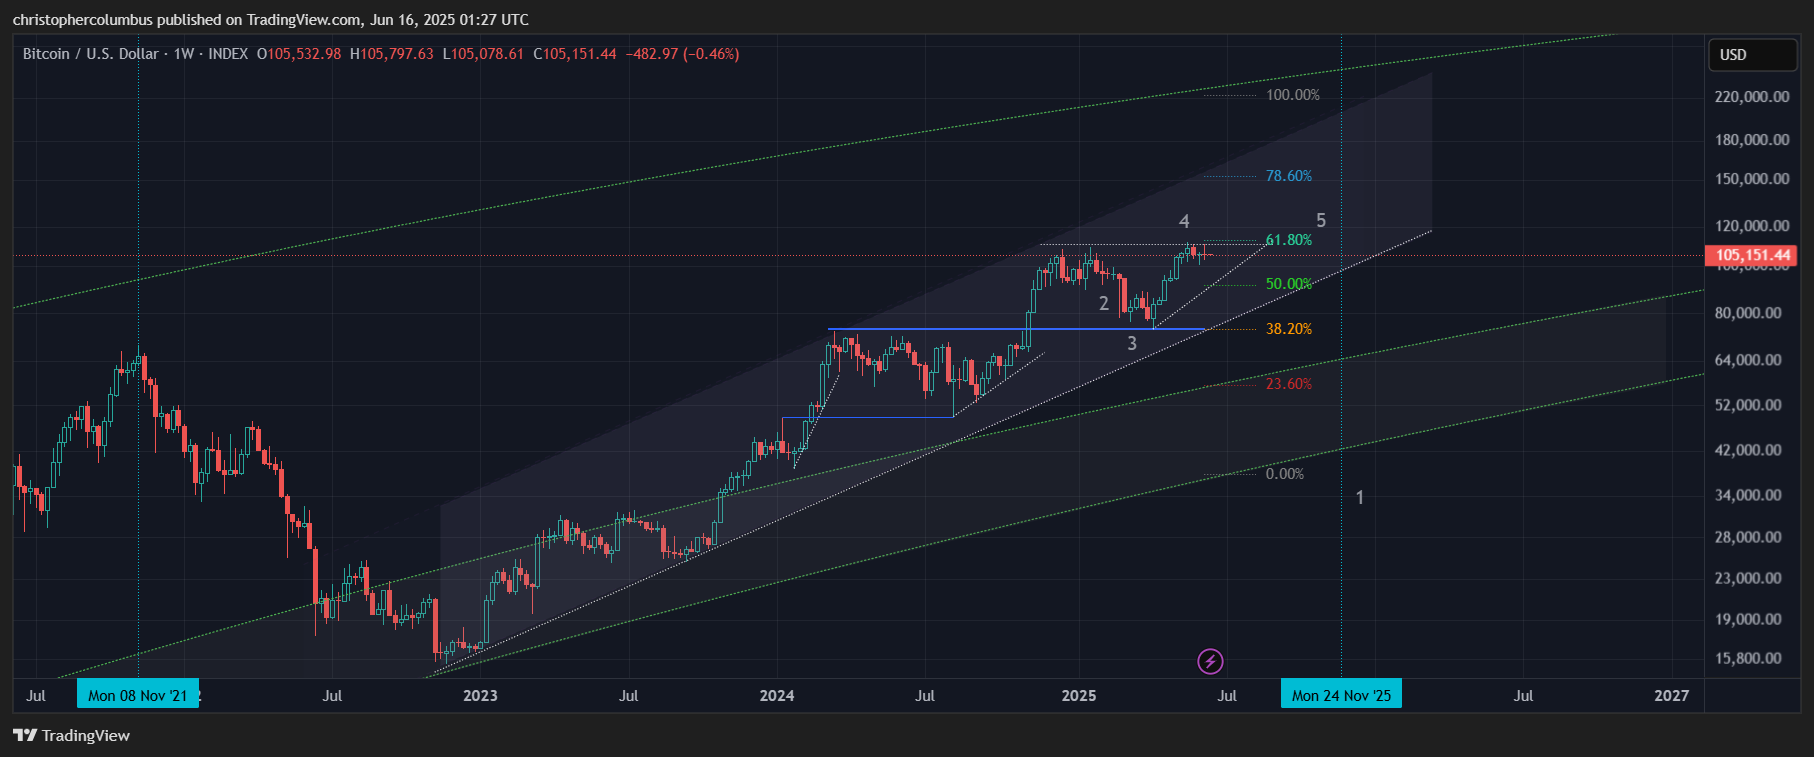
In keeping with the medium term/ cyclical technical conditions of:
- The 4 year cycle
- A recent solid correction of all-time-highs
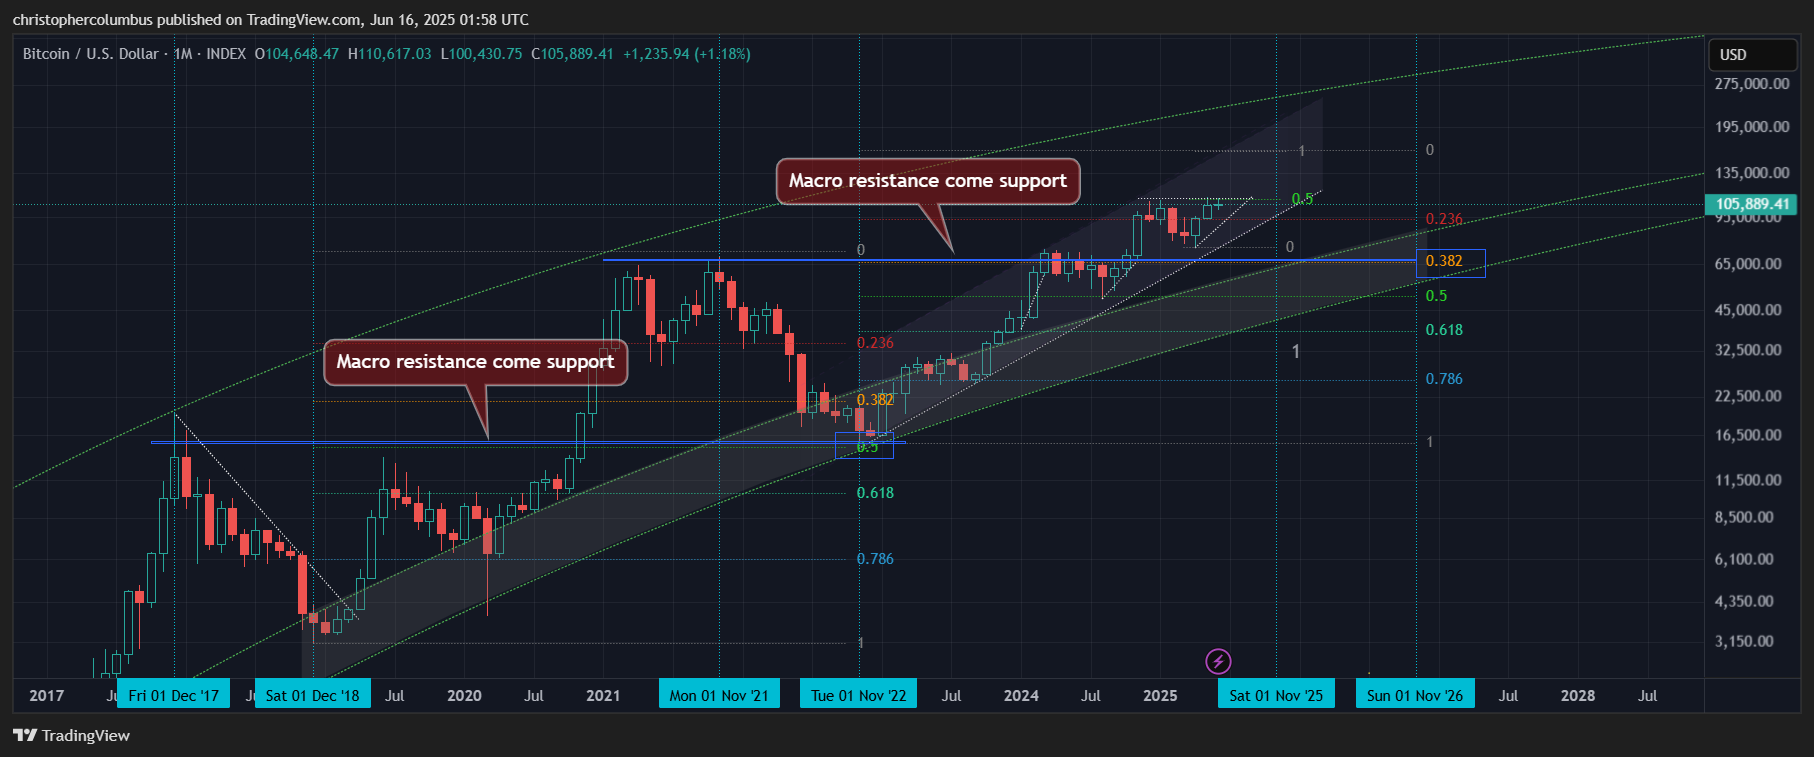
- Resistance come support
- Resistance at all-time-highs
- Only a 61% traversing of the LGC channel
… it looks reasonable to be expecting a continuation of this cyclical bull market. Sentiment-wise, this current market is relatively subdued without that over-heated manic stage you’d expect to see at a top. You’ve also a market that has got quite used to a nominal price that oscillates around the 100k… compared to the excitement seen a full 6 months ago now when price was first pushing those highs. In short, from the technical perspective, all systems go.
Looking Ahead
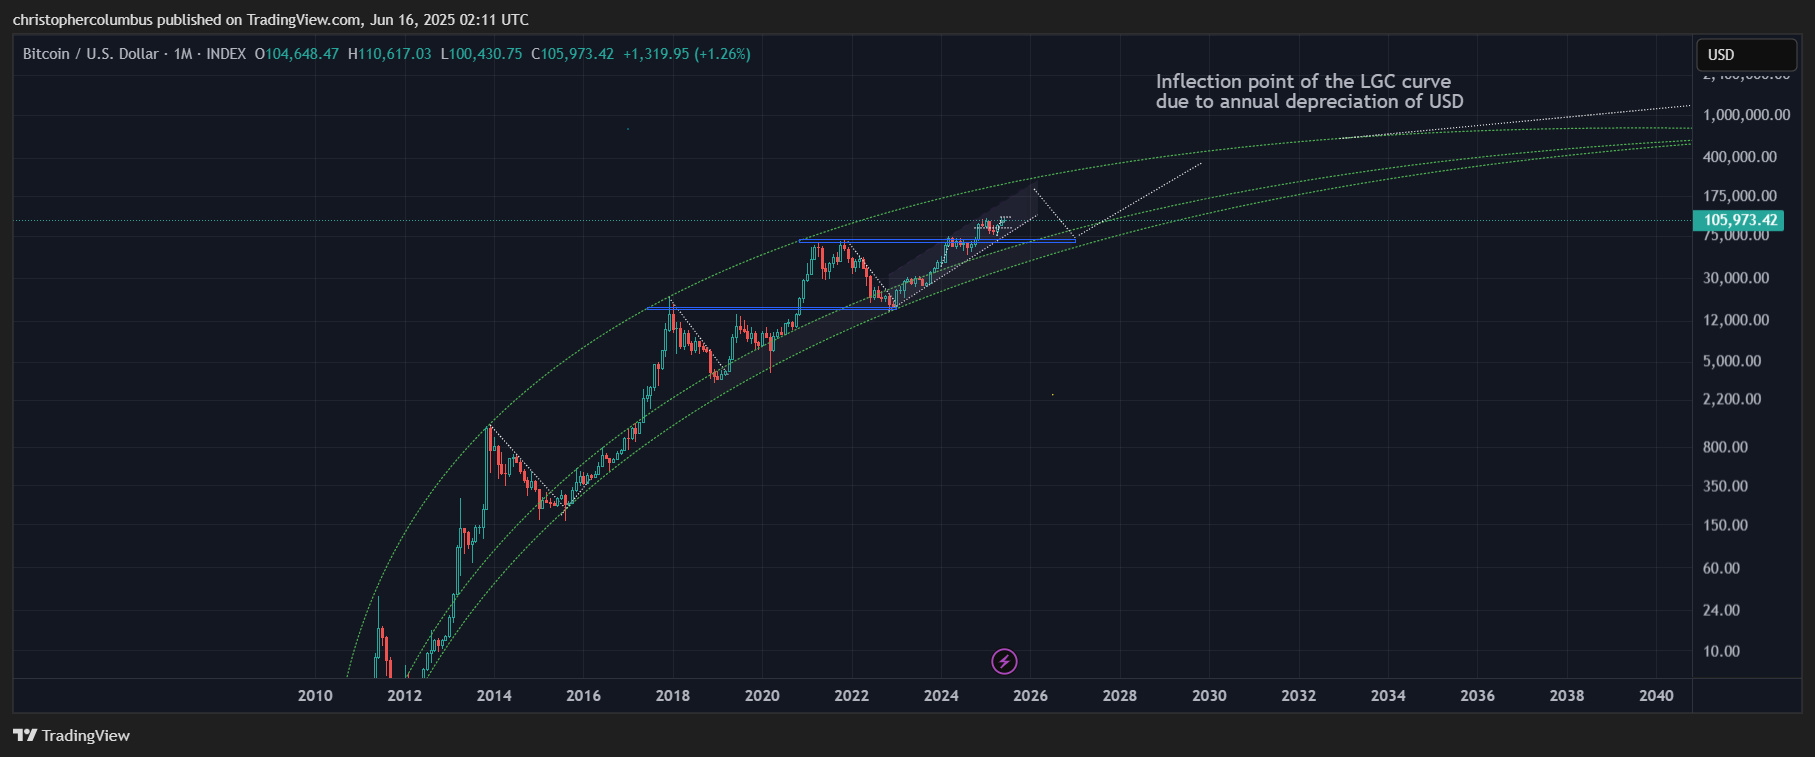
My aim here, instead of projecting yet again a top possible price levels for this cycle, will be to look at the more macro angle, where a future correction from a future potential top might be sketched…. and in both a technical manner in keeping with the technical nature of this particular cycle, and the LGC model/ channel.
A conservative technical target I have been looking at in many charts and previous articles is one of 160k [it could go higher in a manic market].
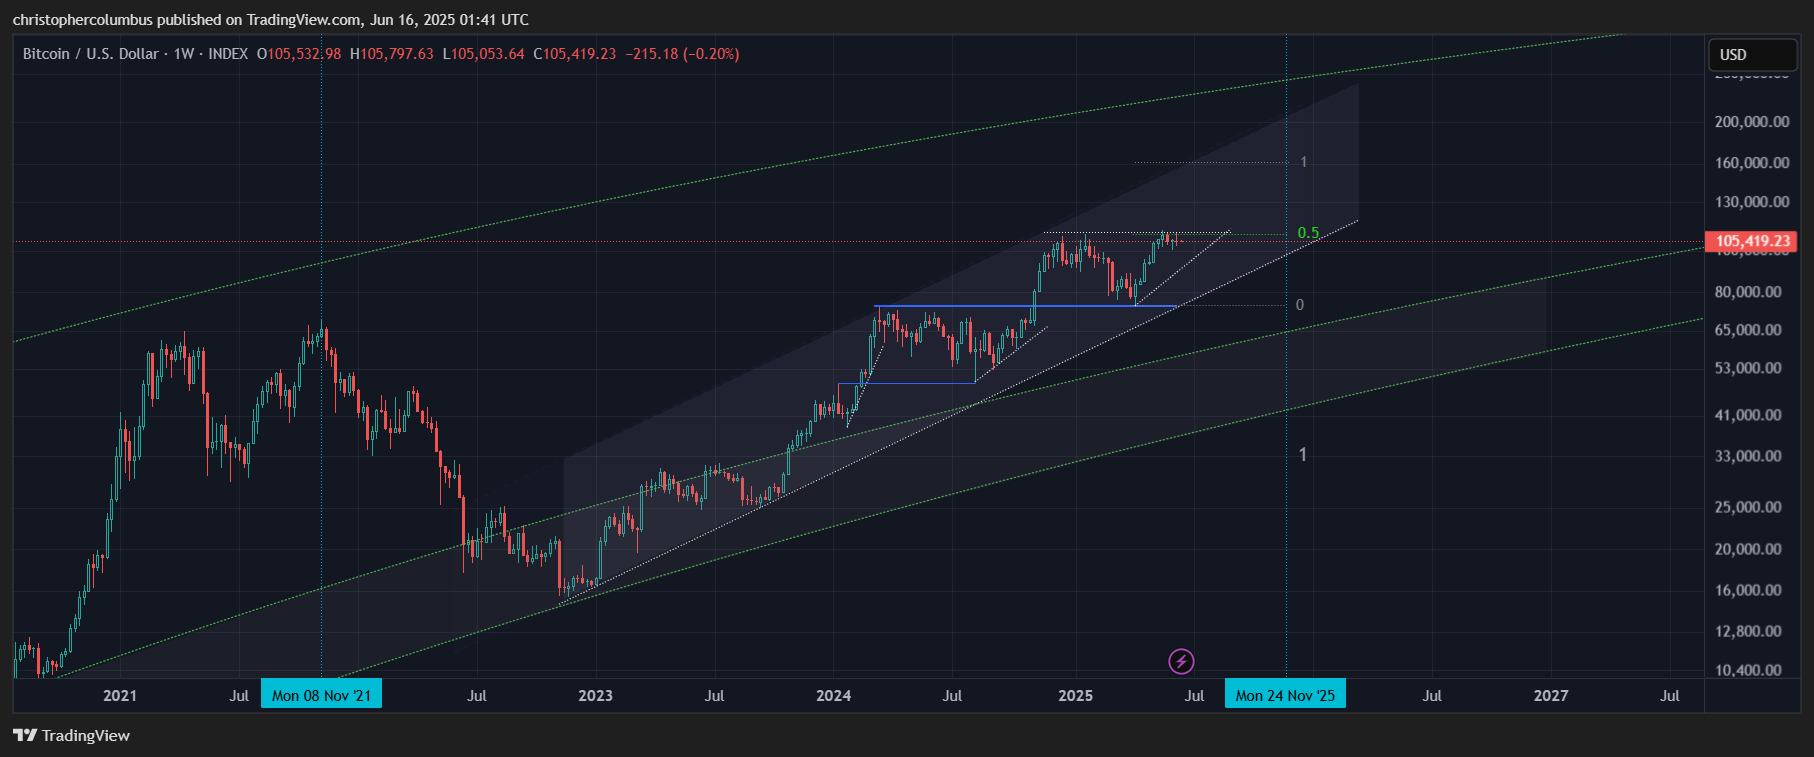
But here I’d like to focus on the larger macro picture of what a future correction of that peak would look like. Here a comparison of this cycle with the previous is helpful. I notice that not many commentators are looking at this at the moment as no doubt it is a little unpopular… as no doubt the LGC model has been all along [realism]. The rationality of technical analysis in no way concerns itself with what is and is not popular. Indeed, from the perspective of market psychology, what is considered popular sentiment-wise often functions as a flag for the contrarian.
Though a real 50% correction from 160k off the recent move up would be back to 50k, I think the 38% level correction is more likely - to 67k odd. This is due to the increasing maturity of the market - that the move up has not been so parabolic, that a 38% correction of large moves is common, that this would again be a level of macro resistance come support, and that the LGC curve itself would provide support at this level.
The is also a macro point at play here, where as the market increasingly moves towards maturity, so too does price move toward price discovery. An explanation of this is the increasing capitalization of a currency, which happens explosively at first and moves increasingly toward a plateau, or in other words, is a process of logarithmic growth.
Conclusion
The reader might be a little disappointed with this prognosis, but keep in mind it’s just a perspective, it’s realism, it’s speculative, it’s a stress test, and it’s based on the LGC model.
My aim is not to hype or market the chart, but to chart the market for the longer-term investor. For those that have bought the buy zone [lower shaded channel] and have continued to sit, and plan to continue sitting for multiple years, this outlook provides a very good basis for doing so. Preparing for possible realistic price developments [stress test] functions to defuse any alarm arising from a large correction, and one that the LGC model allows for while leading to future higher prices.
Such volatility in BTC along these predicted lines also explains why we choose to sit on a core position of BTC for the longer-term while trading the extra volatility of alts in the shorter-term… a way of skimming some profits along the way, where opportunity is always to be found in volatility.
Until next time,
Stay [relatively] safe out there,
Dave the Wave.