
Review of the Log MACD on Various Time-Frames
Dear Readers,

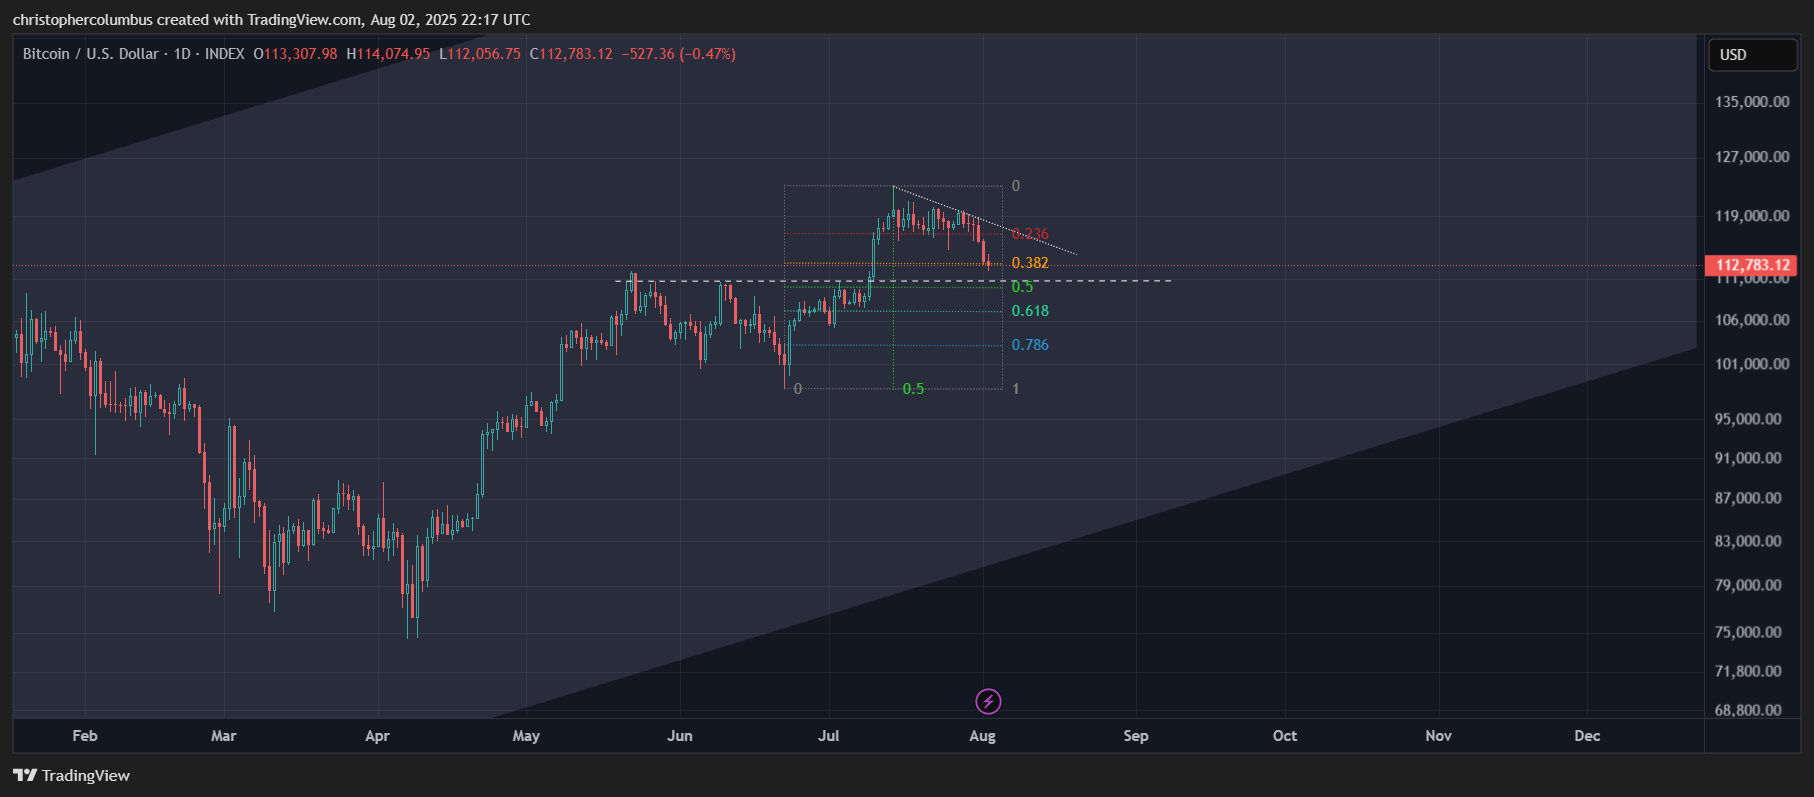
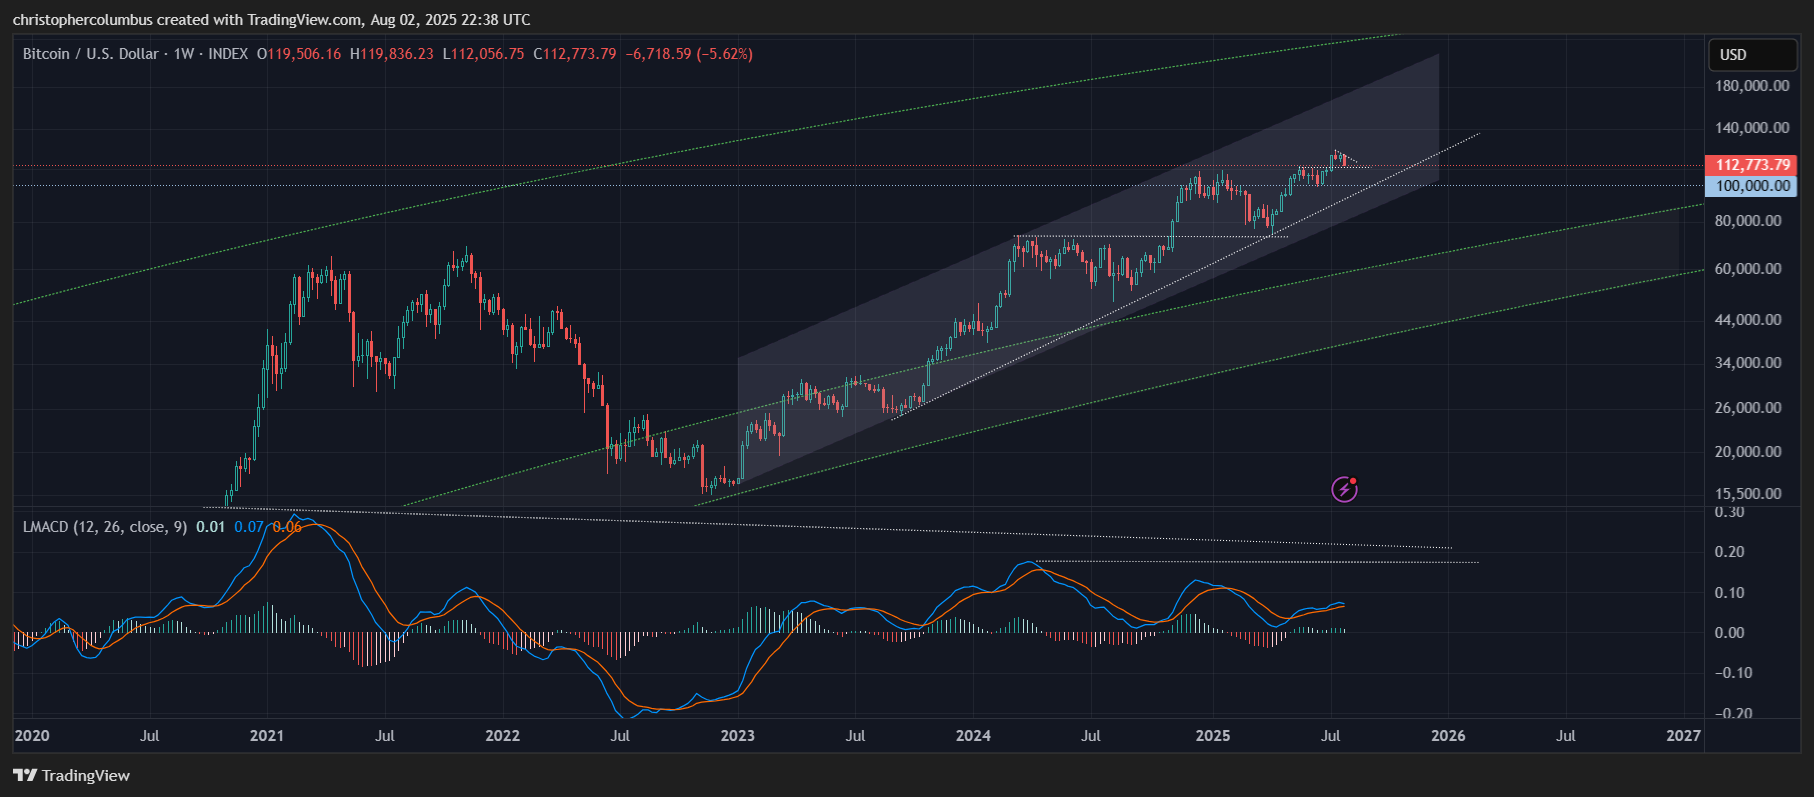
And there was the correction to 112k that I was looking for as based on a 38% real correction of the recent move and price coming back to a significant resistance come support level. Can price go a little lower? Sure, but at around these levels it’s reasonable to think support is there for another move up as will be seen by the technicals below. Also of note is that the current consolidation is as long as the previous move up.
Shorter-Term Daily Chart
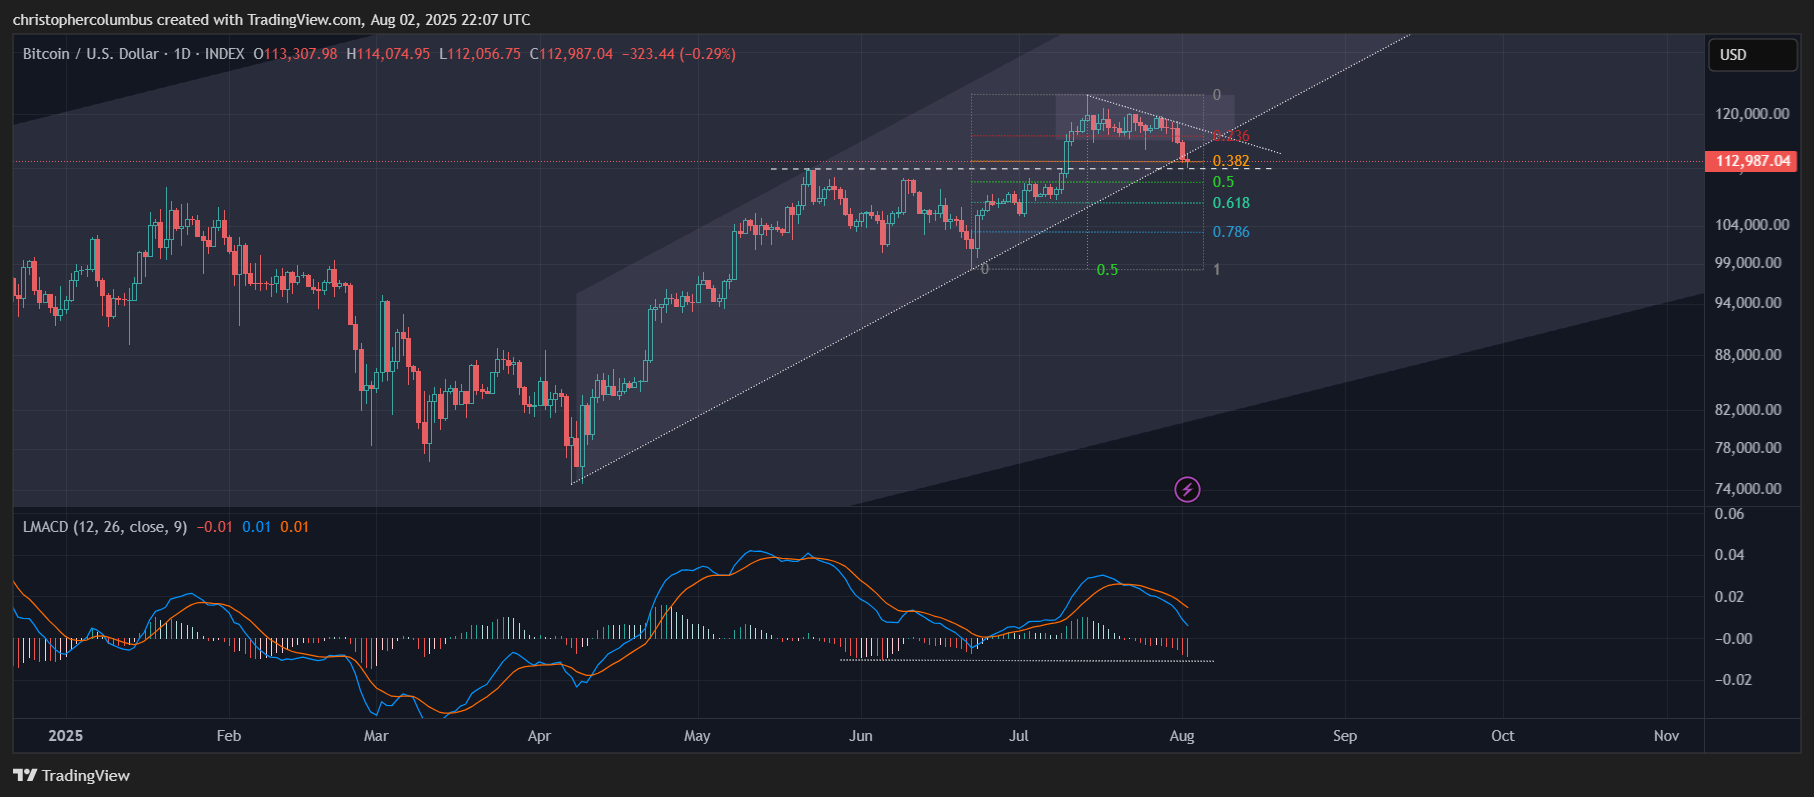
On the daily short-term chart above, we also see the MACD, a major momentum indicator, rebooting back to the zero-line. Of note is the extended histogram near matching the extension 2 months back to suggest a turnaround is due.
There is yet some wiggle room on the downside - the resistance come support level, if to be more strictly drawn, can be lowered a little to a later level where more resistance was found. Also the steepest upward channel is starting to look redundant. No cause for alarm as more stock is to be placed in the horizontal level as opposed to the diagonal. And so 111k becomes the most significant area to watch in the shorter-term in my opinion. If this fails, there is plenty of longer-term support coming through.
To summarize shorter-term price action, I’d say solid bullish technical price action with nothing too dramatic [parabolic] to either the upside or downside as of yet.
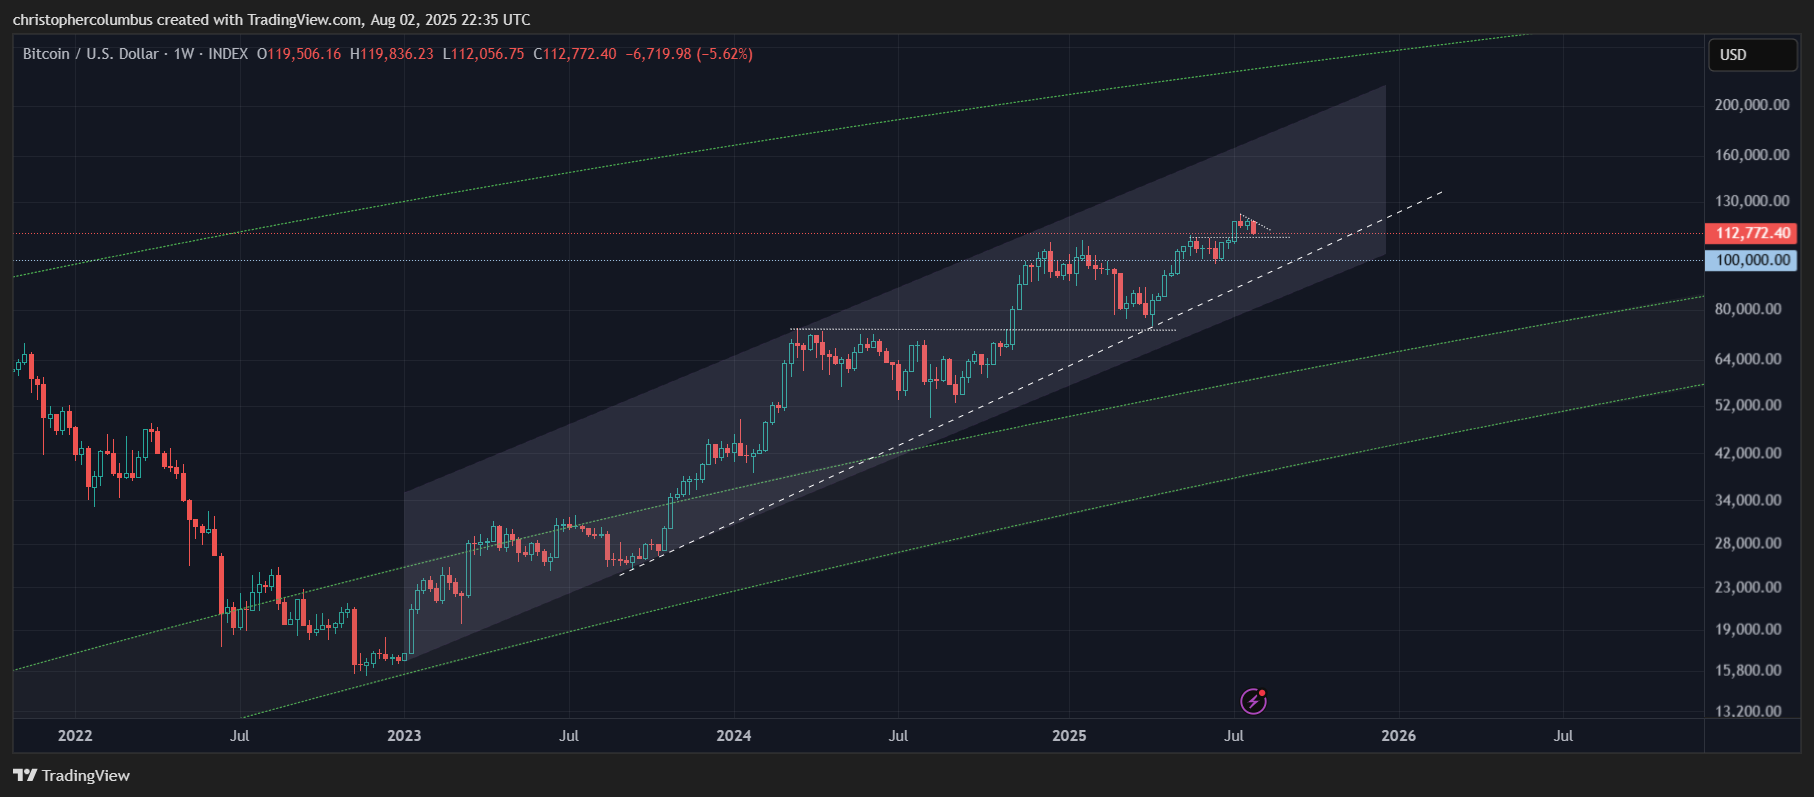
Medium-Term Weekly Chart
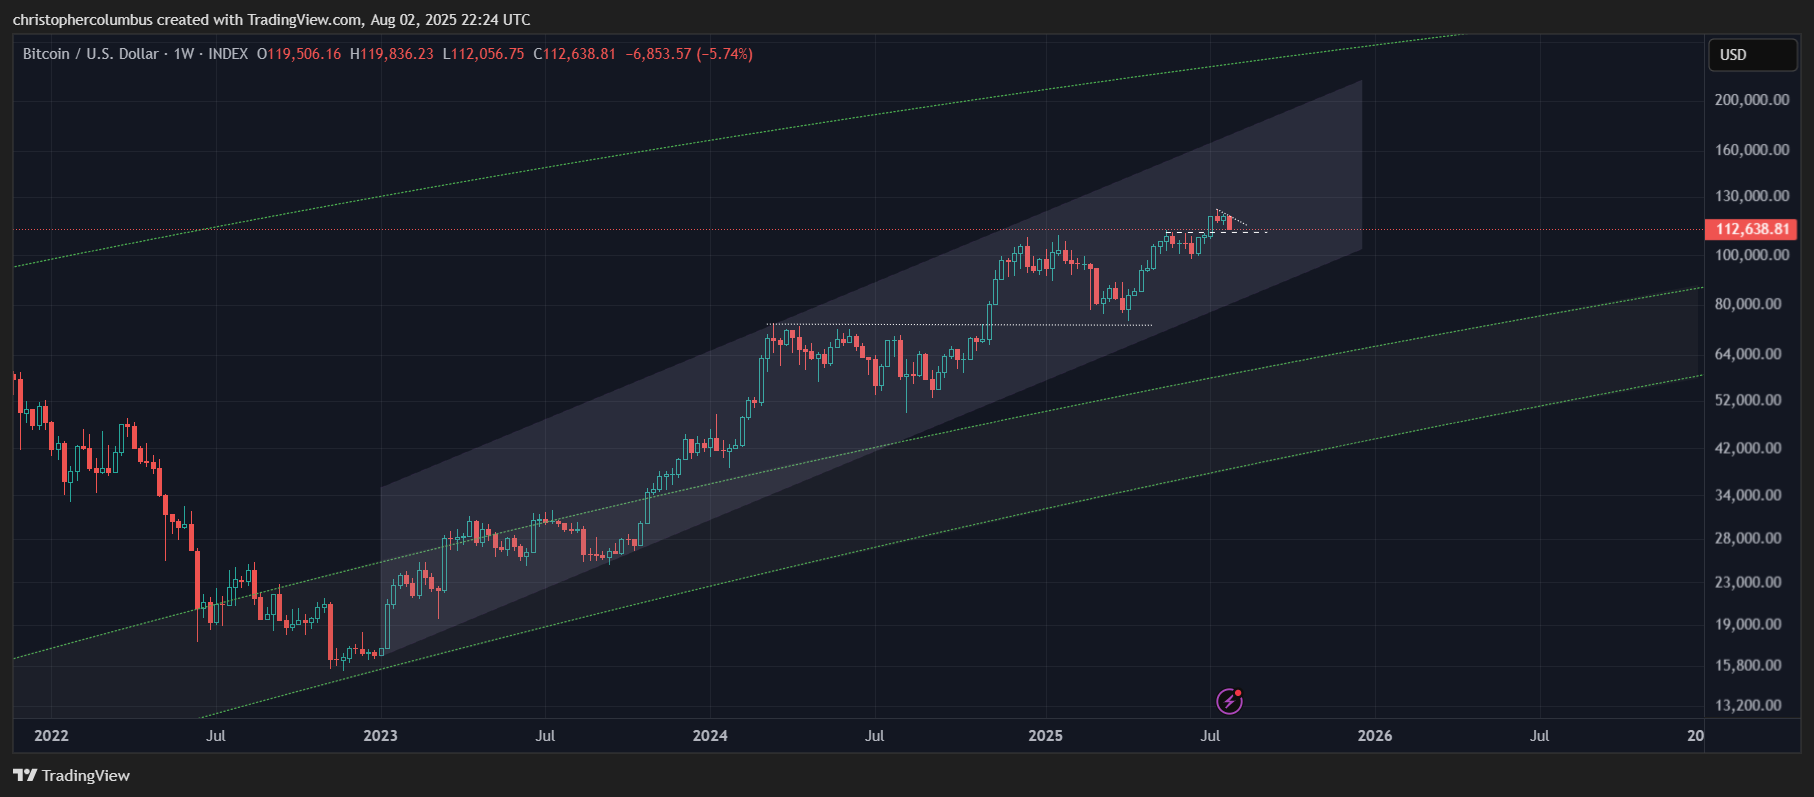
Immediately, we see that the longer-term chart on the weekly time-frame provides further context, and puts the more recent price action into a better perspective. Most noticeably, that steeper short-term upward channel [in the first chart] gives way to the less steep longer-term channel on the weekly chart. Price is currently located midway in the channel. Even if price corrected further into this channel [and through short-term resistance come support], it would still remain bullish on the basis of the longer-term technicals.
This is to say should price go below 111k, this would not entail that the bull market is over… even though such a move would no doubt create some panic in the market, and may even constitute that ‘shake-out’ event before the larger move up. Notice also the medium-term diag coming up in support of price to effectively provide a back-stop [more stock is now put in this one as it is on the larger time-frame].
In the same chart below, now with the MACD added, we can see that the MACD is low, not over-extended at all with price moving technically not parabolically. Technically, the weekly MACD is well positioned to continue up on what has to be quite a modest move so far. We think price is high, and yet when looking at the momentum indicator, price has not really made a large move at all [and also in percentage terms]. Indeed, it looks poised to make that larger move toward the upper part of the channel.
Long-Term Monthly Chart
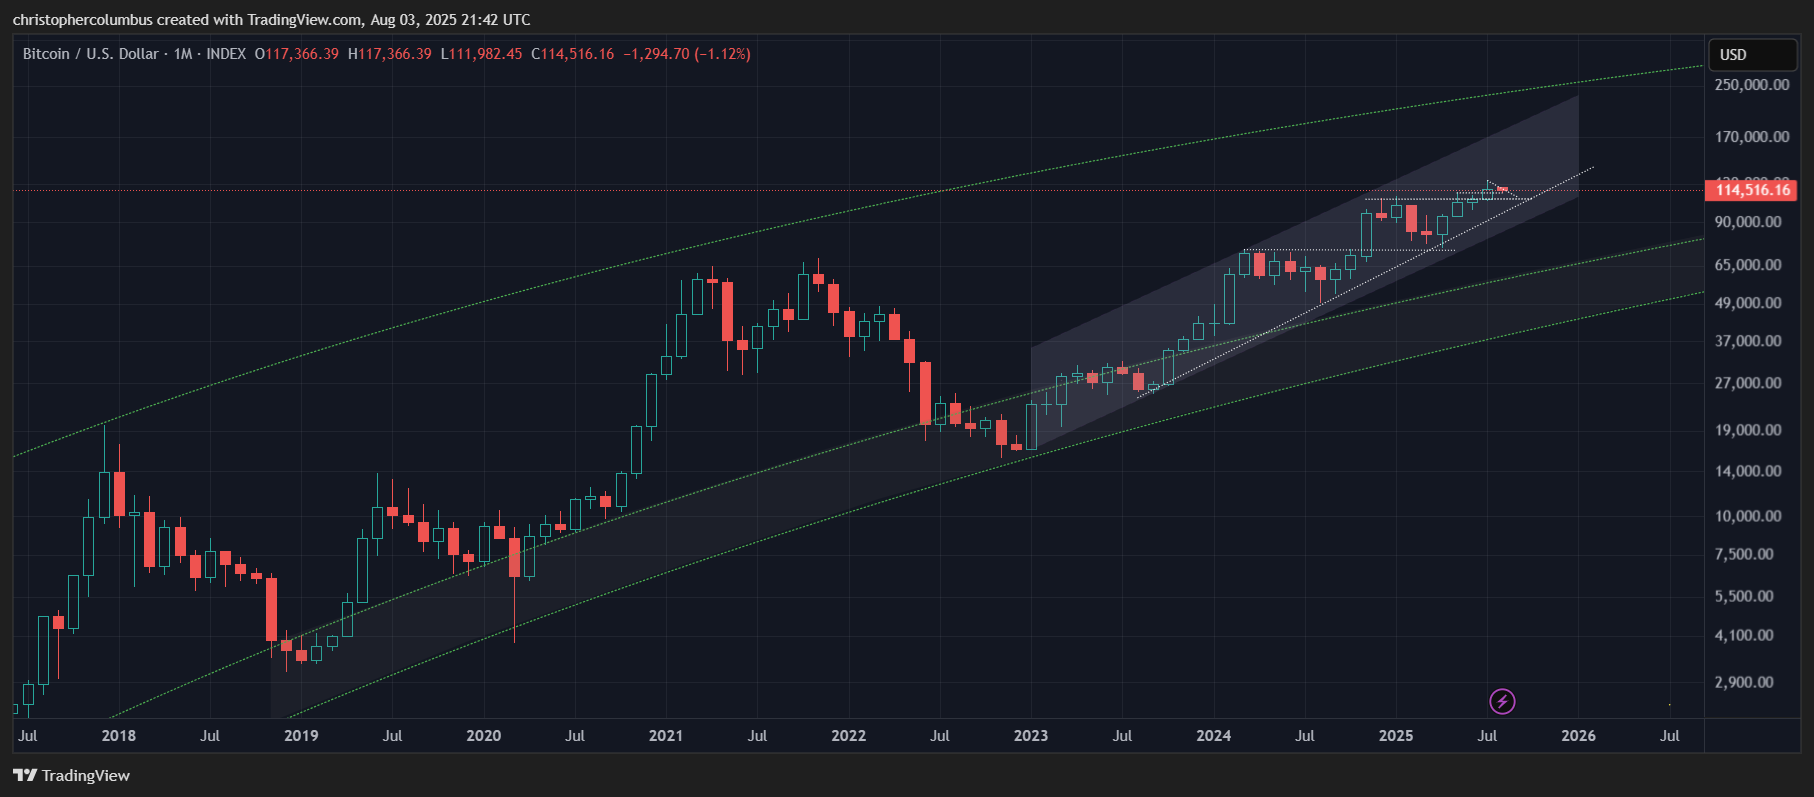
The very modest nature of the recent move is even more clear on the monthly chart. Remember, we think these moves of thousands of dollars are large, but in real terms, in terms of ROI, they are becoming much less significant. It’s the moves up in terms of percentage that we have to watch, and here we can see that the recent move has been very small. This in turn translates to expecting a smaller correction at a later date. And so finally to the monthly MACD.
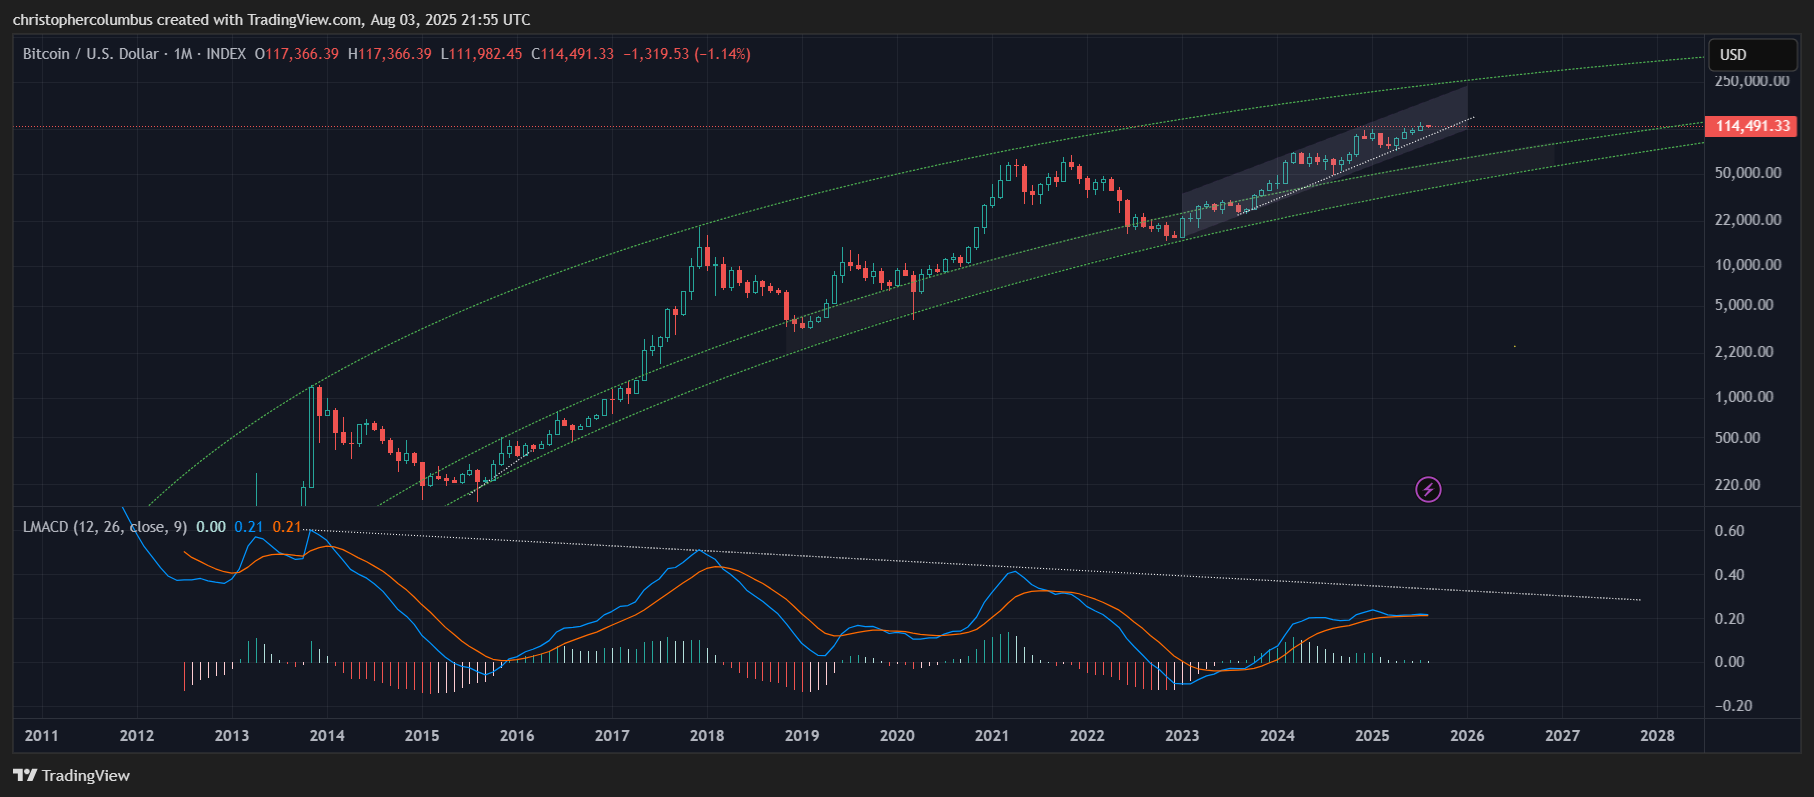
Of note here is that just as price is relatively high in the LGC channel though with room to run, so too is the MACD relatively high though also with room to run [the downward trendline in the MACD signifies a maturing/ less volatile market in my opinion]. Also of note is the sideways track of the MACD, high but stable and flat with its signal line. All of which is consistent with another relatively modest move up. This would likely see the culmination of a multi-year cycle, one that has been remarkably technical in nature as opposed to parabolic. This would suggest that a subsequent correction would be just as technical, i.e. less dramatic.
The conservative technical target of 160k by year’s end remains intact, and as supported by the momentum indicators of the log MACD on the longer-term charts. That target could well be exceeded in a renewed manic market as per the previous article.
Until next time,
Stay [relatively] safe out there,
Dave the Wave.