
Sentiment in the Dumps; Price in the 'Buy Zone'
Dear Readers,
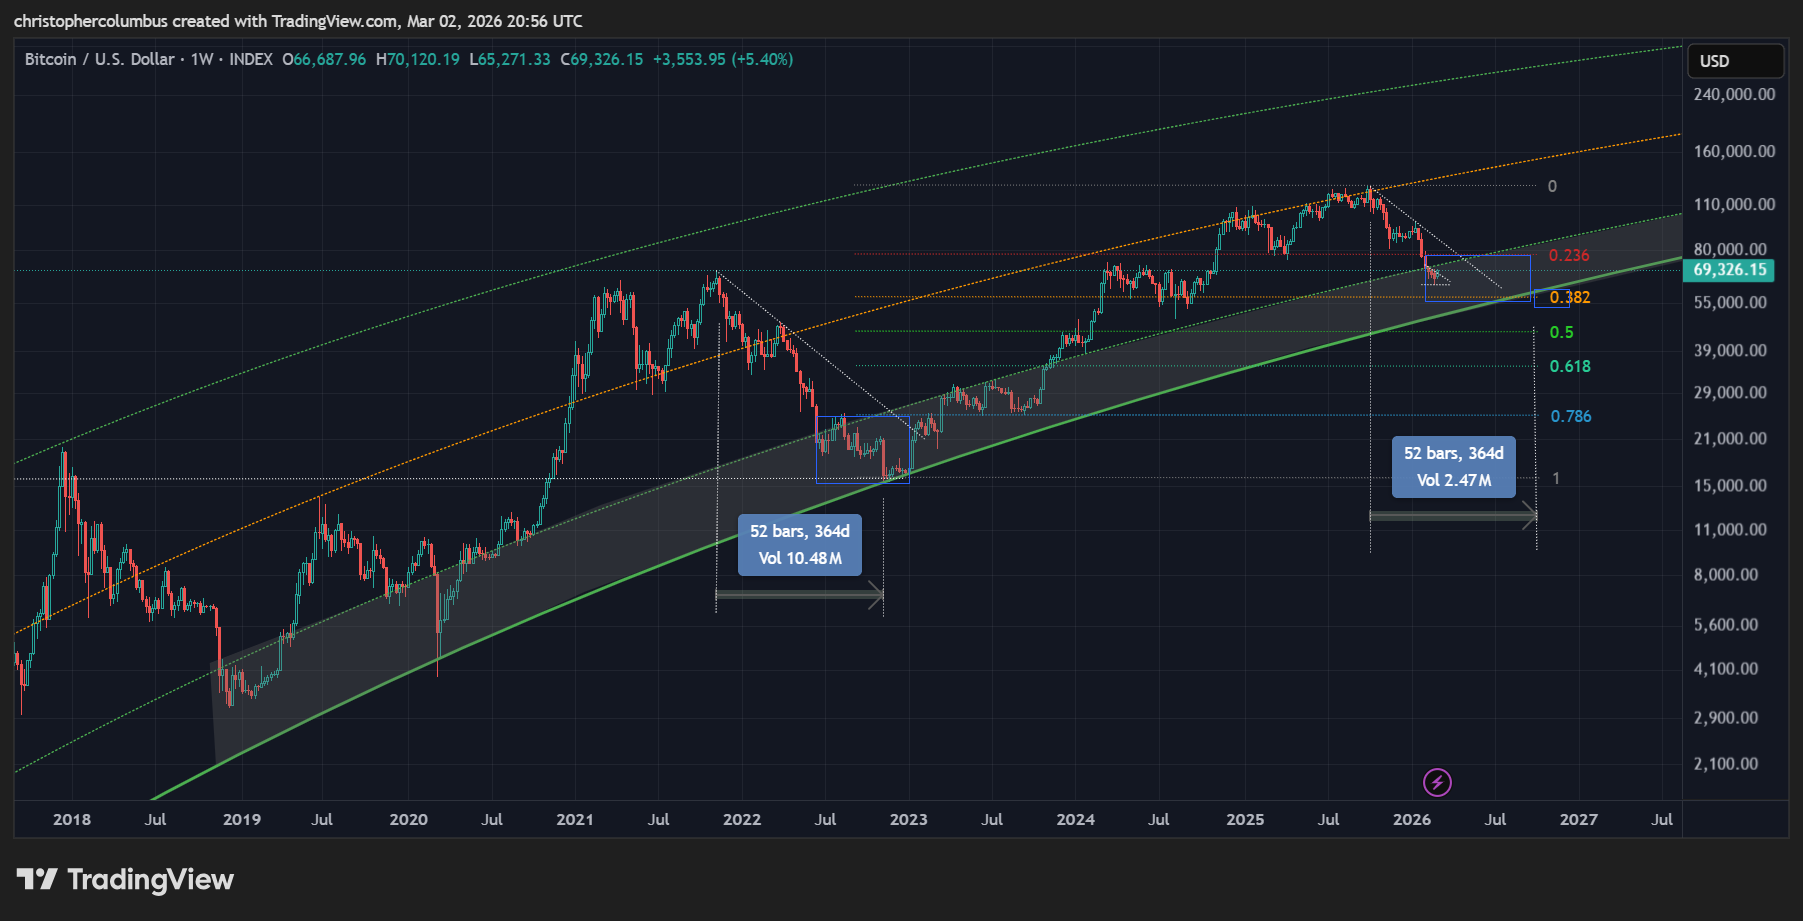
As we can see by the chart, there is good reason to think the worst of the correction is behind us. That said, this does not mean to say there it will not be lengthier, or that prices will not go lower. But those lower prices are likely to stay within the buy zone [and remain tolerable] according to the LGC model that has performed well since 2018 as well as a technical two level fib retracement of the cyclical move up.
Lengthier
Focusing on the length of the correction, I think it is reasonable to expect that this correction will continue for a year. This would have us currently near halfway through it. If it panned out this way, then price would be looking at a turnaround in the 4th quarter of this year, October. As the sketched blue box suggests, I’m thinking price will remain in the LGC ‘buyzone’ [shaded area] even if that entails price going lower while remaining in that area.
Lower Within the LGC ‘Buy Zone’
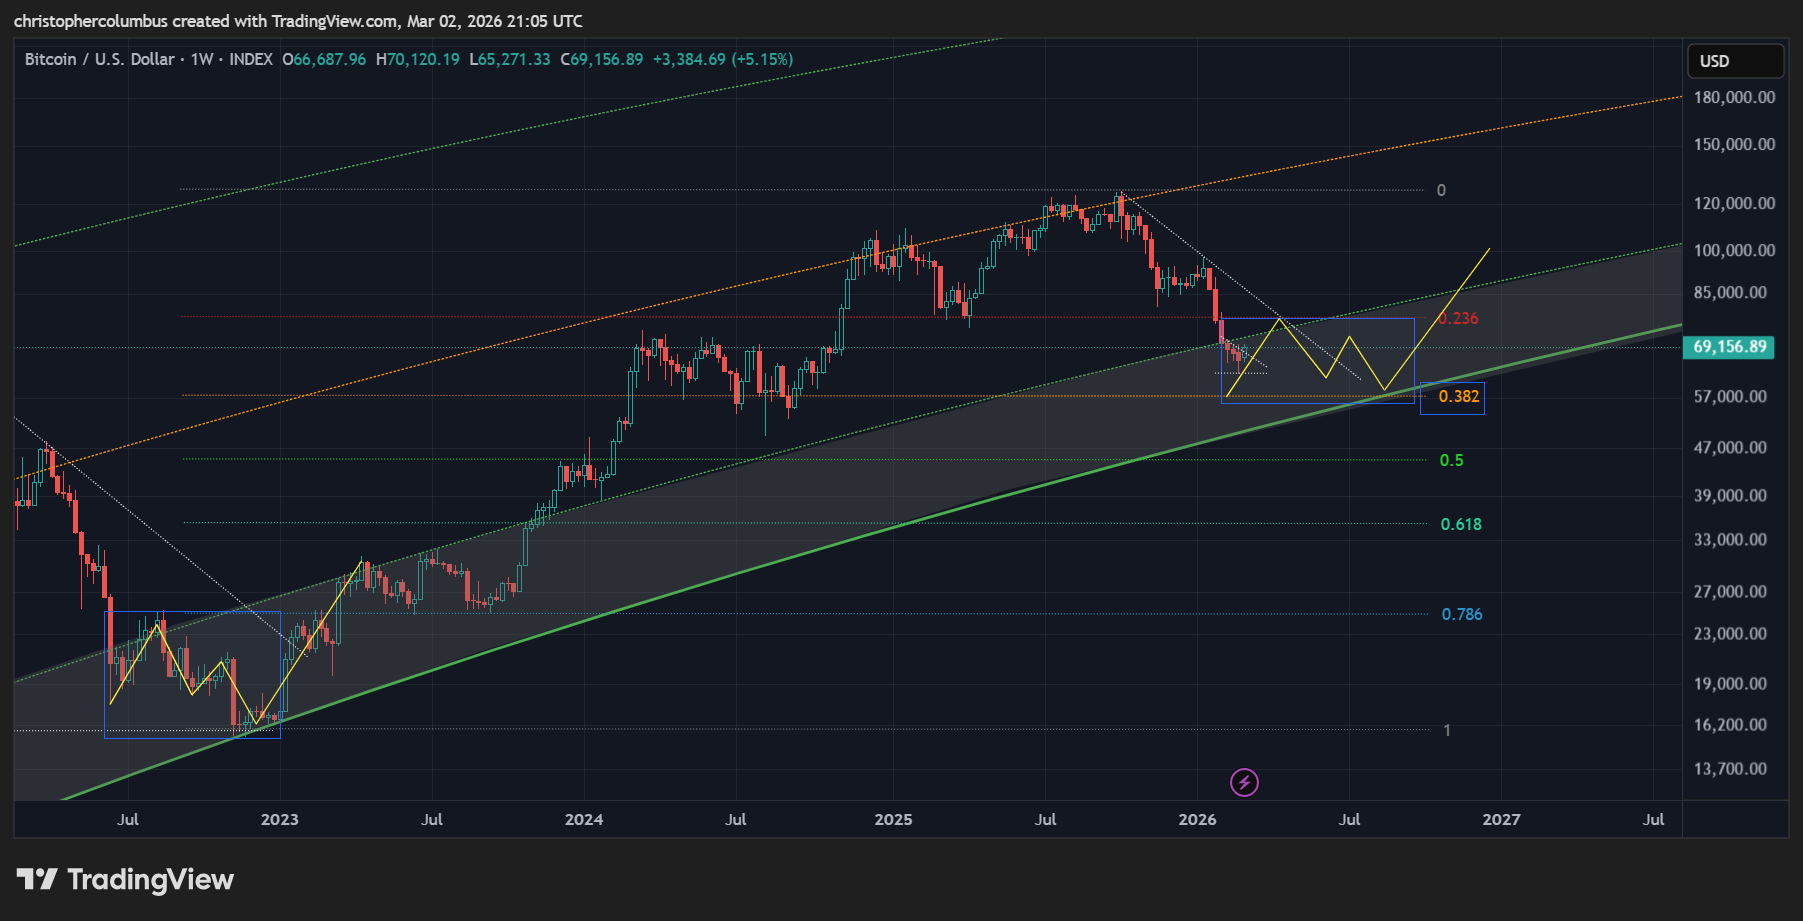
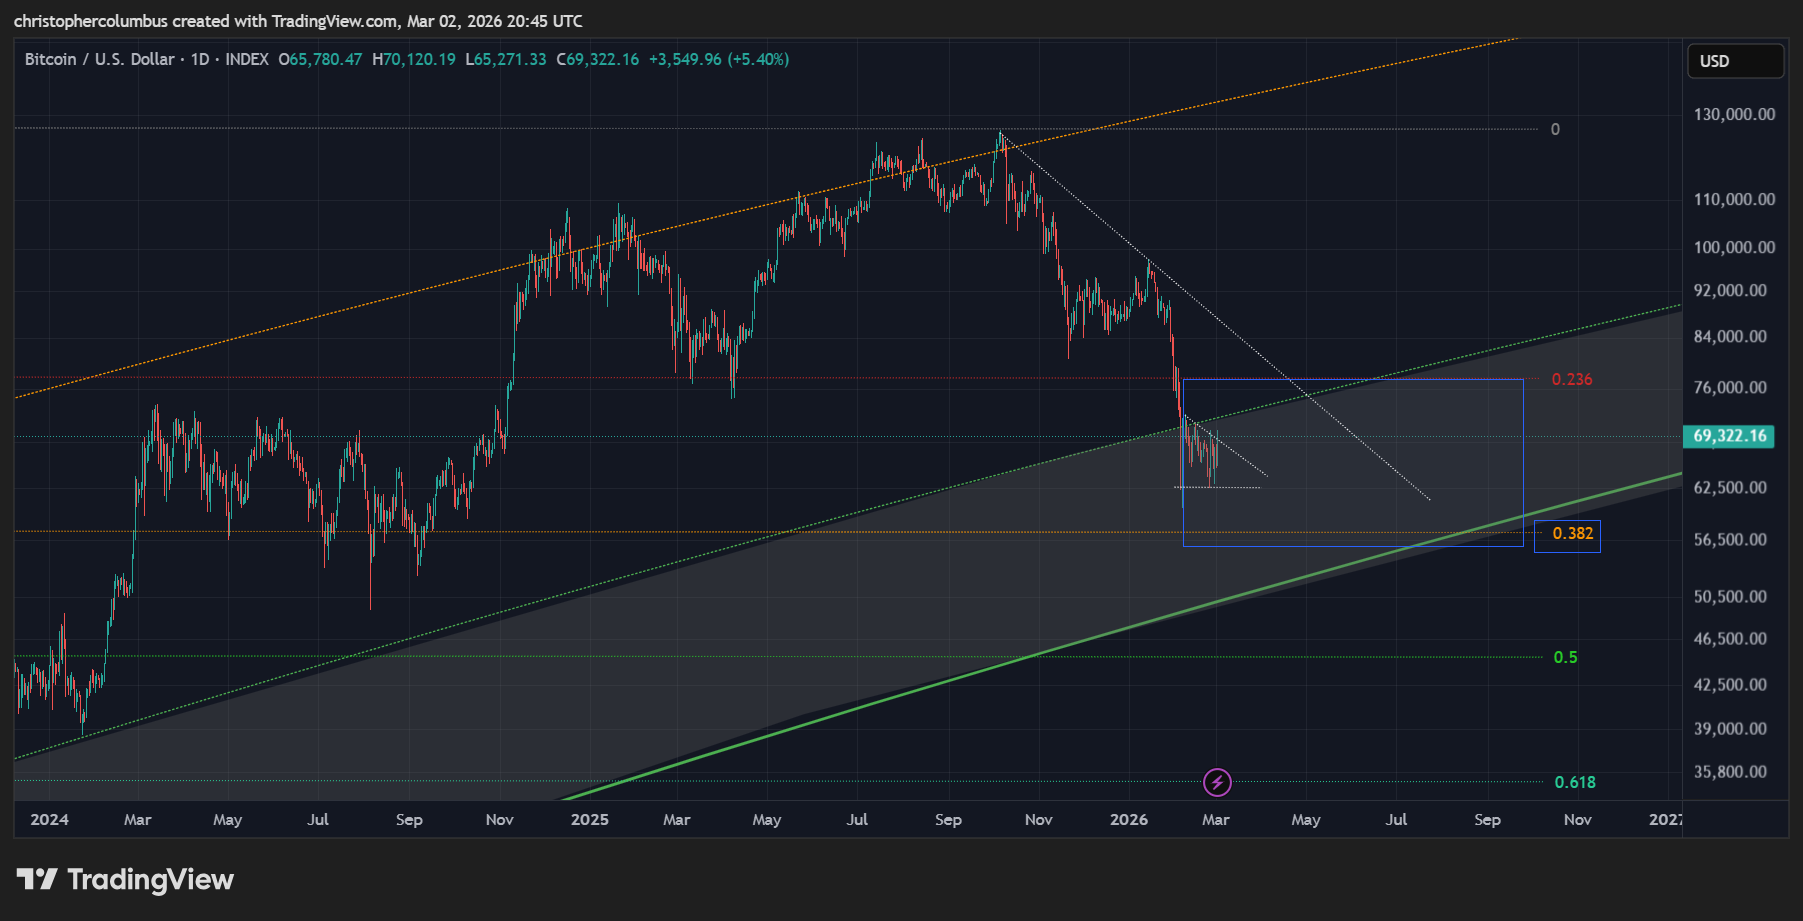
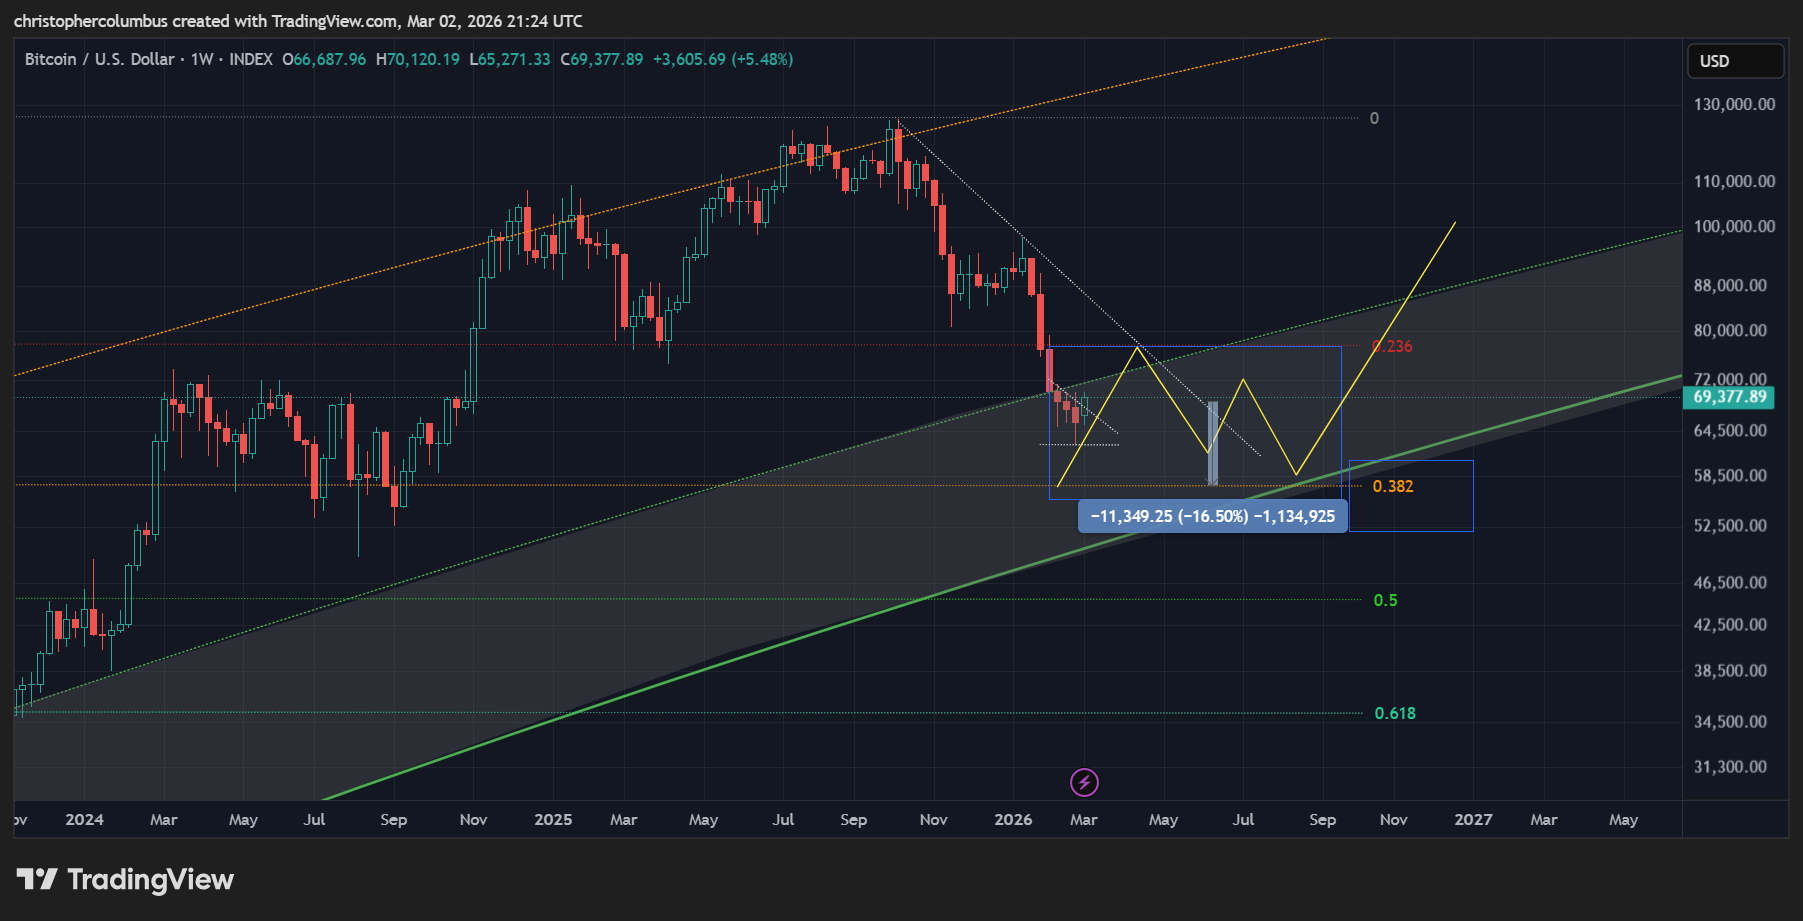
Something like the above would make sense for this correction to run its course: a move up meeting resistance, a move back to re-test the recent lows, a range formed, and then the breakout. Given the increasing technical nature of this market [as opposed to parabolic], I think price action is more likely to observe the ‘technical rules’ of something along the lines of this scenario - resistance, range, breakout, and all over a time period.
Something to keep in mind here is that price is now in the ‘buy zone’ according to the LGC model that has held true since 2018. This is the area in which previous investors [and for that matter traders] have done the best. The investor who has bought and held a core position continues to do well despite the macro corrections [as marked by the blue arrows]. These periods have also naturally been the periods of maximum fear and FUD.
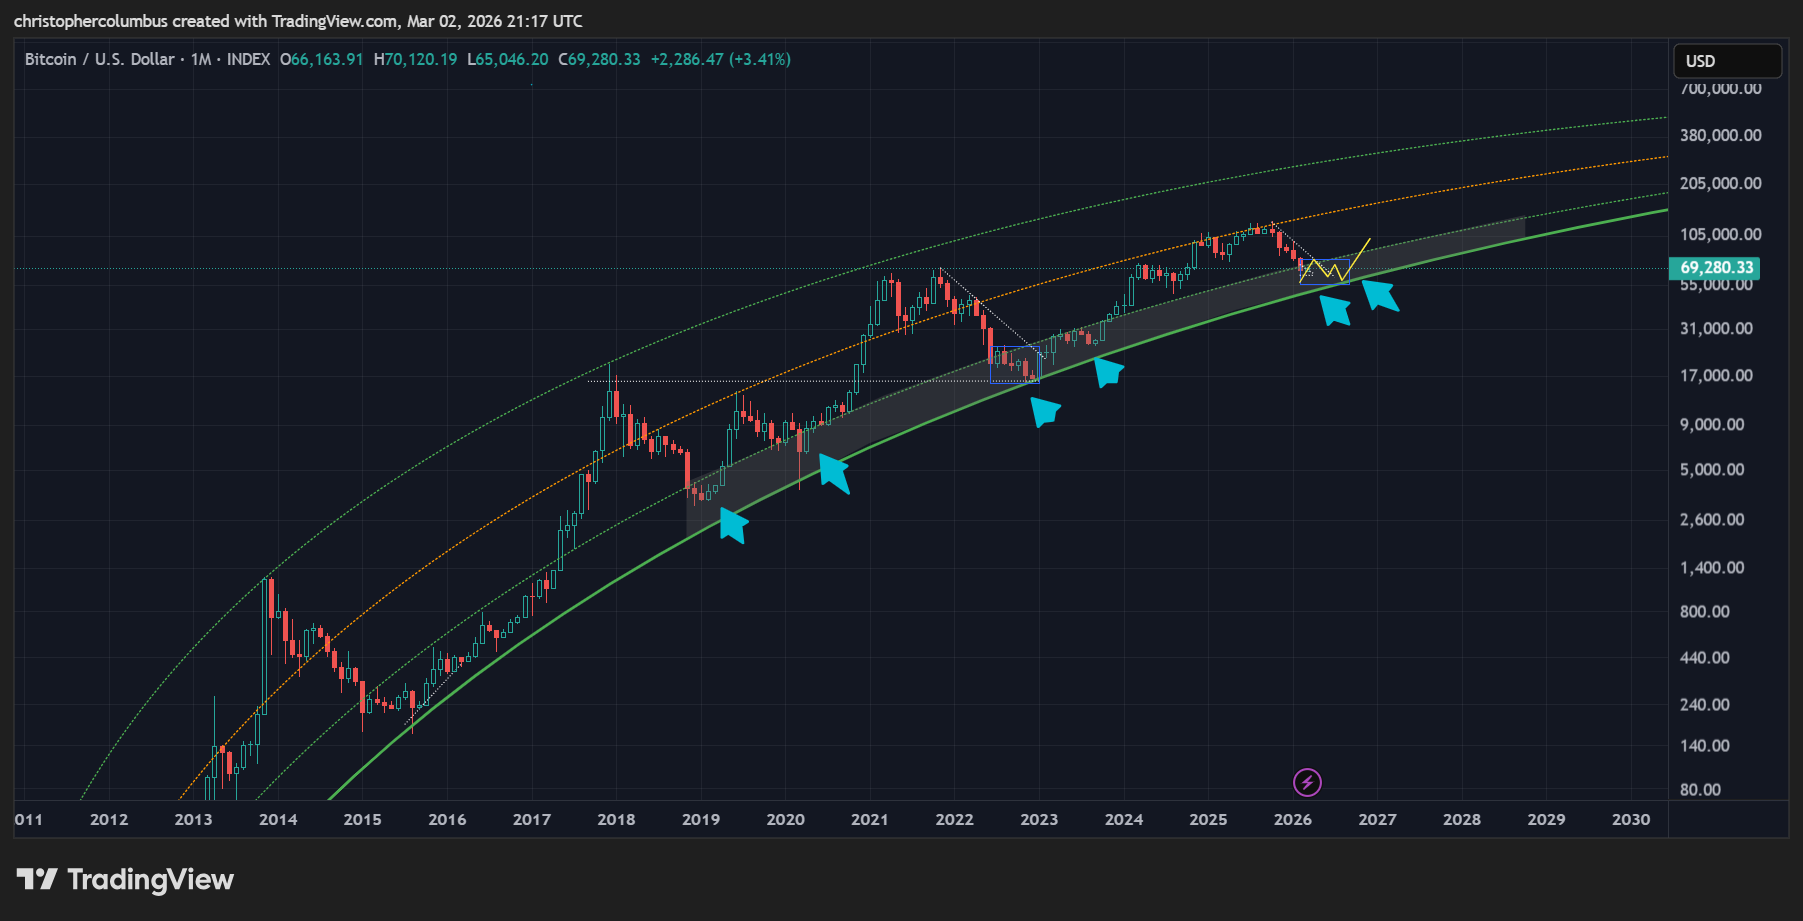
For a present day investor, a policy of averaging in over the course of say the next 6 months may prove most effective. If investing, one should be able to absorb some volatility to the downside while managing risk with position size/ amount of exposure. One could also think of it as a form of liquidity/ currency diversification given wider risks in the geopolitcial sphere. You’d have to think, given the potential to the upside, temporary volatility of say 16% to the downside is tolerable.
Two Fib Level Retracement
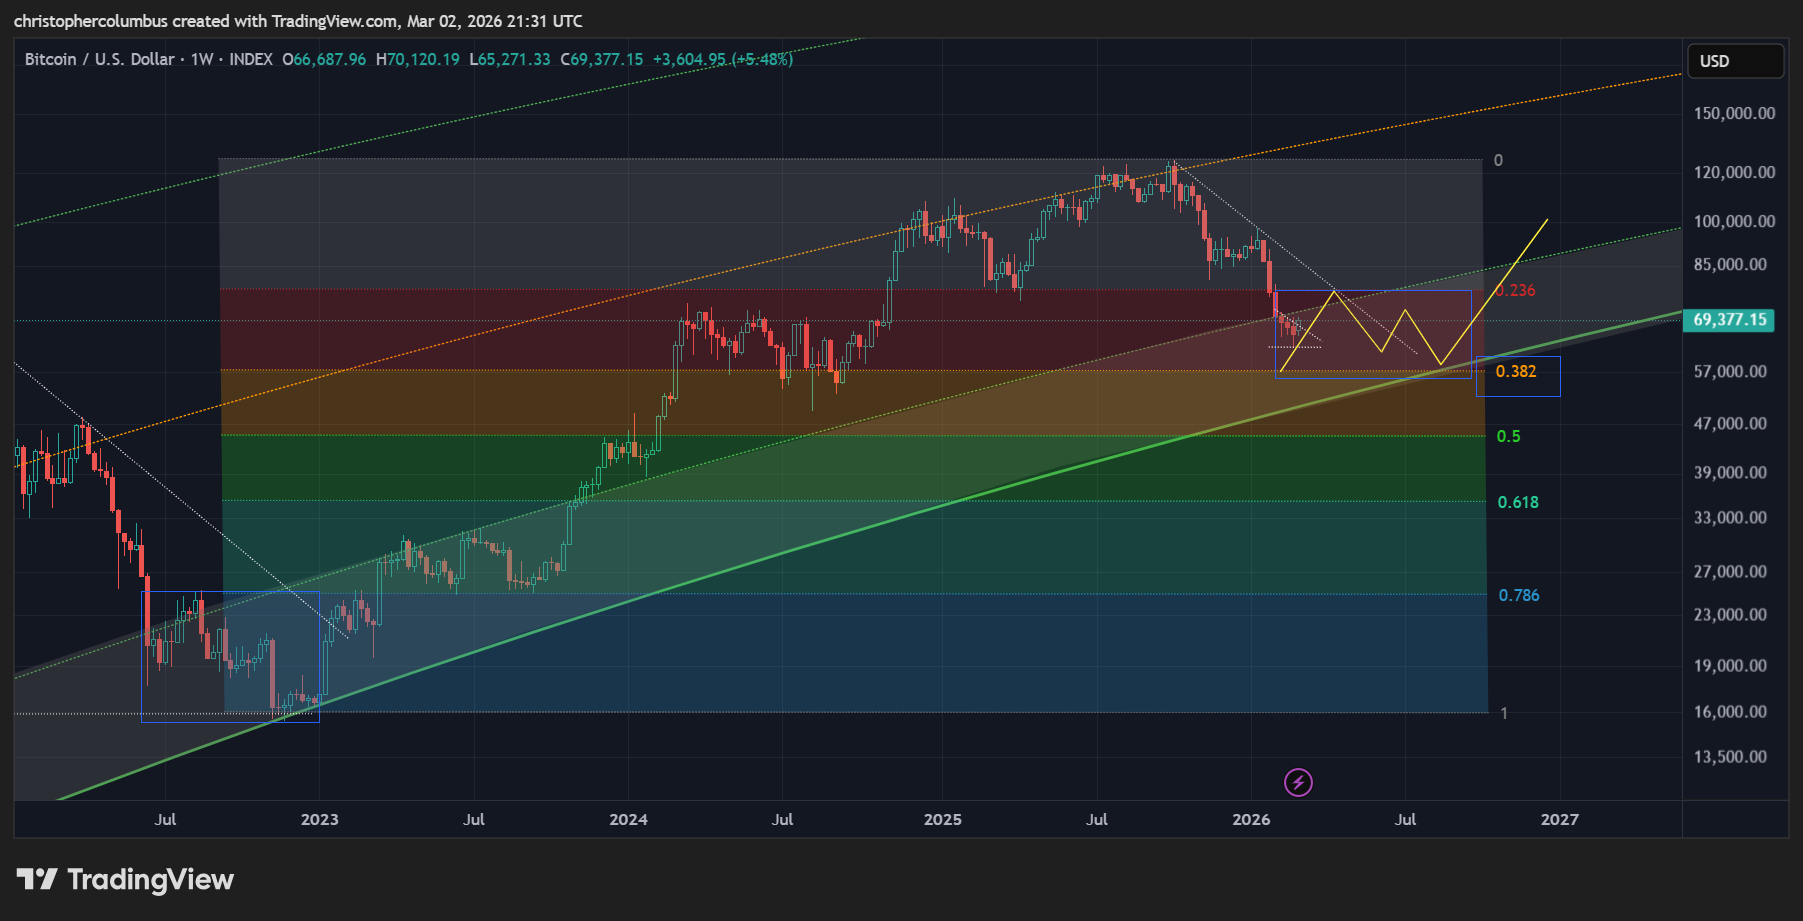
Consistent with the notion of a maturing more technical market, I think a 38% correction of the cyclical move up [further supported by the ‘buy zone’ of the model] is a reasonable outlook. Notice how the cyclical move up was unparabolic in nature, with consolidations for every move up and the failure to go parabolic at the top. In a way this can be considered a positive as it signals a process of price discovery/ price stability as the currency is capitalized in the free market [even though we all want higher prices here and now]. The disappointment came with the too great an expectation. Meanwhile, the LGC curve continues to hold.
Narrative
Finally, as mentioned earlier, the lows as associated with the LGC buyzone in the past have always been typified by maximum fear and FUD. From the contrarian perspective, that price heads up on the maximum of negative sentiment is not a paradox at all but simply the way markets work - everyone wants to buy the highs, no-one wants to buy the lows… and yet they are bought.
As for all the quantum talk, today’s fear, uncertainty and doubt, this is easily dealt with by not being overly exposed and being hedged. Fear, uncertainty and doubt [FUD] is just water of a duck’s back when as an investor your positions are all built on the uncertainty principle and fully hedged to begin with.
Until next time,
Stay [relatively] safe out there,
Dave the Wave.