
Superseding the Cycles
Dear Readers,

Given that the paradigm you subscribe to largely determines what you see, it might pay to first examine the dominant one in order to make sure that it does not overly influence one’s outlook. Currently, the dominant paradigm is undoubtedly the 4 year cycle. This is something to be aware of as we sketch various scenarios going forward. If there is one certainty, it is that most market participants will be certainly surprised, just as they were last time.
The hope here in casting some doubt on the dominant paradigm is that the reader will then become more open-minded to other possibilities, and where those possibilities take on both a more technical and contrarian nature.
Gaining some Distance from the Dominant Paradigm
To be rejected outright here, from the rational perspective, is the desire or search for a singular and certain outcome. All such desire is delusional and can only lead to the most fantastic predictions. This gets people rekt, or at best disables them from taking advantage of actual market conditions. This does not mean to say we do away with paradigms or models, that function to make otherwise random price movement intelligible, altogether. Rather, we become a little more critical toward them, and in doing so hold them accountable to some crucial test or another that might serve to either invalidate or throw some doubt on them.
In becoming critical of a particular outcome, we’re also enabled to entertain various outcomes. This is the very definition of being hedged [in one’s mindset], which in turn leads to being hedged in one’s positions. Of course in doing so, you’ll never be able to maximize your returns here, which is always an imaginary object and propagated by a linear or deterministic mindset that obsesses over a singular outcome. Rather, you’ll effectively manage risk on the one hand, while doing well enough in gaining profits on the other. A balancing out of various goods is the right model to have in mind here as opposed to some absolutist frame of mind.
The first absolute that should be rejected in is that of 4 year cycle theory in my opinion. Even the idea of doing such might seem uncomfortable for some, but then the very fact that it functions as a comforting belief should raise some suspicion. Remember, the market is in the business of disappointing the majority and rewarding the minority. Given the fact that the majority still subscribe to 4 year cycle theory should serve as a red flag from the contrarian perspective. Of course, in being critical of the theory does not mean it has to be rejected altogether. Rather, criticism creates some distancing- it might be true, it might also not be [notice the rejection of a ‘binary’ mindset]. It’s this capacity to hold at arm’s length a singular idea that creates in turn space for other ideas to flourish. These in turn lead to other possible outcomes. Once again hedging is at the fore here, which is fully cognizant of an uncertain future.
As followers of mine are no doubt familiar, I think 4 year market cycle is already half invalidated and likely to be fully invalidated over the course of the next few years. This is due primarily to a fundamental principle that a maturing more liquid market will break up such a predictable and expected pattern. The prediction was that ‘cycles’, or speculative episodes would increasingly front-run the expectation, with an increased frequency to the point that grand 4 year cycles would become unrecognizable on the chart. What was predicted has partly played out already, in my opinion, over the past few years, where a midway 'mini-parabolic’ spike eventuated and the expected final ‘blow-off’ top did not.
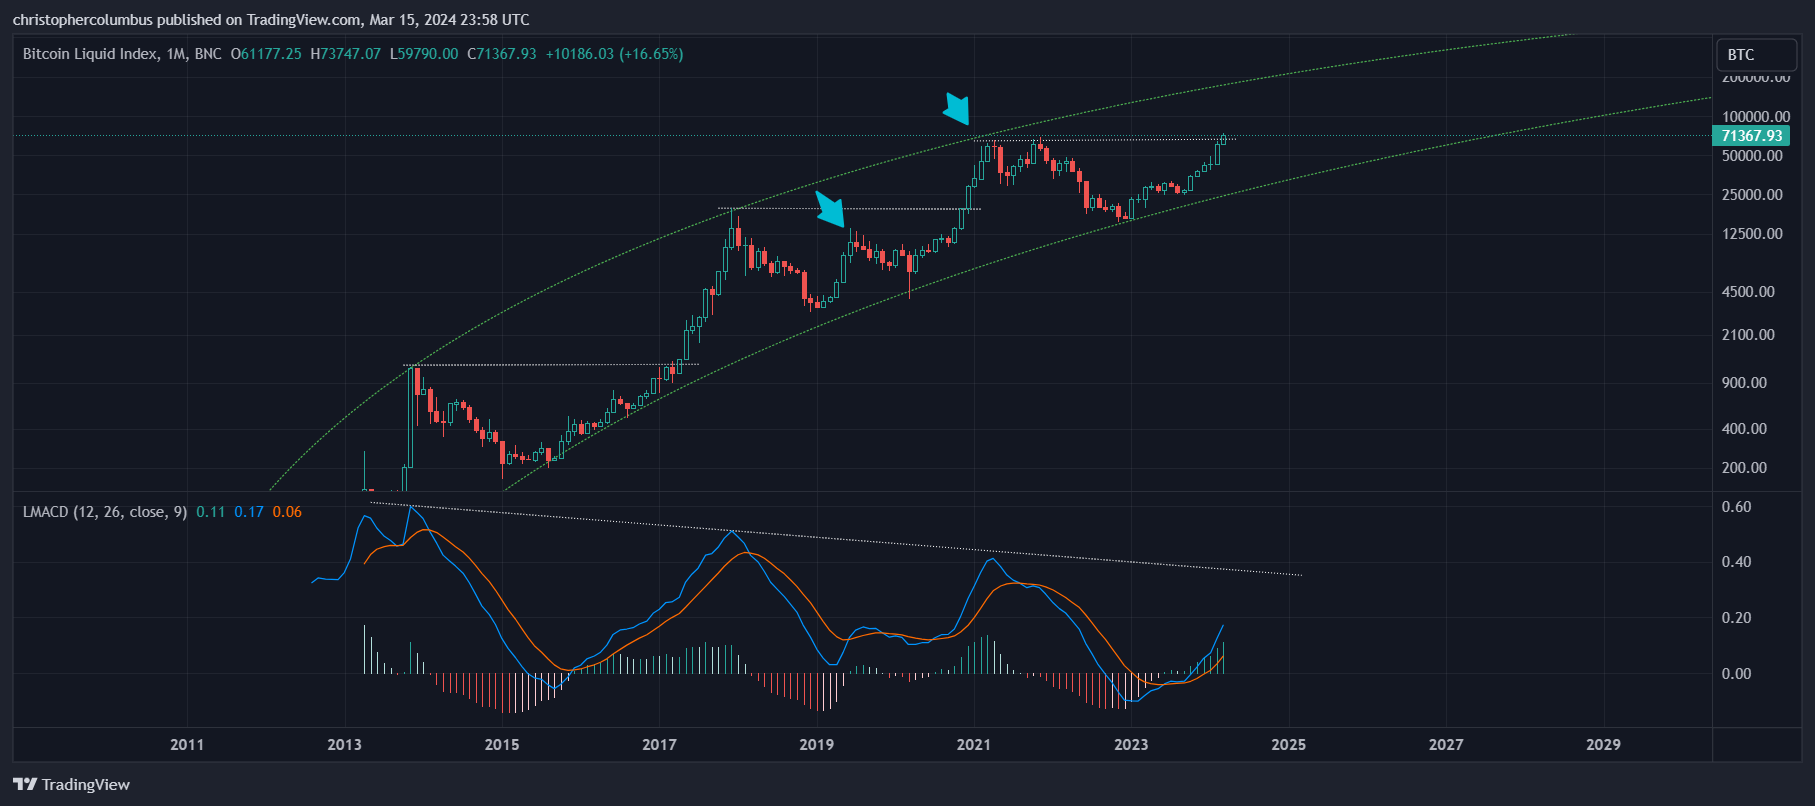
We’ve now another parabolic development in the chart, that has broken through the previous all-time-highs, that threatens once again to disrespect the nice neat pattern that price ‘ought’ to follow based on the 4 year cycle. Accordingly, this calls for a ‘bracketing’ of that theory, a shelving of it for the moment in order to look at the chart with fresh eyes, without the scales of that theory weighing heavily on us.
The Technical Chart Unobstructed with Cycle Theory
The focus here is to both project a peak and a correction of that peak, and as unencumbered by 4 year cycle theory. Of course, there is no observation without some kind of theory at work [all observations are theory-laden], and so it should be recognized that my TA and modeling here is based on both the LGC channel and technicals.
The reader might object, “Dave aren’t you now introducing yet another paradigm, another model, the idea of which you’ve just been critical?” To which I’d reply with the following points, that the LGC channel is -
- a wider more general, less restrictive, theory
- has performed extremely well over the past few years
- to be taken also on a critical basis, open to invalidation, to be hedged against
- to be combined with the technicals

On the face of it we have yet another burgeoning parabolic run. That it is ahead of the 4 year cycle schedule is irrelevant when we’ve only in mind [for the moment] the greater LGC channel that has been solid in projecting the course of price since 2018. Add to this the principle of a maturing more liquid market, then increasing speculative activity front-running general market expectation is only to be expected.

The above chart shows current price to be at a similar parabolic rate of increase to the previous parabolic run. If the run continues into the upper half of the channel, and if comparable to the previous run, a 160K target is conceivable in a relatively short time based both on the fib extension [measuring real values] and the LGC channel itself [a significant break of that parabolic line would serve to invalidate this outlook].
Of course, say something like this were to play out, the investor would then most likely be faced with a relatively serious correction. I say relatively as it may well prove to be quite within tolerable limits for those that have bought in the LGC ‘buy zone’ [shaded bottom band in chart] or even earlier. Investors for the longer-term may be fine with sitting and absorbing what is radical volatility in the shorter-term as the following chart depicts.
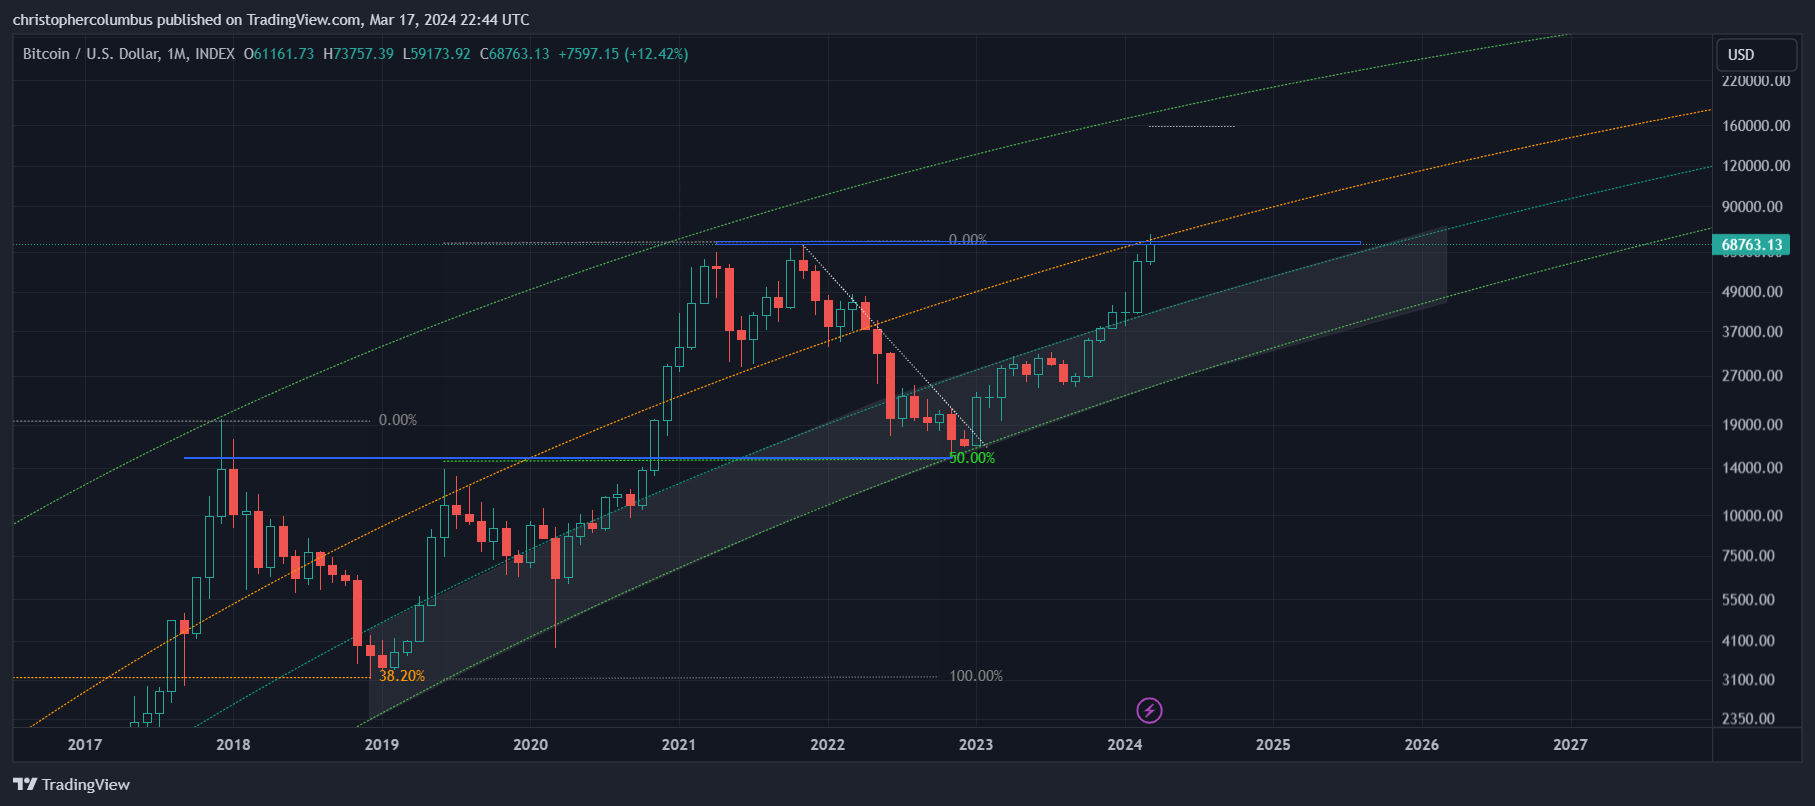
If the BTC chart is to become more amenable to technical analysis in a maturing market, which I think it is, then there is a good likelihood that the subsequent correction following a present full-blown parabolic spike could well correct to the previous peak price that is also the current price, and would also be the top of the LGC ‘buy zone’ [based on a year’s correction after a peak]. In such an envisaged scenario, there would be some incentive to take some profits. Of course, instead of taking these in BTC, the extra volatility of alts [off the bottom] could serve that hedging function.
But Dave, the reader might ask, what if the alts fail to perform as they did last time. Here you could swing trade the volatility of alts in the shorter term to accumulate USD, which would effectively hedge your longer-term alt positions that are looking for the ‘cyclical’ spike.
Summary
It has not been my intention here to portray the way in which BTC price will develop, for that would be a fool’s errand. Rather, my aim is to sketch a real possibility in which BTC could well develop. Though this is not certain, neither is it completely arbitrary, being as it’s based on both a well-functioning model and TA. The intention is to foster a less singular, more ‘pluralistic’ and hedged mindset, one that will not be quite so surprised at the eventual outcome as most are likely to be.
Until next time,
Stay, relatively, safe out there,
Dave the Wave.