The Arguments for the Bottoming Base In
Dear Readers,
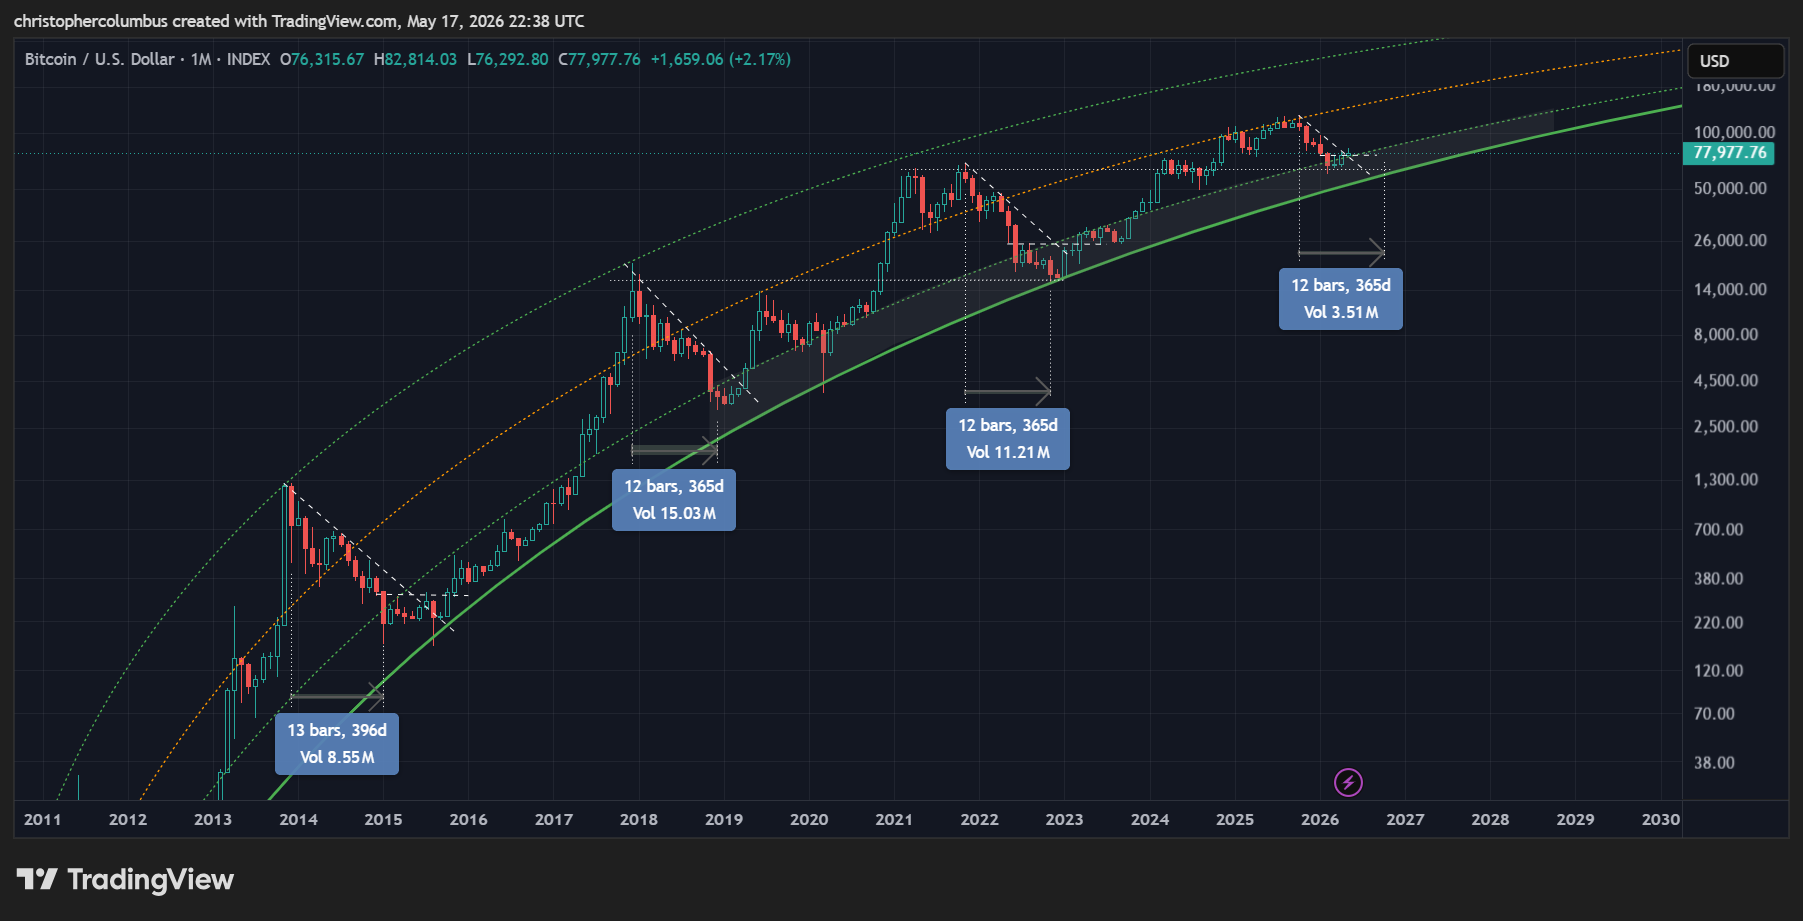
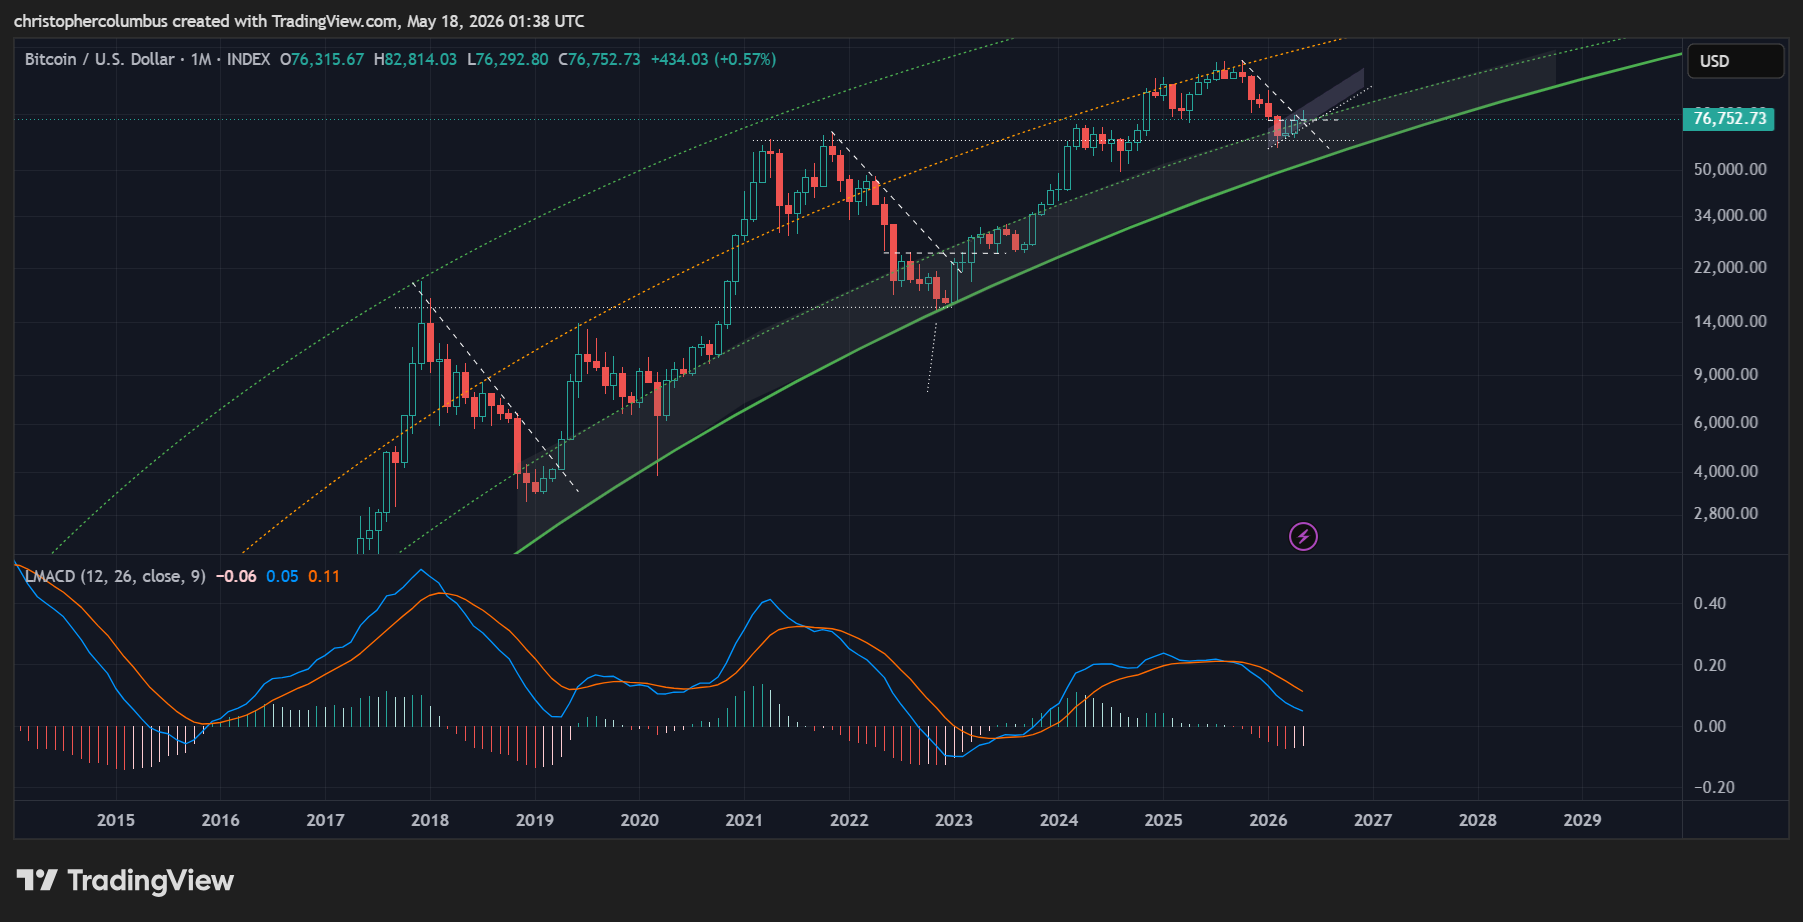
On looking at the long-term chart, it seems the only constant is time - that one year macro correction on previous cycles. Given the repeating pattern, it makes sense to use it as the working hypothesis. Currently we are in the seventh month of twelve with price looking relatively strong. What was a negative in the past [the lack of a parabolic spike] is now a positive - need price correct further in response to a parabolic spike that never happened? The macro point here is one of reducing volatility - price looks to be stabilizing, or maturing, along the lines of a logarithmic growth curve.
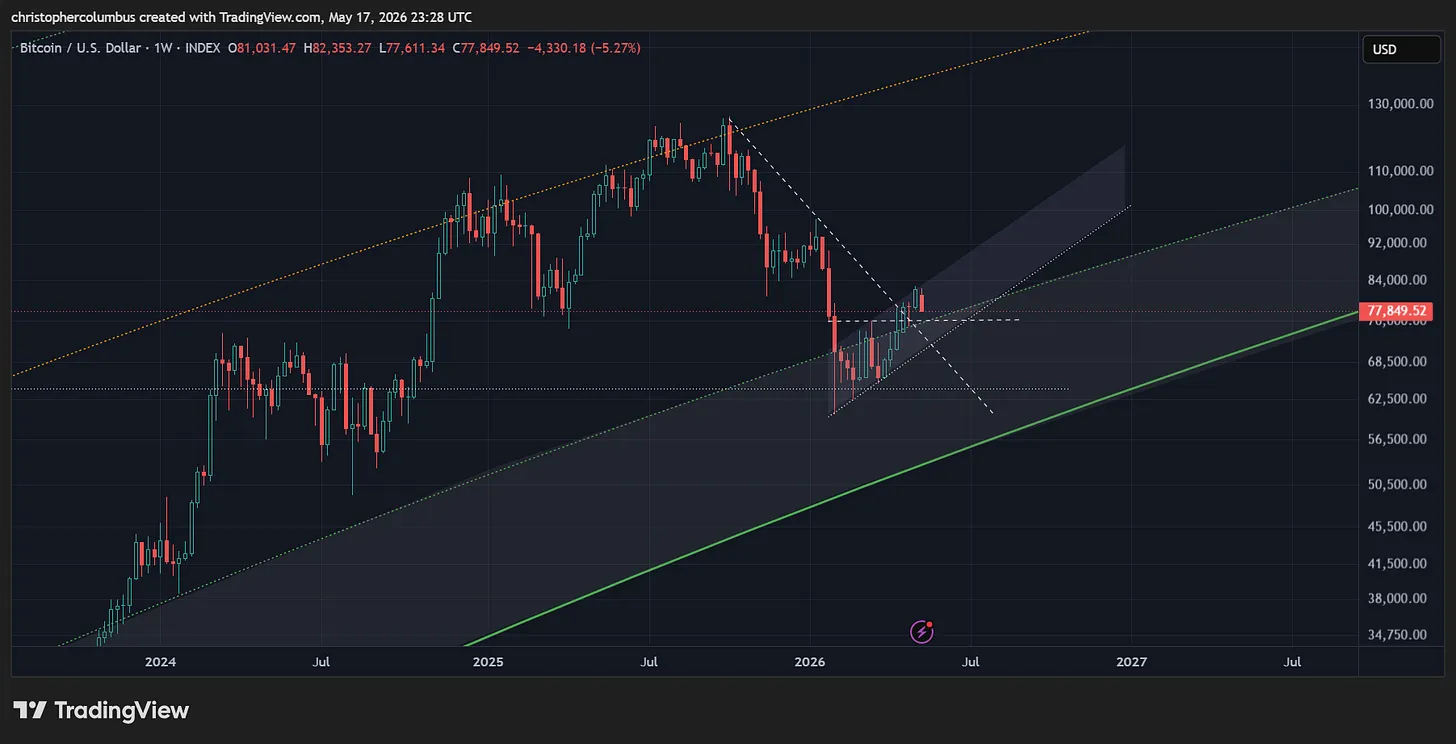
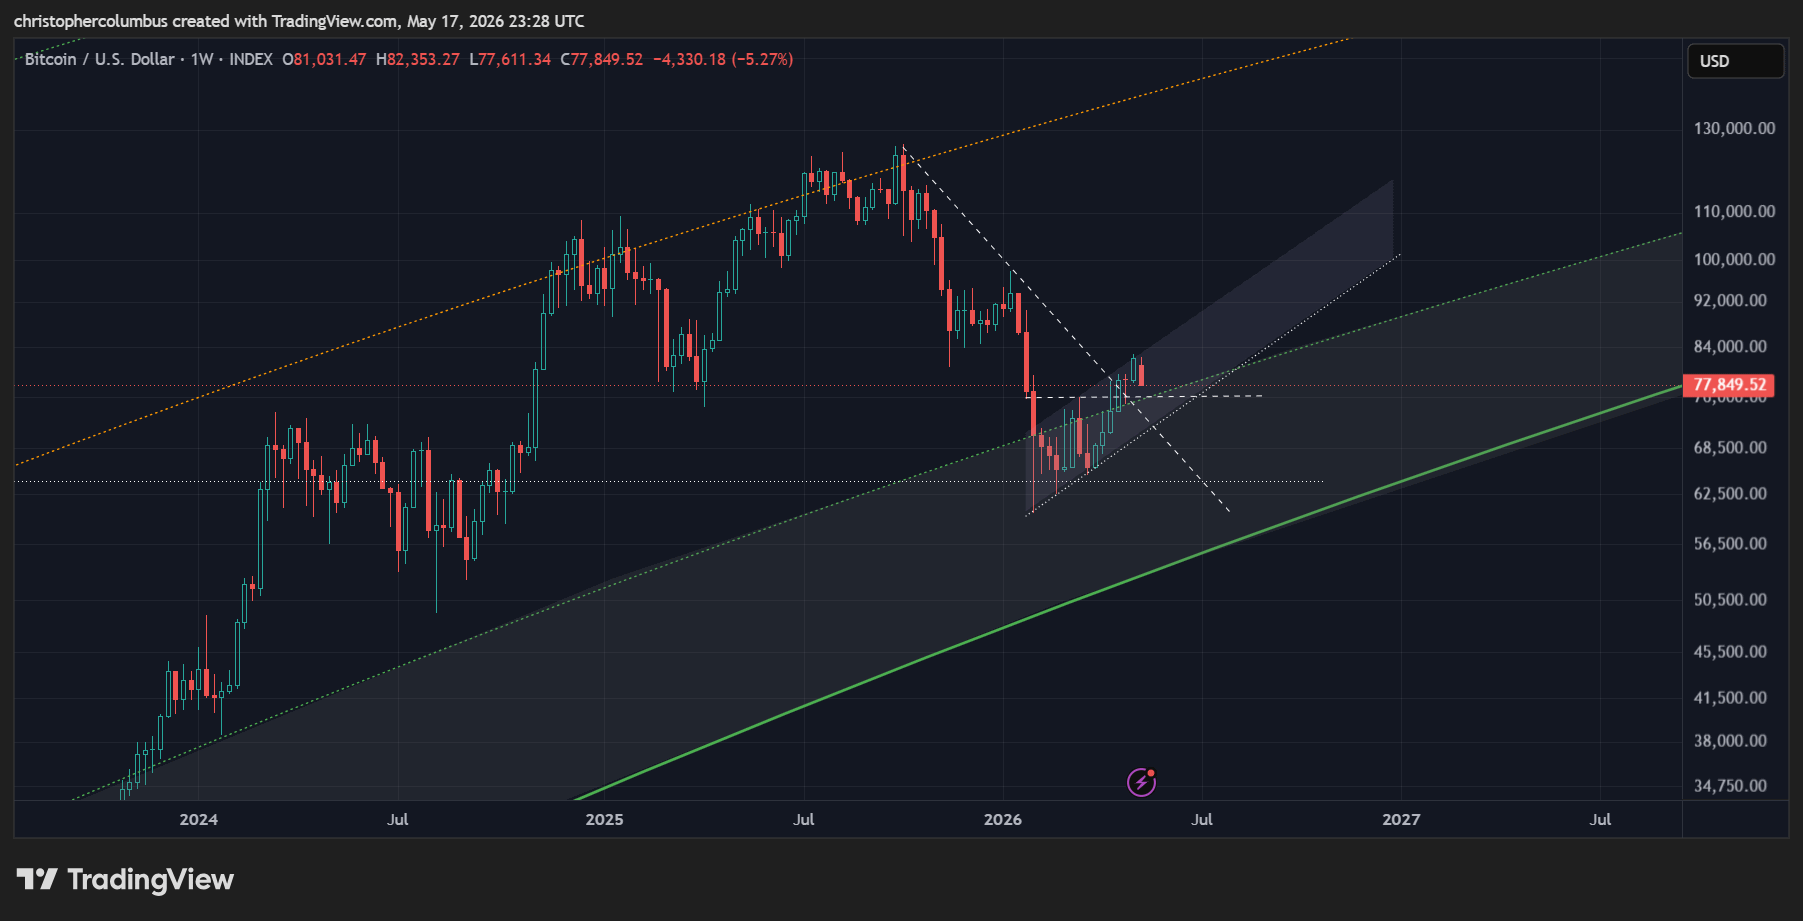
What I also find of significance in the long-term chart above is the multi-month diagonal of resistance is currently breaking also suggesting that a secondary bottom may not eventuate. This is more clearly seen on zooming in on the weekly chart as follows below.
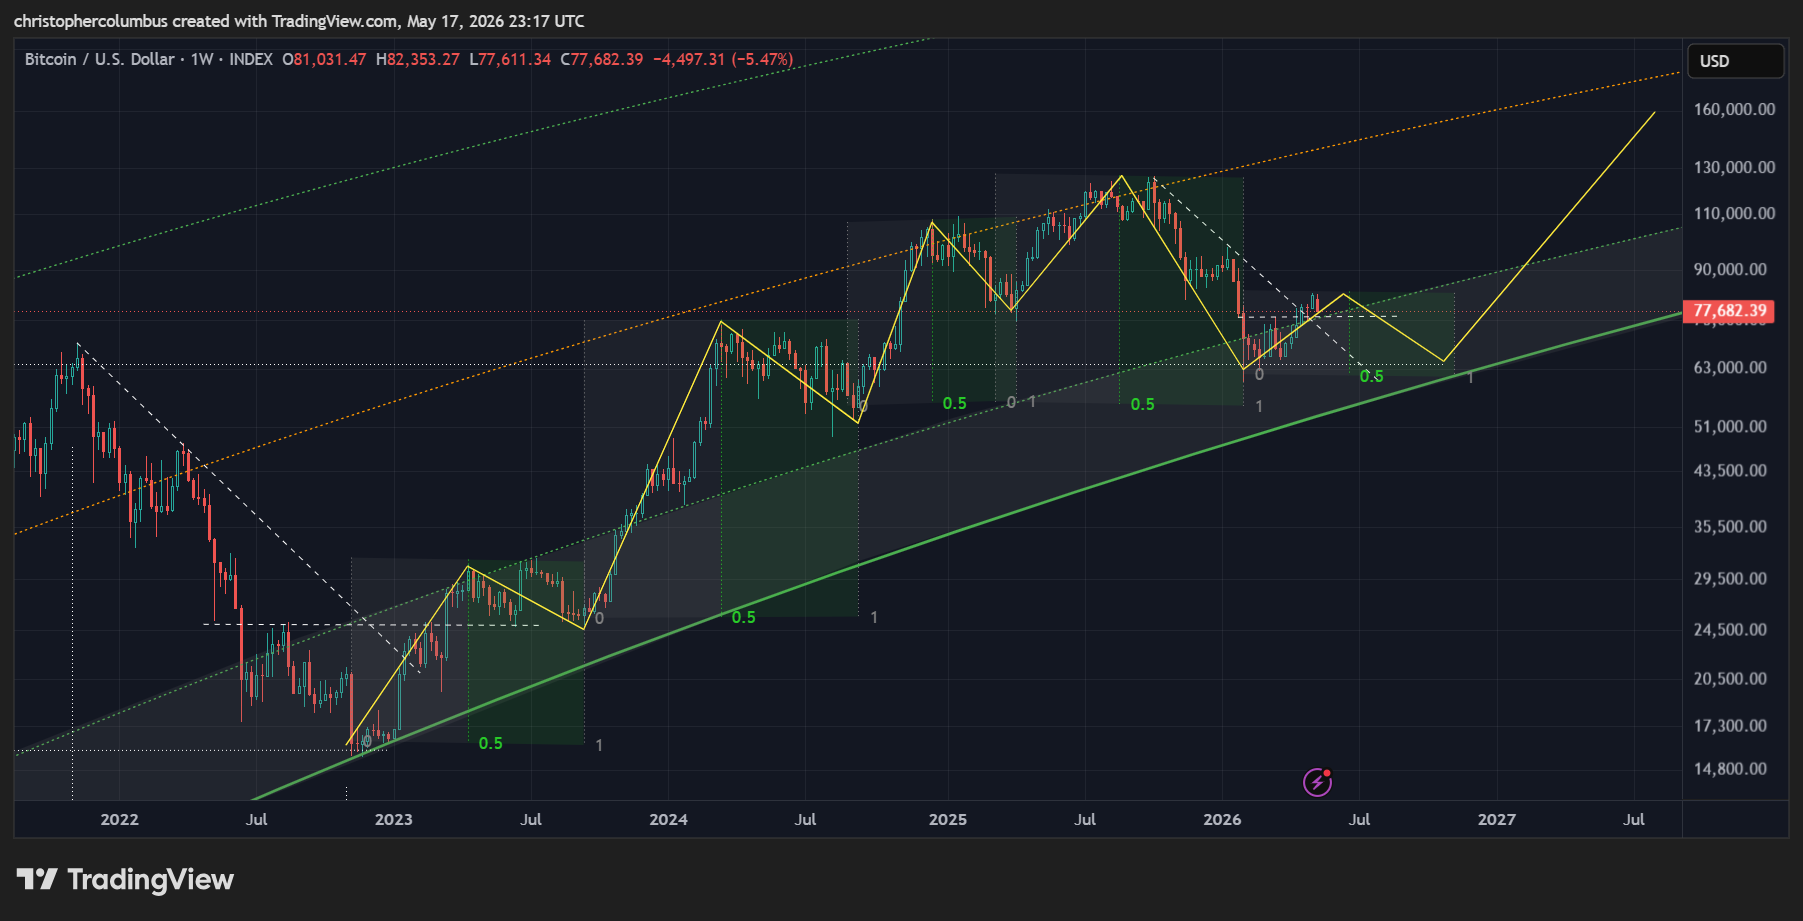
With price breaking both multi-month resistances of the downward diagonal and the horizontal, it has proven to be stronger than was generally expected. And yet the risk remains of some further consolidation. This could well eventuate as a sideward range, given the current strength of price and reduced macro volatility. The focus on the chart below is also on time - where an extended period of strength of around 20 weeks is followed by a similar span of consolidation.
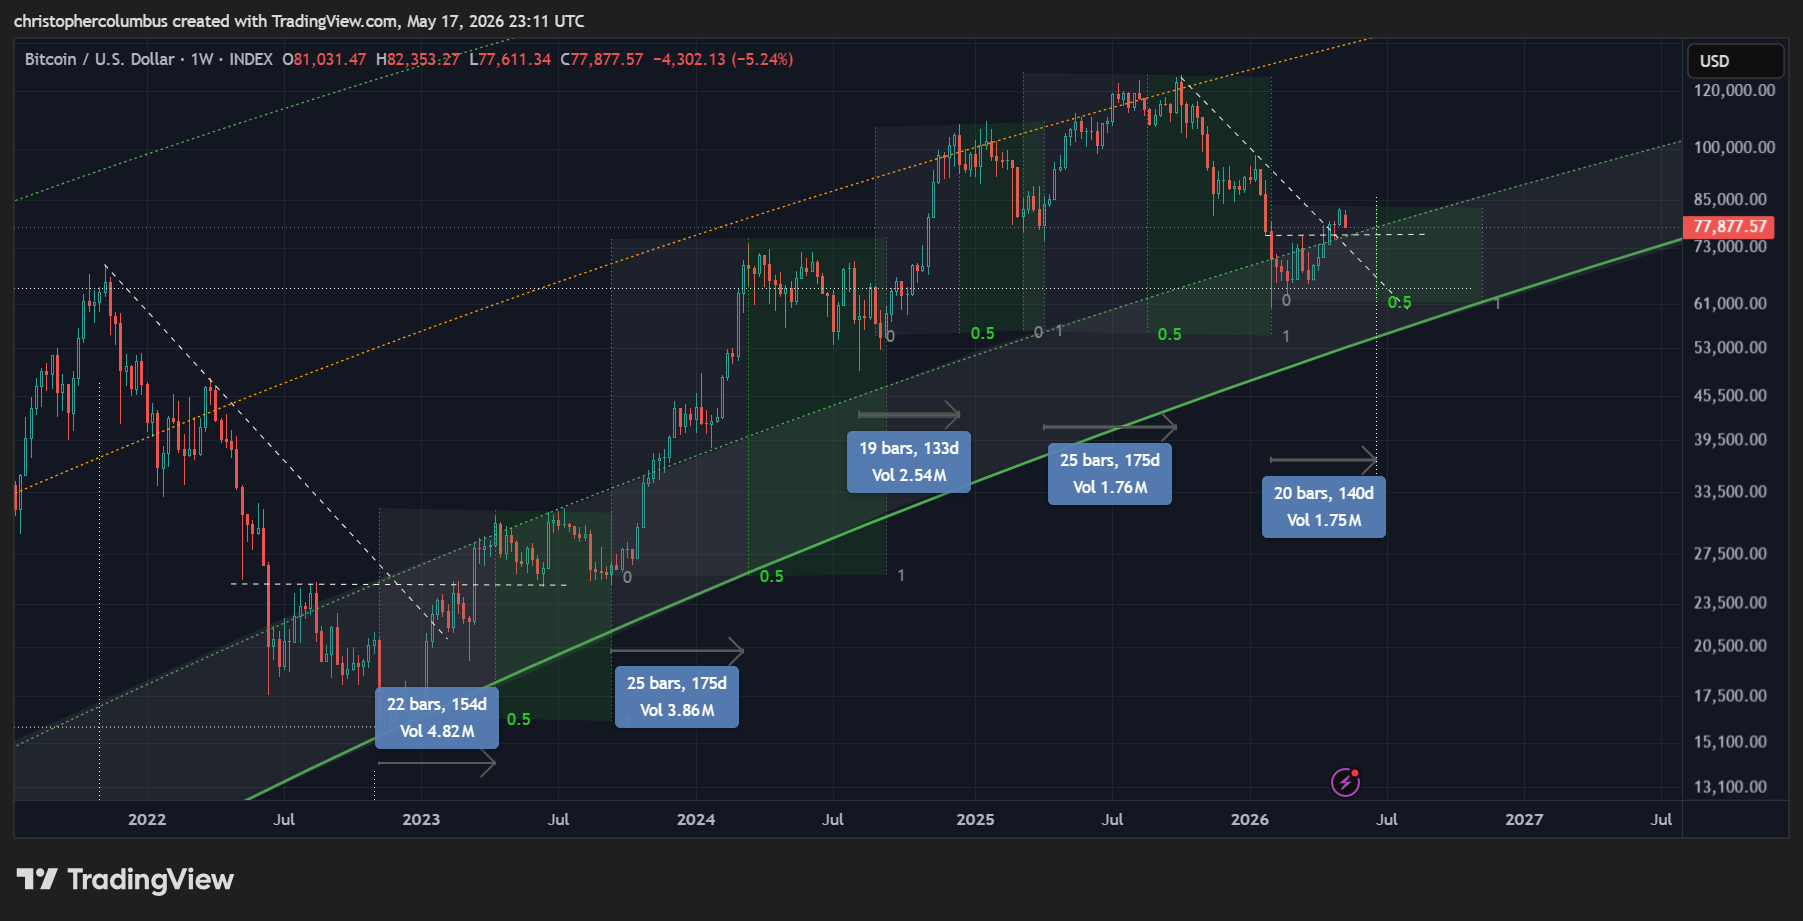
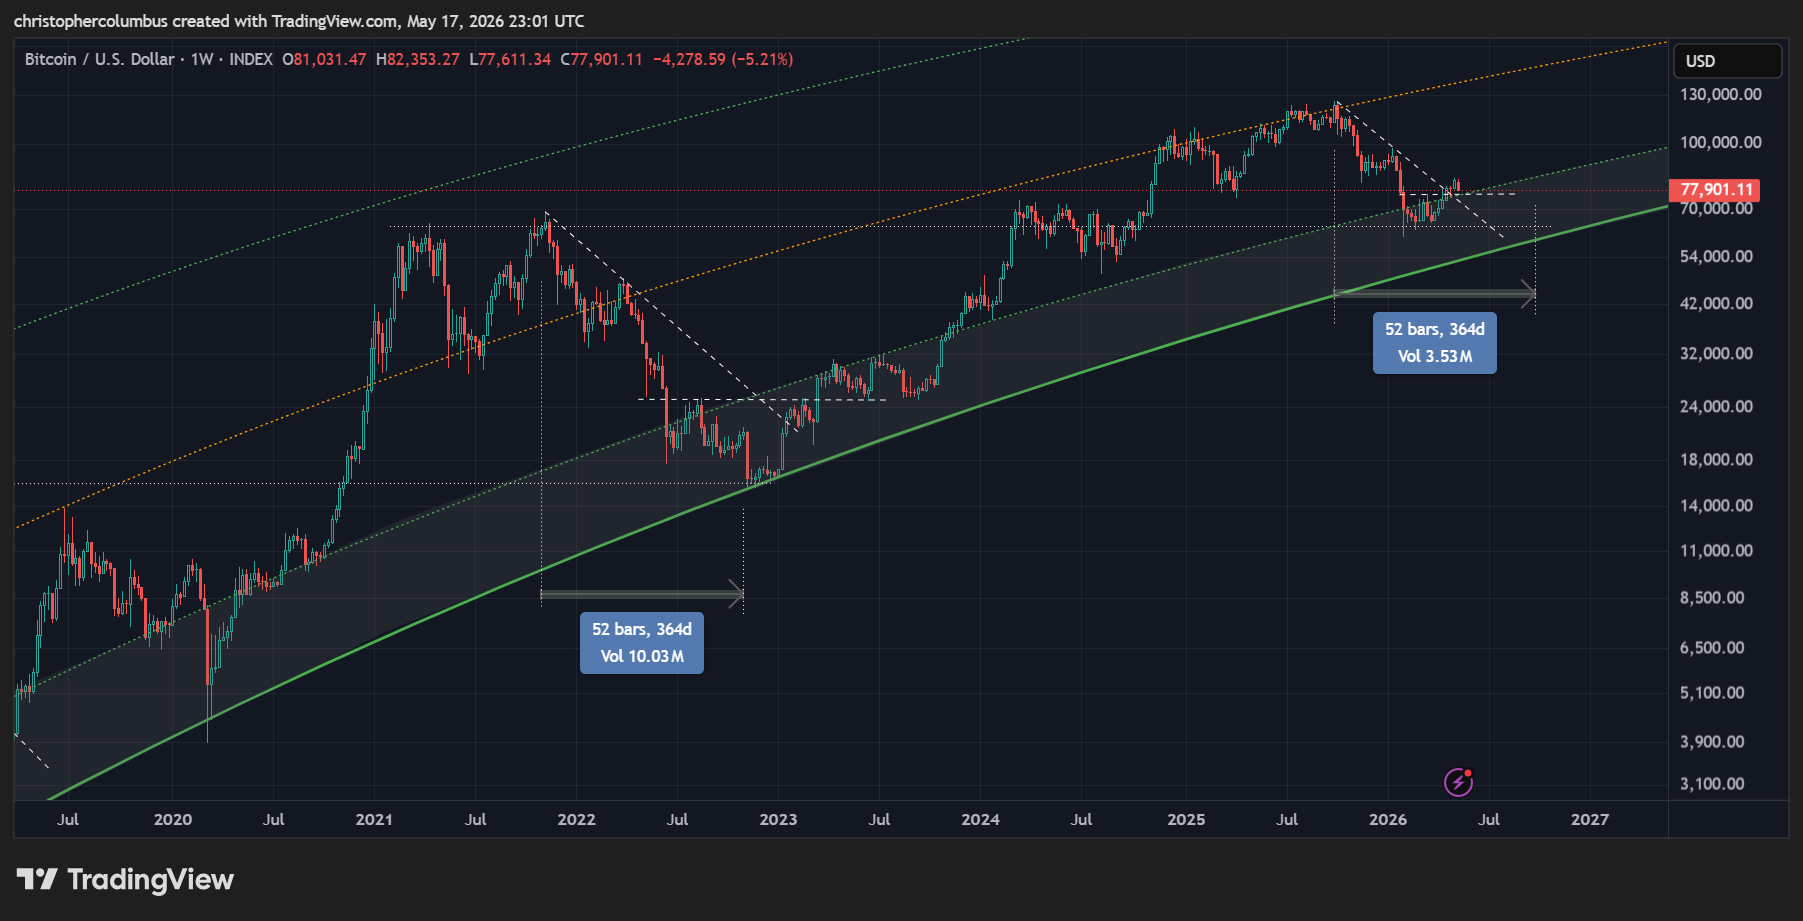
This period of consolidation back into the ‘buy zone’ of the macro logarithmic growth curve, would also see a year long correction play out. The basing range formed would then function as a solid platform for the following cycle going forward.
More bullishly, and perfectly feasible along technical lines, is the formation of a reverse head and shoulders seeing price break to new highs next year.
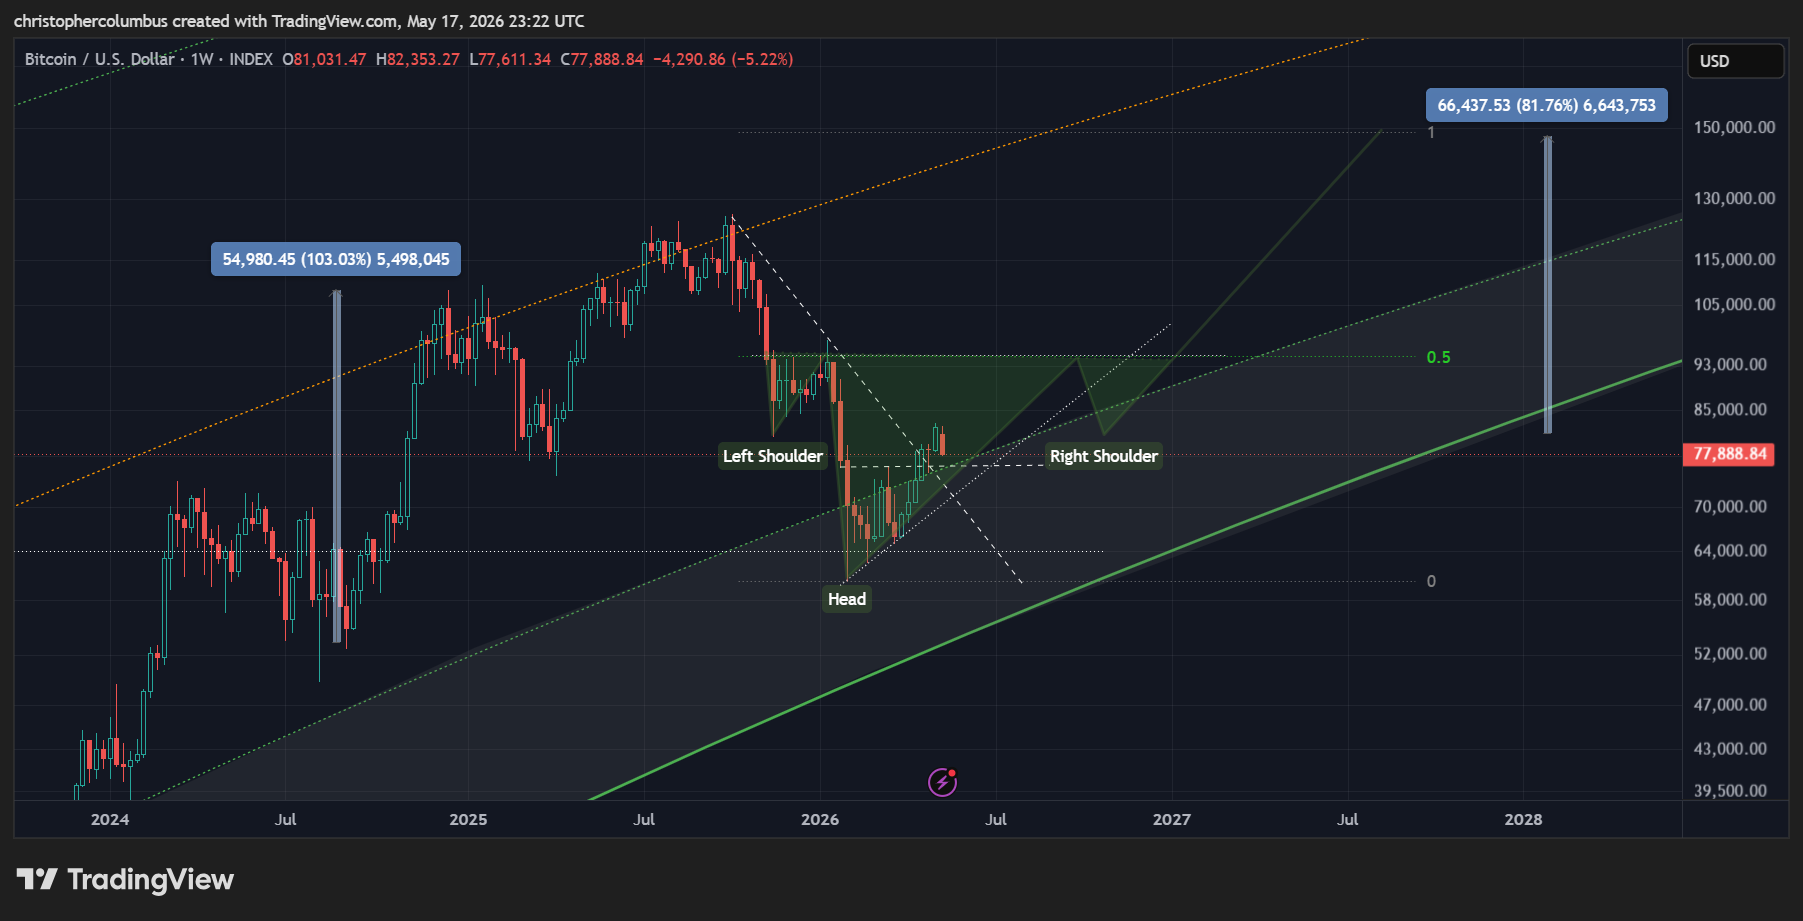
It would be this upward channel, if it holds, which would provide the impetus for the formation of a reverse head and shoulders, a classic bottoming pattern… and where the BTC market is an increasingly technical/ mature one.
Finally, and zoomed out to the long-term the chart again, the monthly MACD is telling of a turnaround in momentum. If the histogram continues to contract, it will not be long before we see a bullish cross of the MACD line itself.
All in all, price looks technically sound here, no catastrophic collapse while continuing to repeat the macro pattern seen over the last few cycles. Investors looking to buy for a longer-term hold would be doing well to average in over the next few months while price is in or near the ‘buy zone’ in my opinion.
Until next time,
Stay [relatively] safe out there,
Dave the Wave.