
The Constant of Time
Dear Readers,
The 12 Month Correction
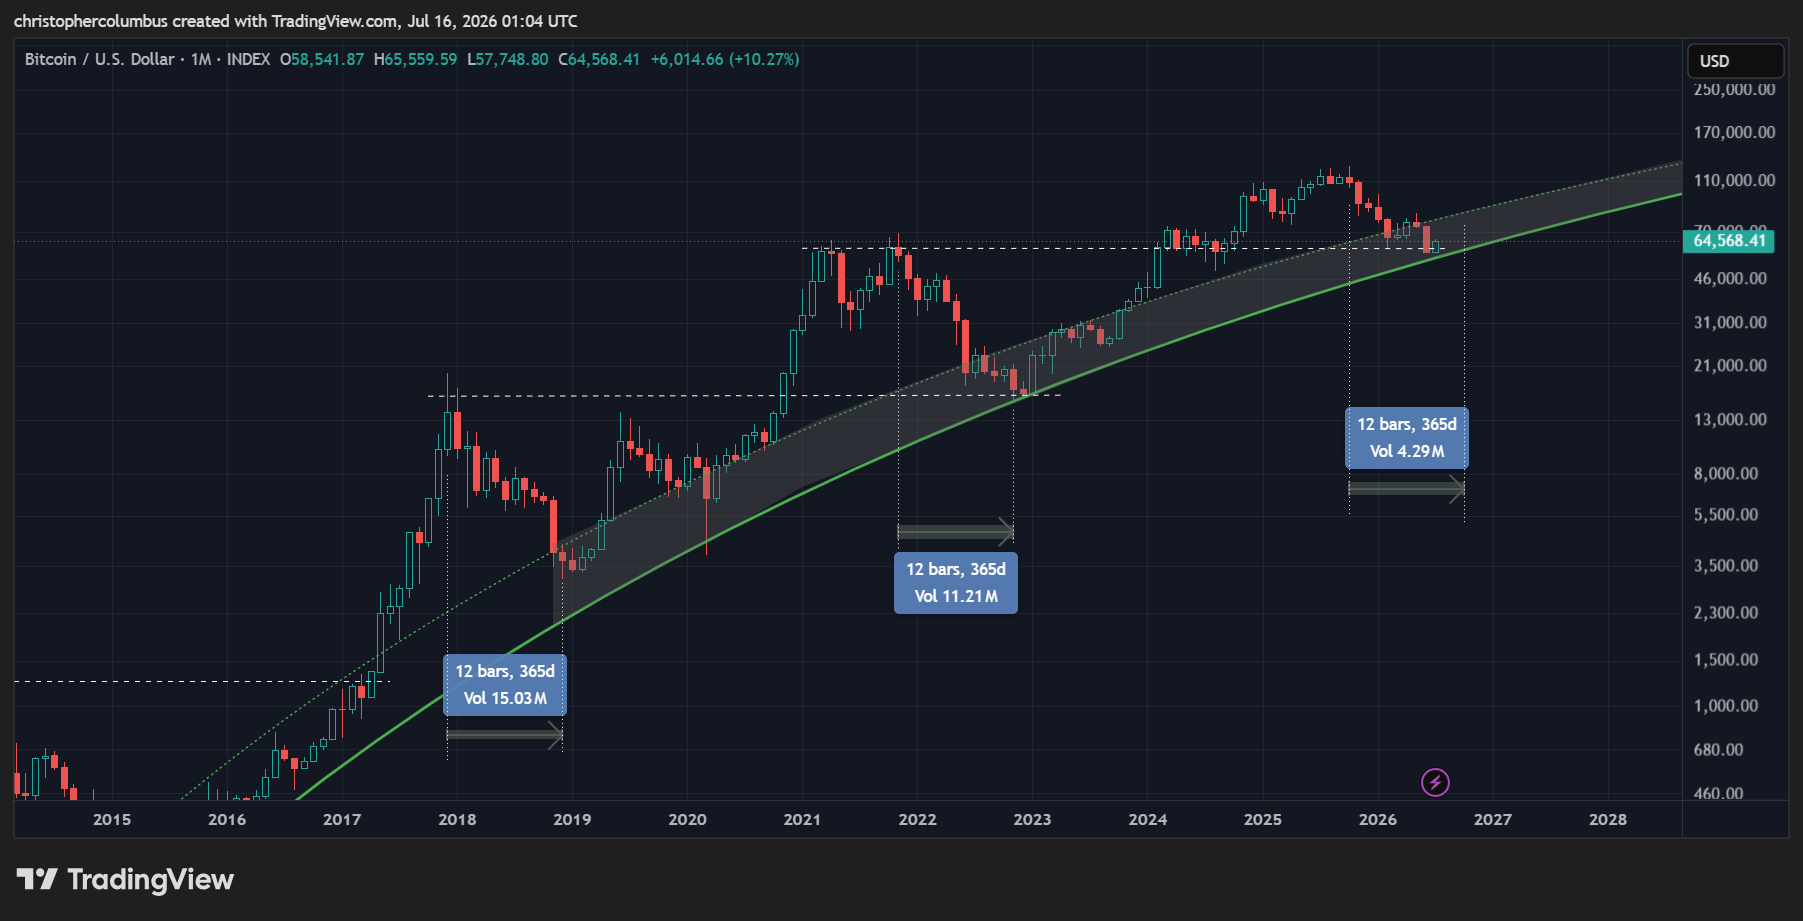
As posted recently on X, the one constant [admittedly from a small sample size] is the one year correction. And the culmination of that time period is currently only 3 months away [October]. Part and parcel of the ‘4 year cycle’, this has to remain the go to default position in that price action has so far observed it. Whereas a maturing market has affected the y axis of price [diminishing returns and reducing macro volatility], it has of yet to affect the x axis of time.
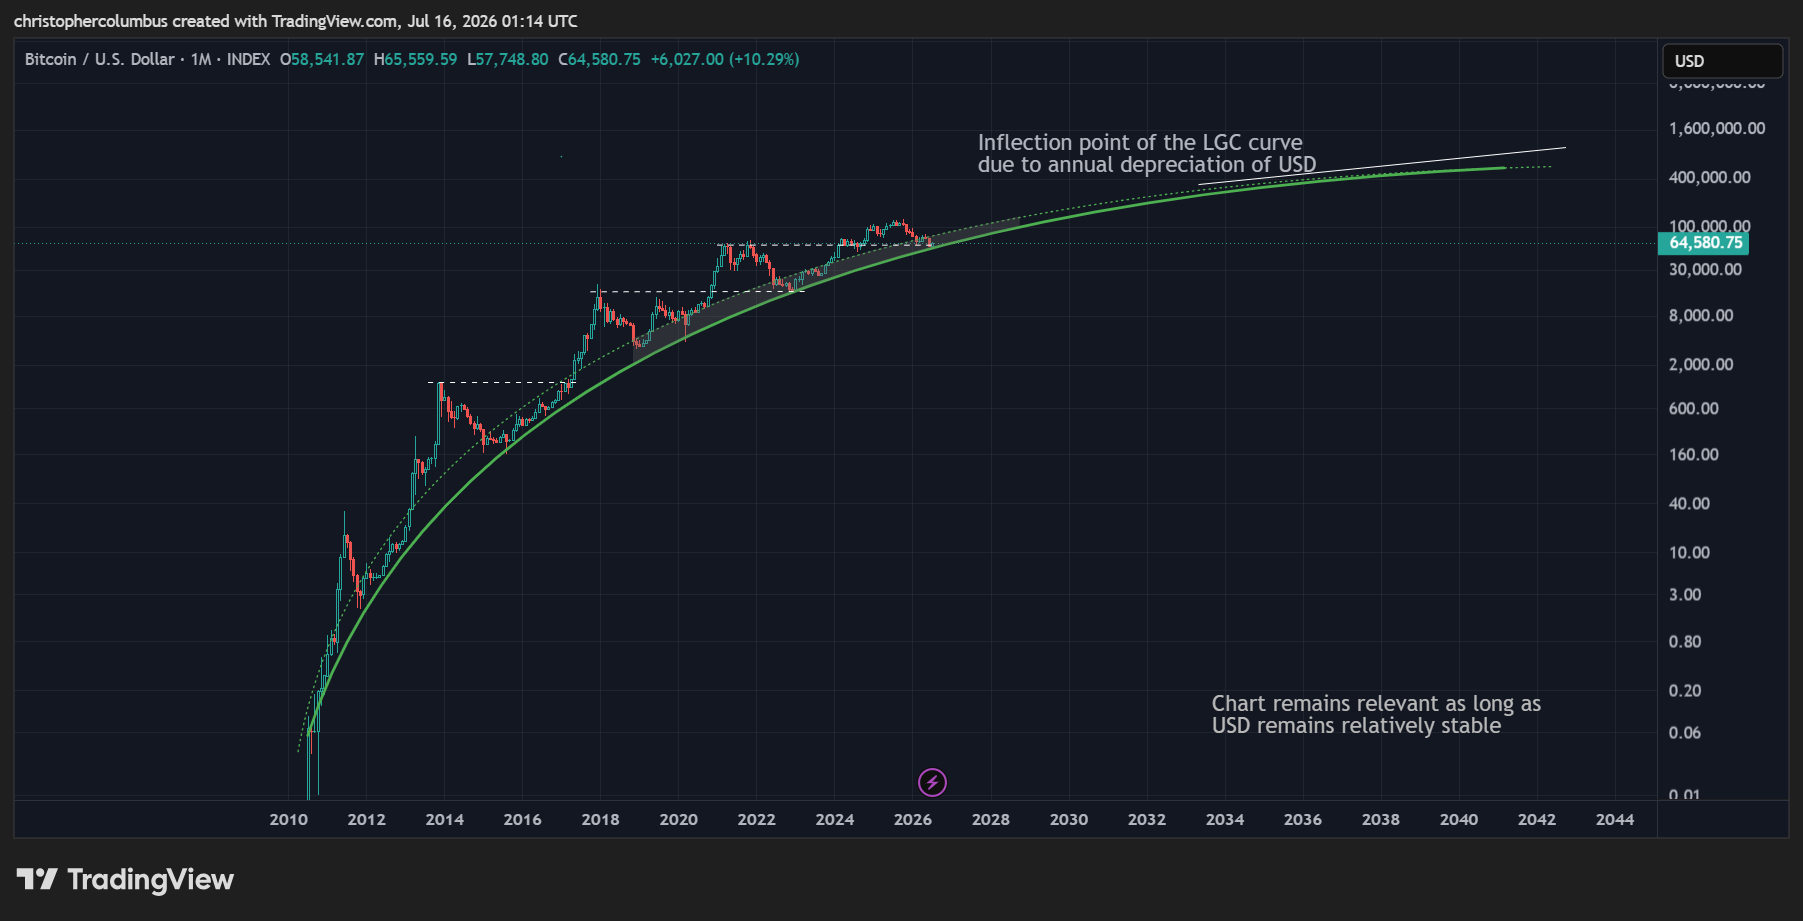
The 12 month correction is also well situated on the LGC [Logarithmic Growth Curve]. Indeed, it could not be better placed, which further corroborates the near completion of the correction.
It is easily observable that the macro volatility of price has reduced significantly as compared to previous cycles. The only constant over successive cycles, besides that 12 month correction of the x axis, has been the base of the Logarithmic Growth Curve.
The upper curve, to denote the limit of possible price spikes, that was once drawn on the LGC channel is now redundant. In my opinion, it belonged to the era of parabolic markets, where now we are in the era of more mature technical markets. If this logic holds, and of course as long as the pricing mechanism of USD holds, then the base of the LGC, and the lower channel of the buy zone [shaded area] will increasingly capture price action going forward.
But of course, Bitcoiners are no doubt more concerned at the moment whether the macro/ cyclical bottom could be in as opposed to future price projections… which could be kept for a later date.
Monthly MACD
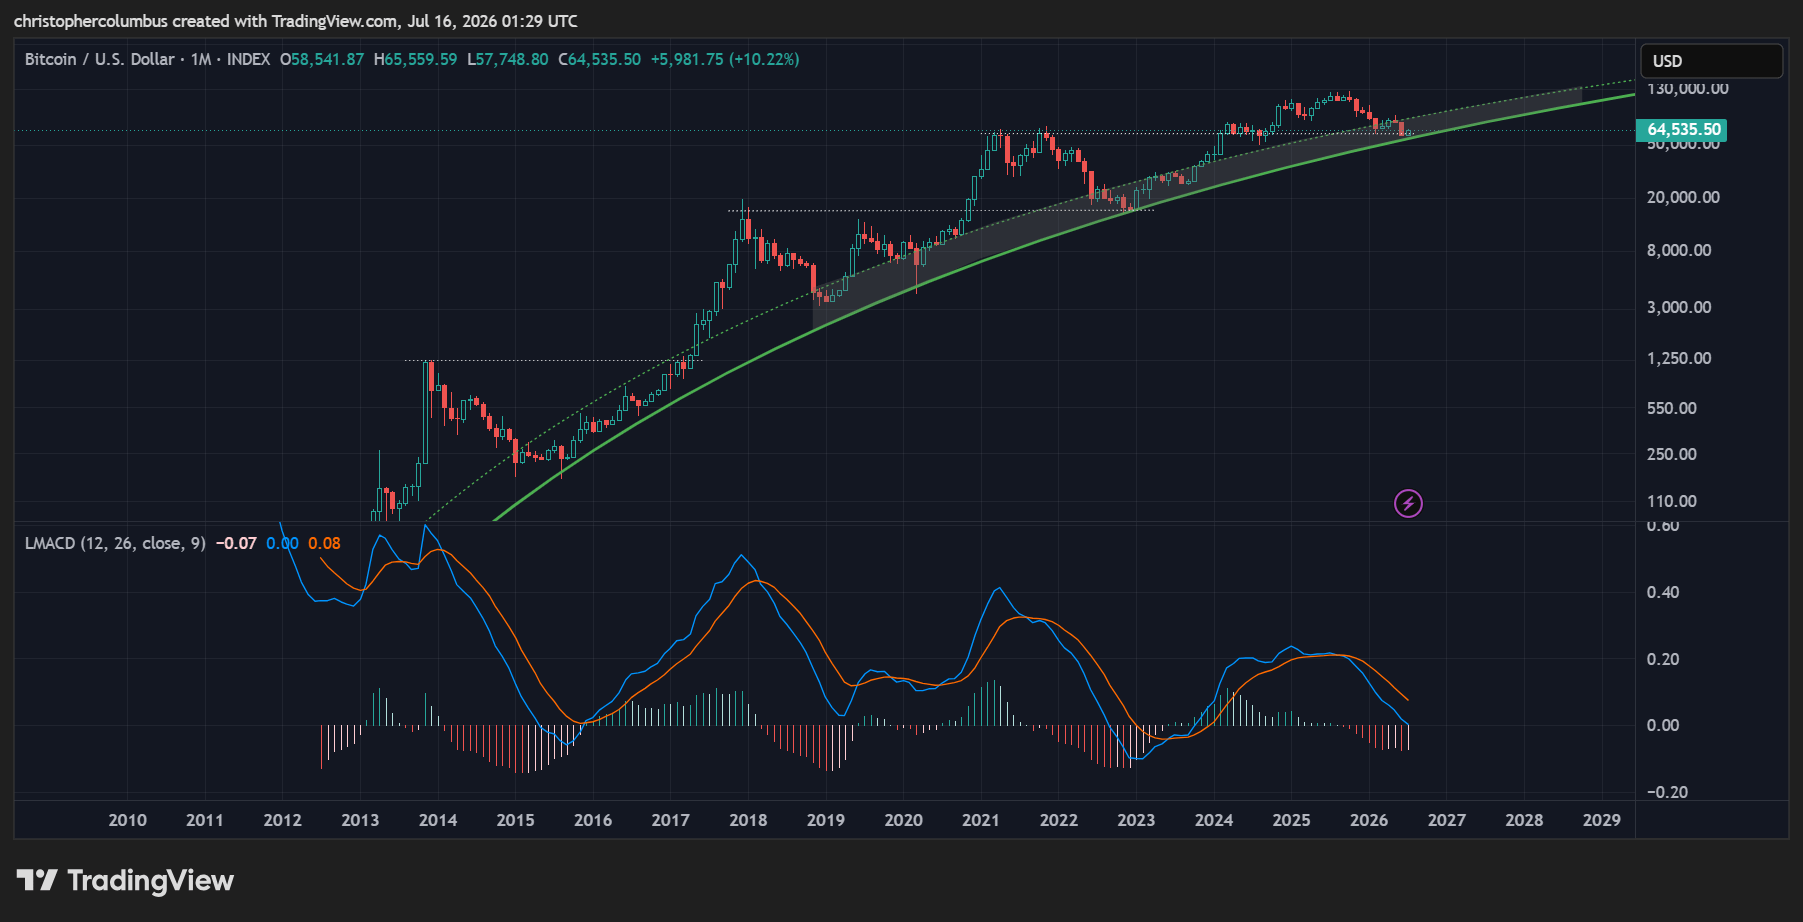
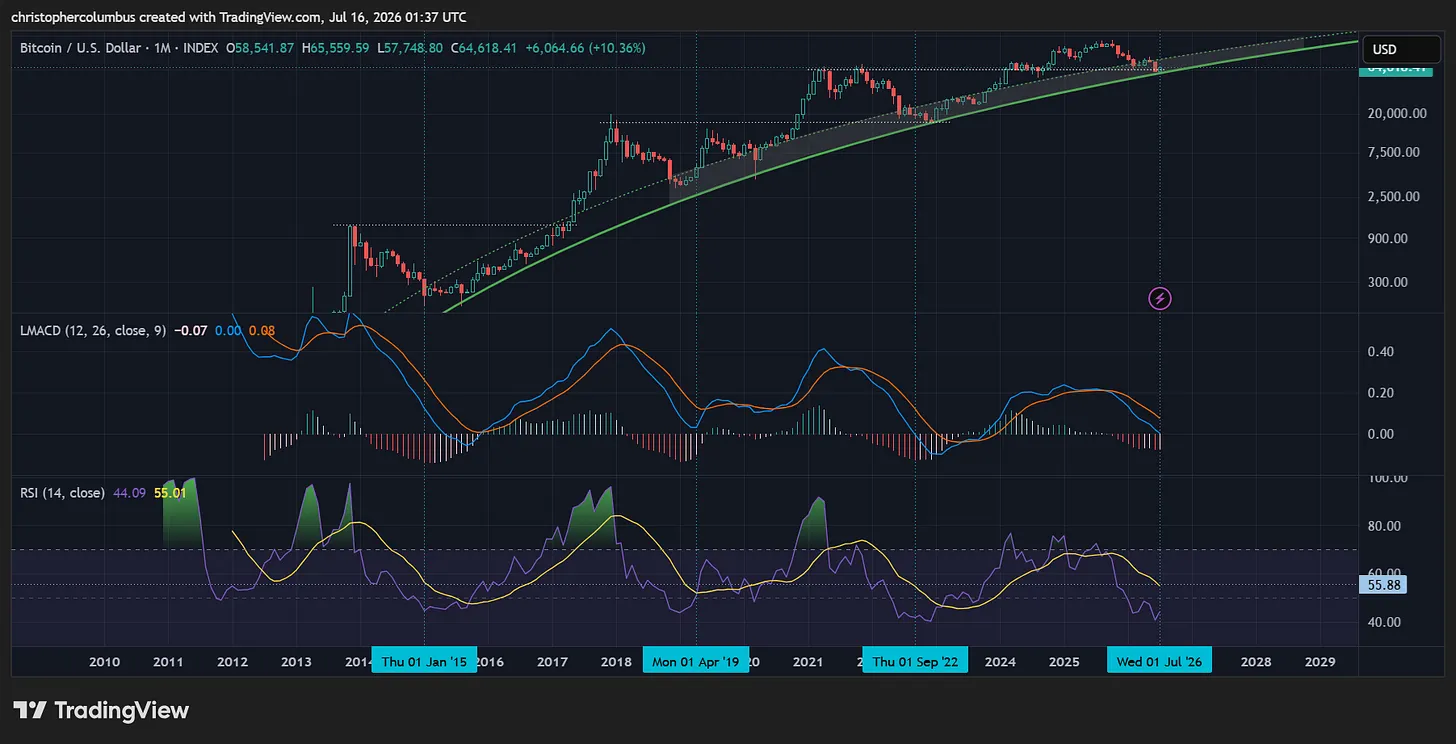
Further corroboration for the outlook of a current 12 month correction is the monthly MACD. This longer-term momentum indicator has now fully rebooted to the zero-line. Given it is a lagging indicator, it is likely to go a little under that base line as per previously… even as price puts in a ranging base at current levels.
Could price go a little lower? Sure, but based on the technicals factors outlined above, the investor can have some confidence in the base developing over the next few months.
Monthly RSI
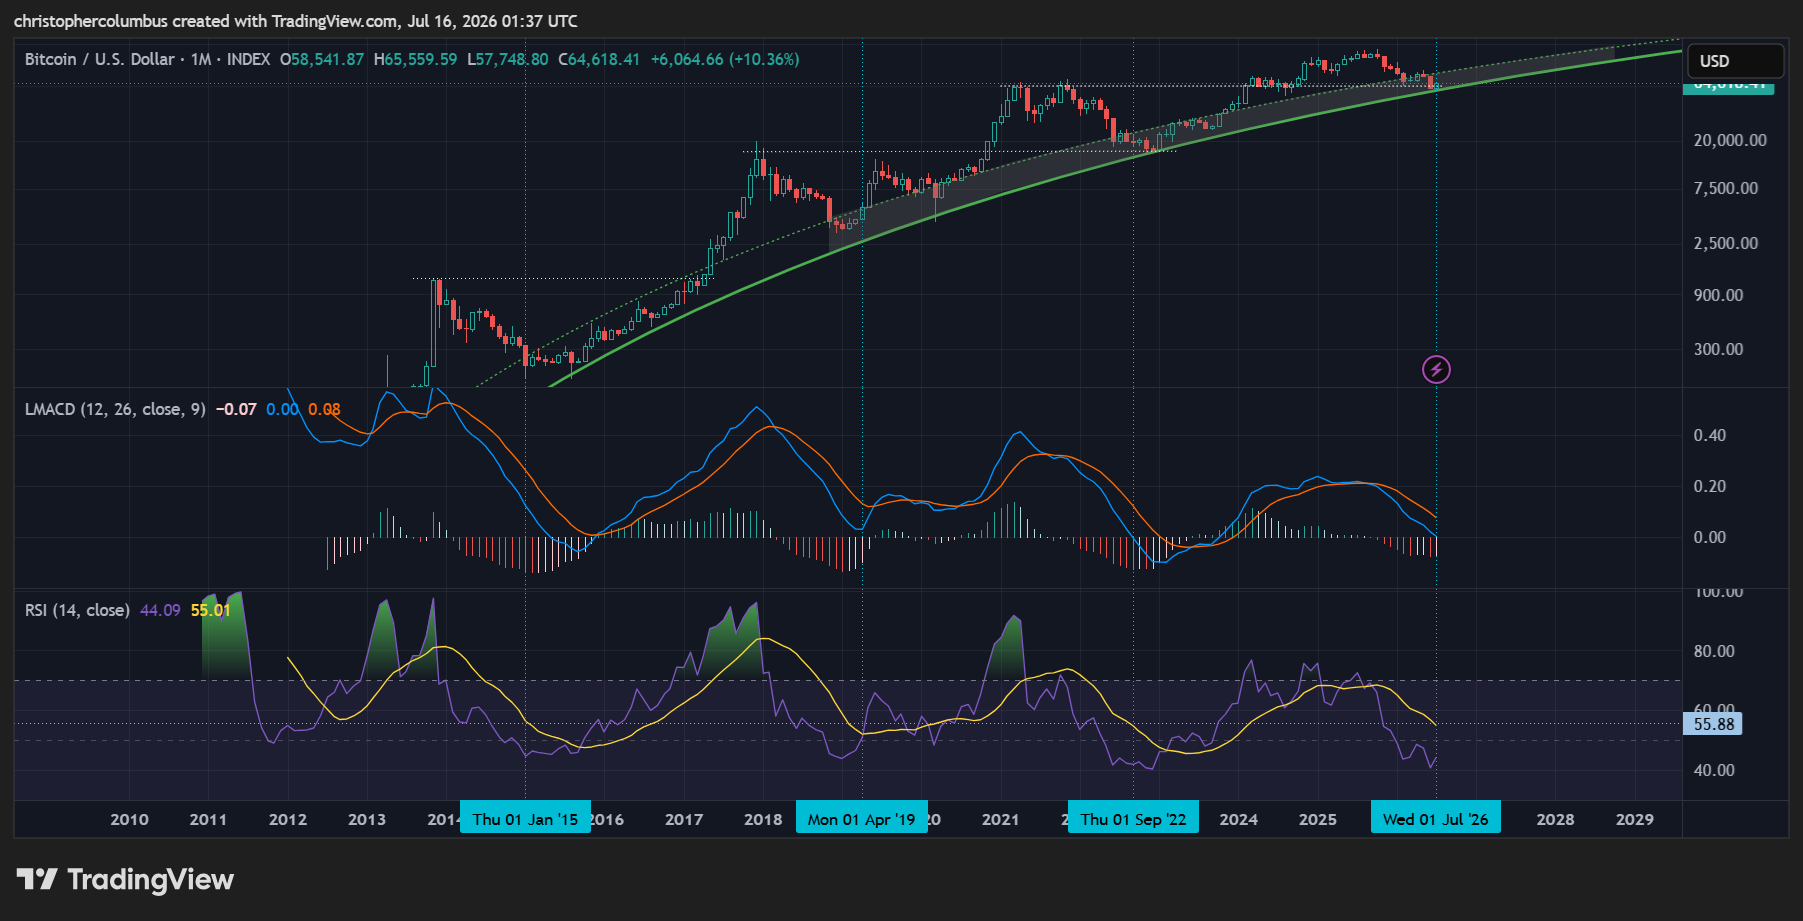
Also lining up with the MACD is the RSI, signaling the bottoming level of price. The RSI itself has reached the previous lows, while the tracking average currently sits where you’d expect it if the cyclical pattern were to continue to play out.
The Monthly Gaussian Channel
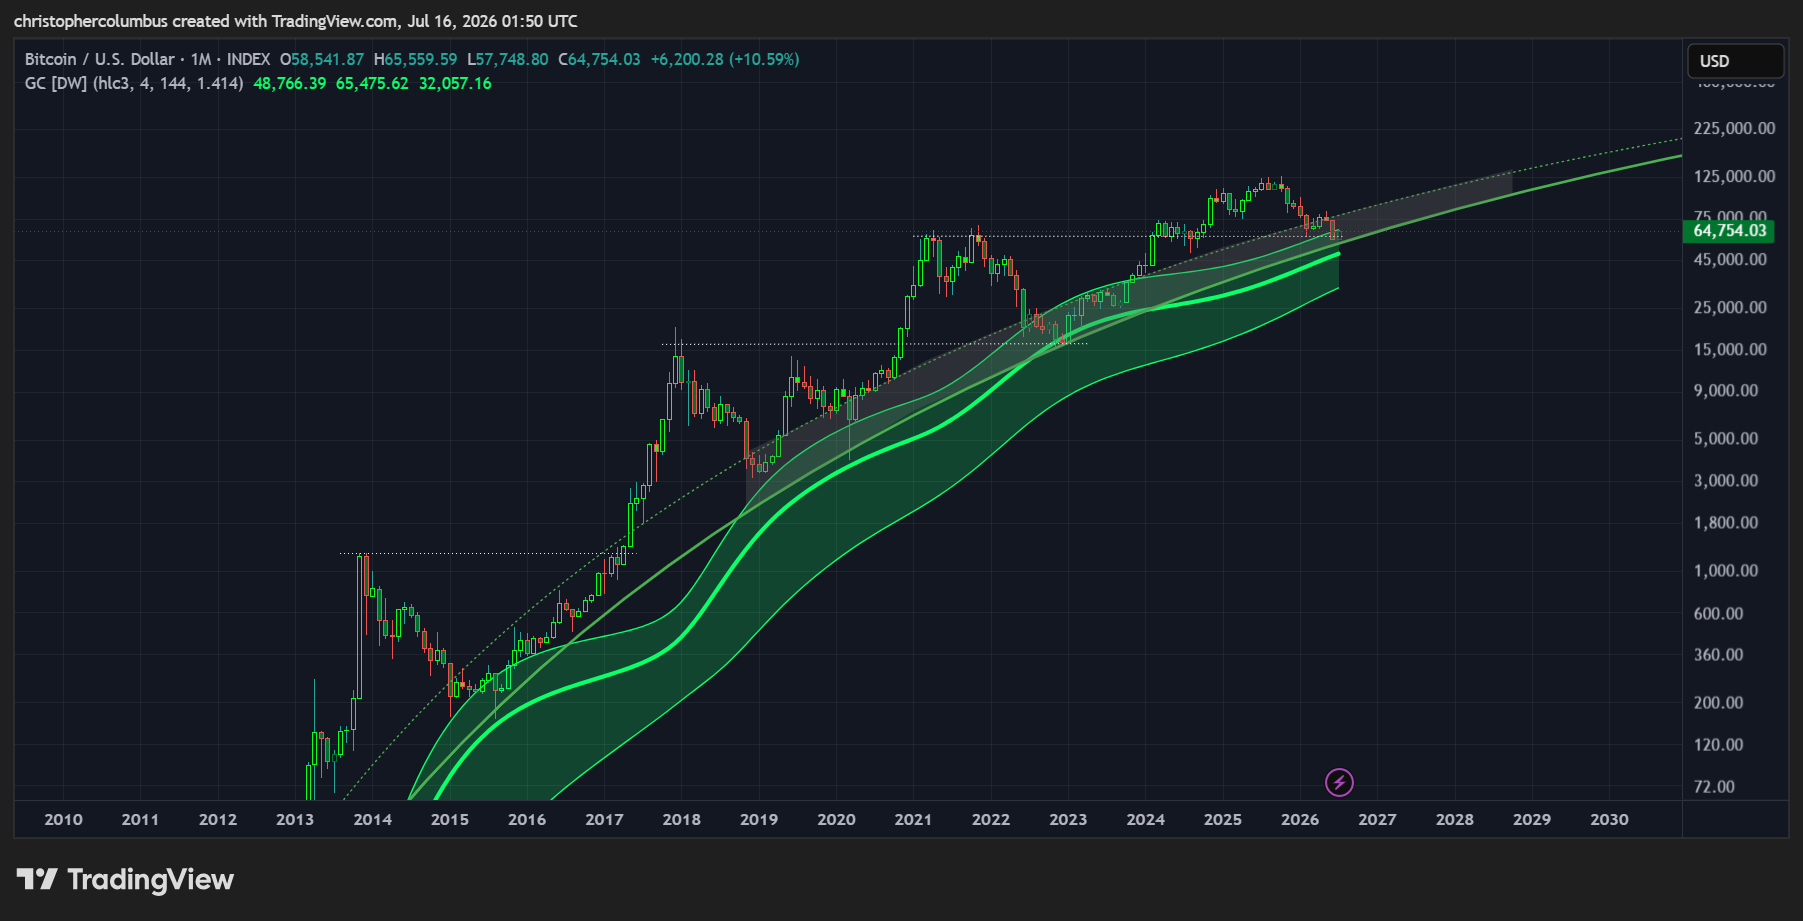
Finally, the longer-term Gaussian Channel, another momentum indicator, which I have kept on eye on over the years. Its center-line is near tracking the base of the LGC, and has moved counter to the spikes. It is moving upward even as price has moved downward to meet it. It currently sits at 50K, whereas the LGC base is currently at 55K. To my mind, these would be worst case scenarios… while price is still currently low in the ‘buy zone’.
Until next time,
Stay [relatively] safe out there,
Dave the Wave.