The LGC Channel Revisited
Dear Readers,
This article will be a more general big picture one looking at the LGC [Logarithmic Growth Curve] and in particular the LGC channel that sits atop of it. The aim will be both to explain why price has not run to the top of the channel, and in turn to predict what prices will do in the next cyclical bull market [previous articles have focused on the possible bottoming levels].
The LGC Model [Logarithmic Growth Curve]
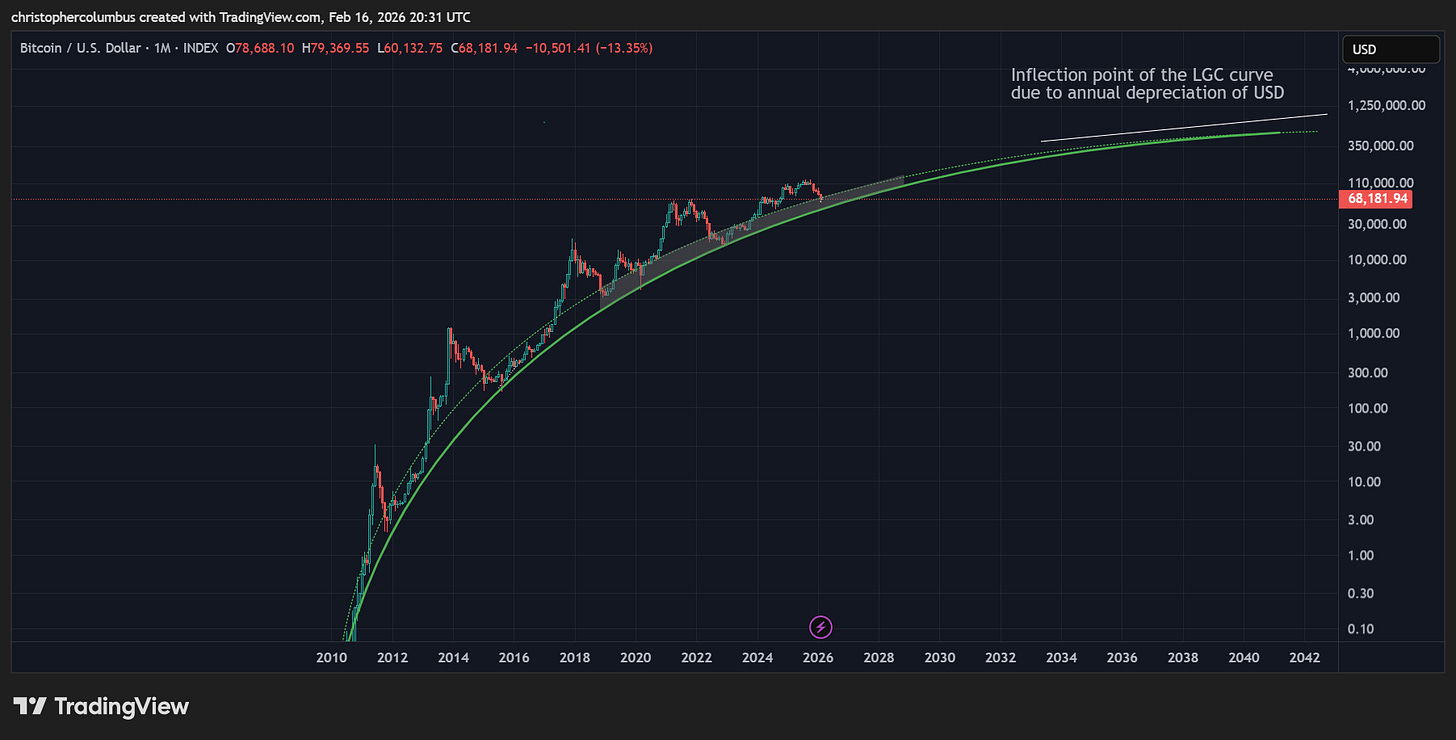
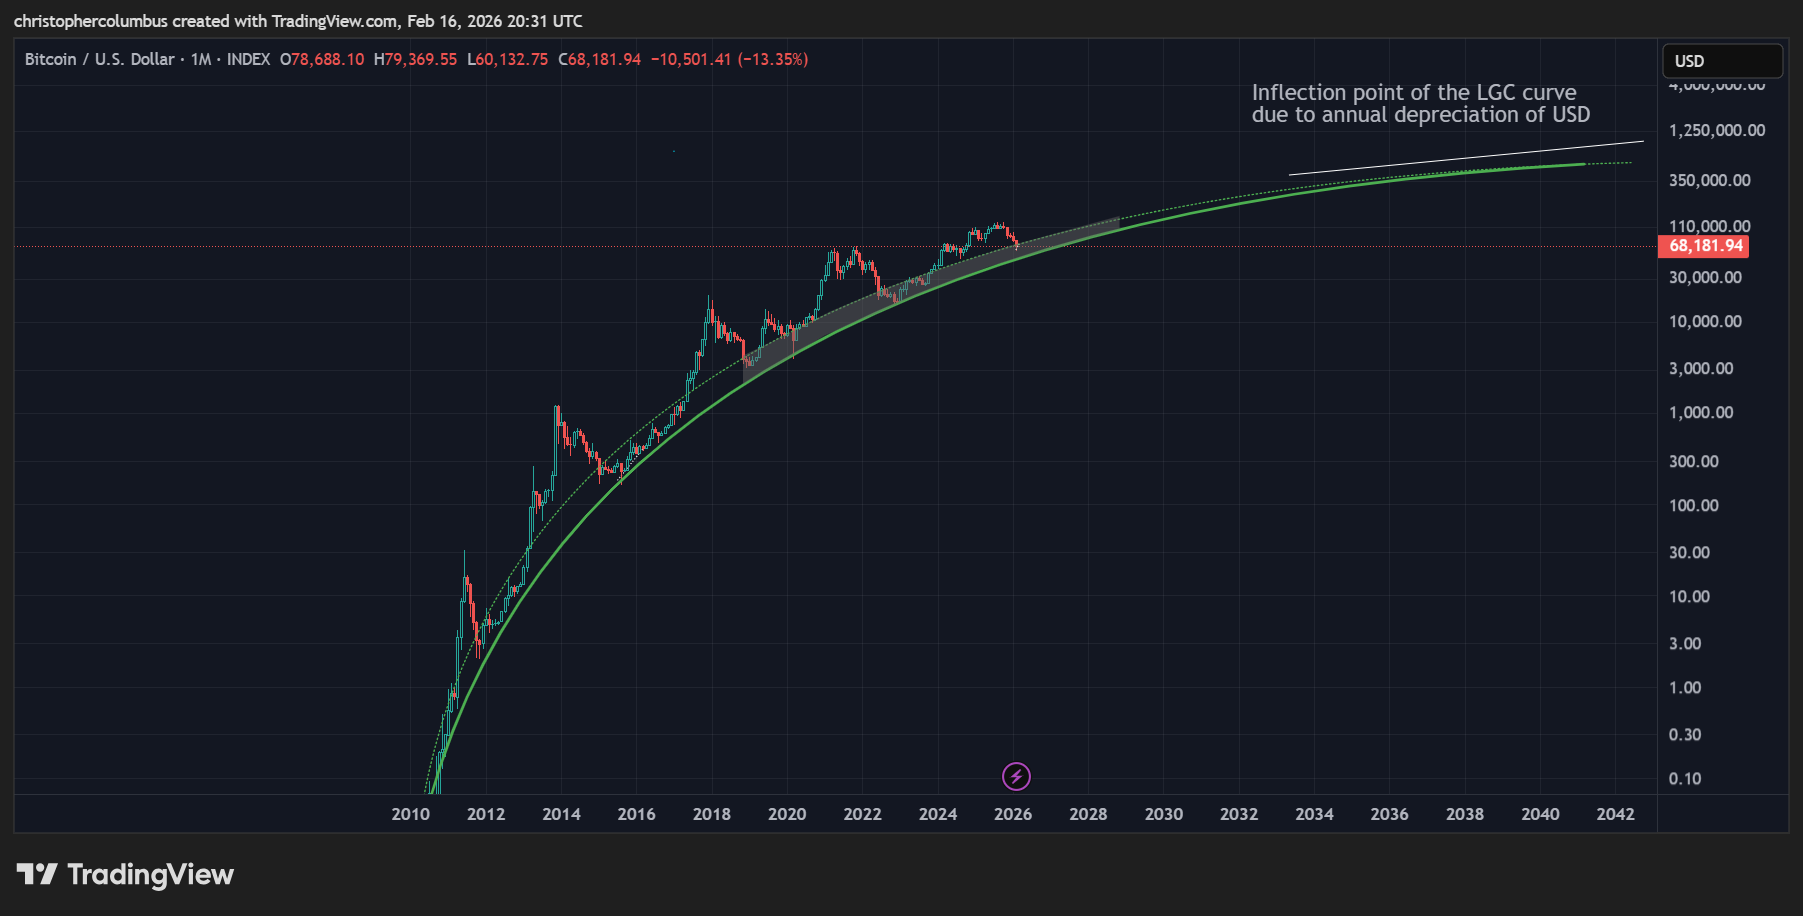
A quick recap - the LGC itself was drawn at the end of 2018 following the final capitulation of that cycle. It has a definite logic to it that is described in the title itself - a logarithmic growth curve. This curve, a force in nature, follows explosive gains at the start to increasingly plateau at the top. In Bitcoin terms, this is described as a process of capitalization and price discovery. The curve incorporates most of the bottom price points while levelling out into a plateau as follows:
A few things to note with this LGC itself:
- the LGC is primarily the cyclical base/ support of price
- it was first drawn in 2018 and has performed well in predicting when to buy for new entrants into the market [the shaded ‘buy zone’]
- the ‘inflection’ point predicts an area where the exponential gains in BTC will have been made [the capitalization/ price discovery of a new currency], but price would continue to rise given the inflationary nature of USD
Superimposed on the LGC curve is the LGC channel, and so to that we now turn.
The LGC Channel
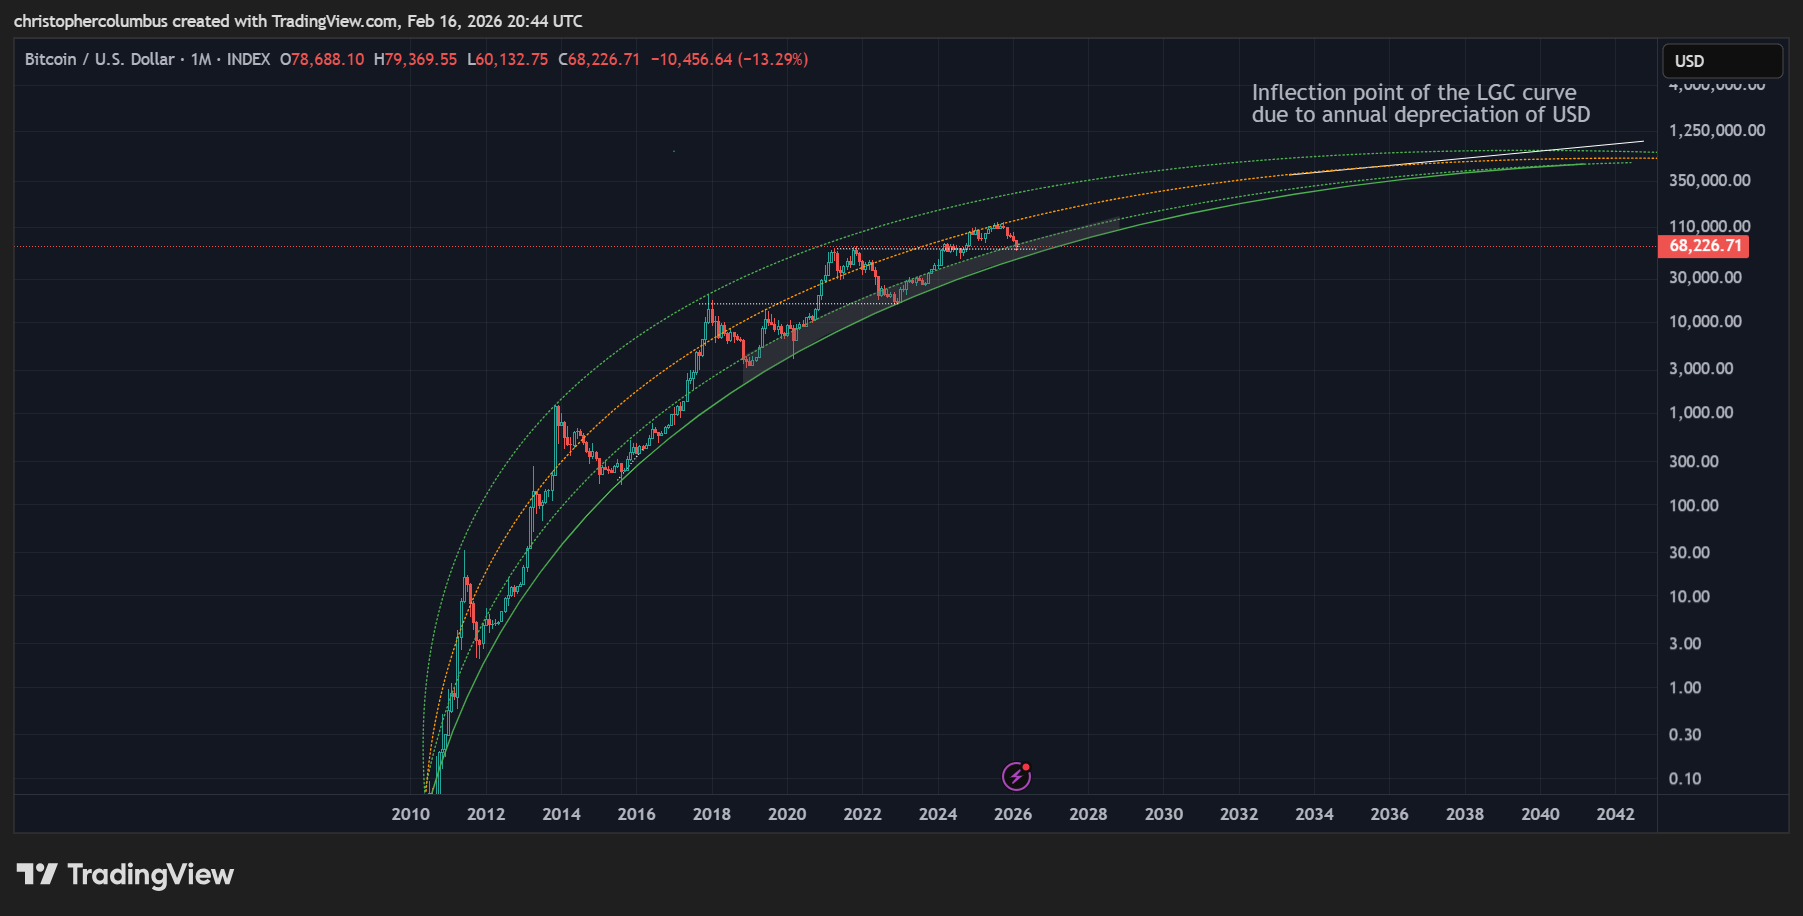
The top of the channel looks to incorporate the top price levels while in turn converging to the base/ plateau [with also a median level sketched]. Points to note:
- the channel functioned relatively well in 2021 [the double top] when most of the market was expecting a further parabolic blow off phase [similar to 2017]
- the channel did not function well in predicting a top this time… even though the channel continues to function as the range in which price moves… something significant for the expected bottoming of price.
Of course, the reader is going to ask why should price observe the bottom of the channel, if it didn’t observe the top. A question to which I now turn.
An Expanation for Reducing Highs within the LGC Channel
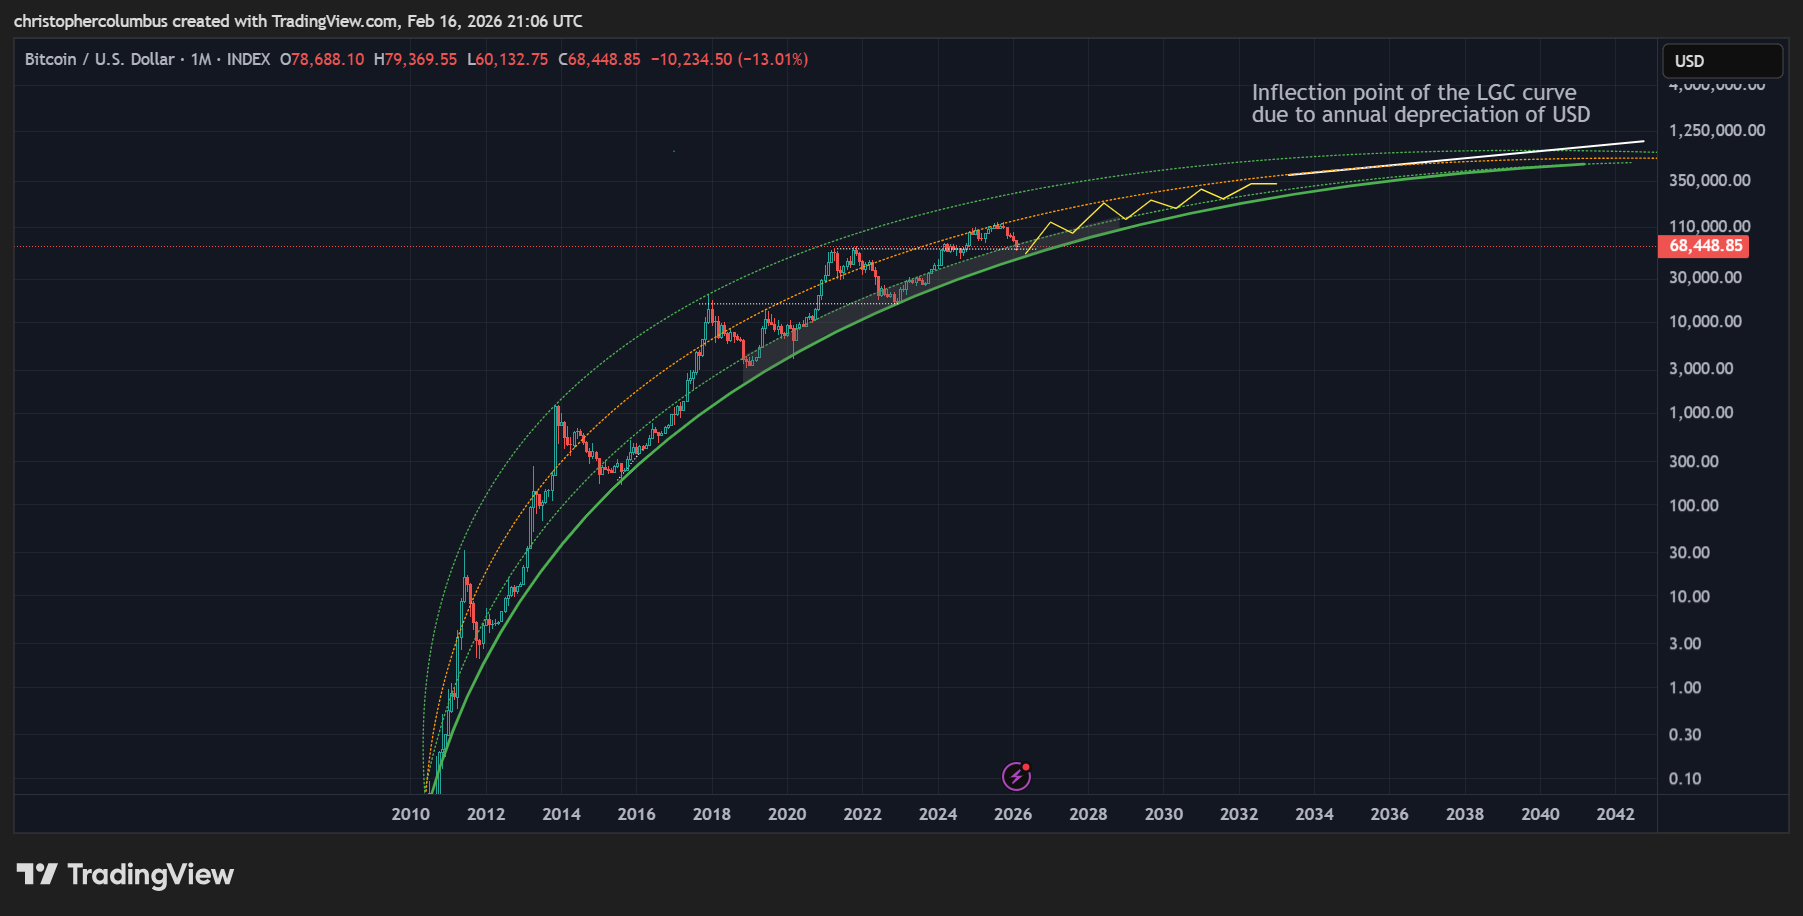
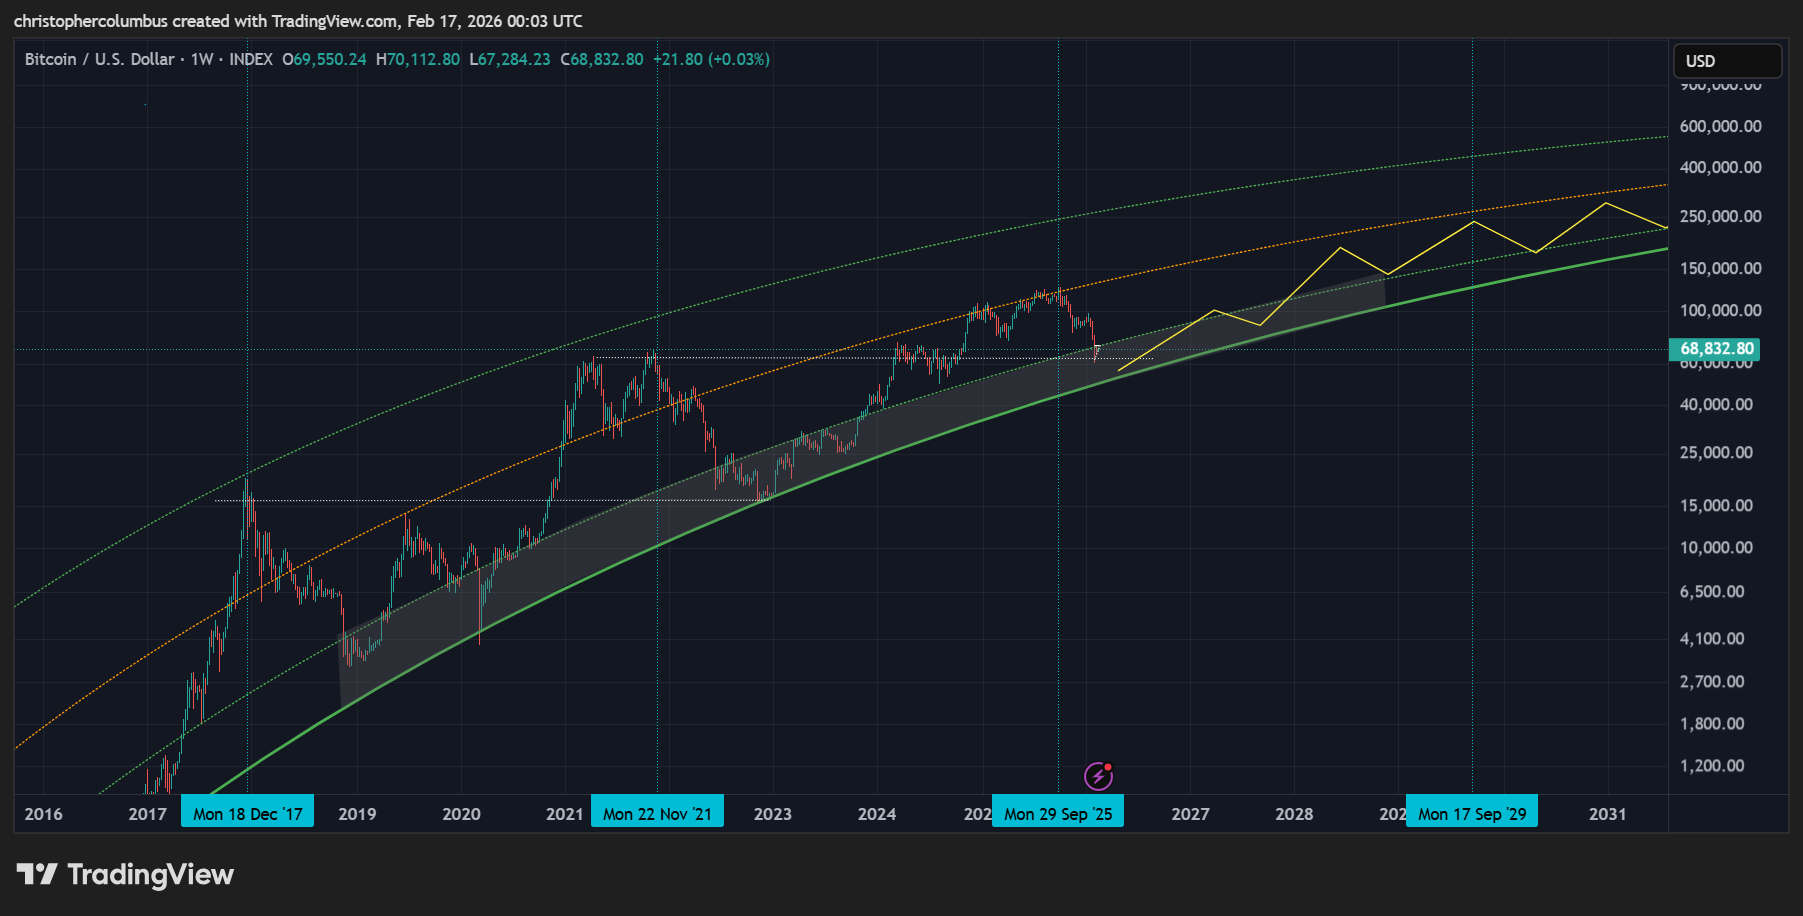
Keeping in mind that the primary component of the LGC is the base curve itself, the channel drawn atop of it is secondary. Noticeable over the course of this cycle, and something I’ve commented regularly on, is the remarkably technical nature of price movement as opposed to parabolic. Arguably, the era of parabolic markets is over as the market matures into a more technical one. If this is so, then the upper line of the channel would become redundant, where that line is seen to have belonged to markets moving parabolically. 2021, where price last near hit the upper line, would mark the end of parabolic moves and the beginning of a more technical market. The current technical market would continue to appreciate while also coming into closer proximity to the base of the curve over time. This would lead to reducing macro volatility in price as illustrated in concept here:
What Does a Maturing Market Gravitating to the Base Predict for the Next Top?
Assuming another multi-year cycle roughly equivalent to the previous, and another technical progression in price, the prediction is looking at something nearing 250K. This is also assuming a relatively stable USD, though one depreciating at a constant rate to put further upward pressure on prices going forward.
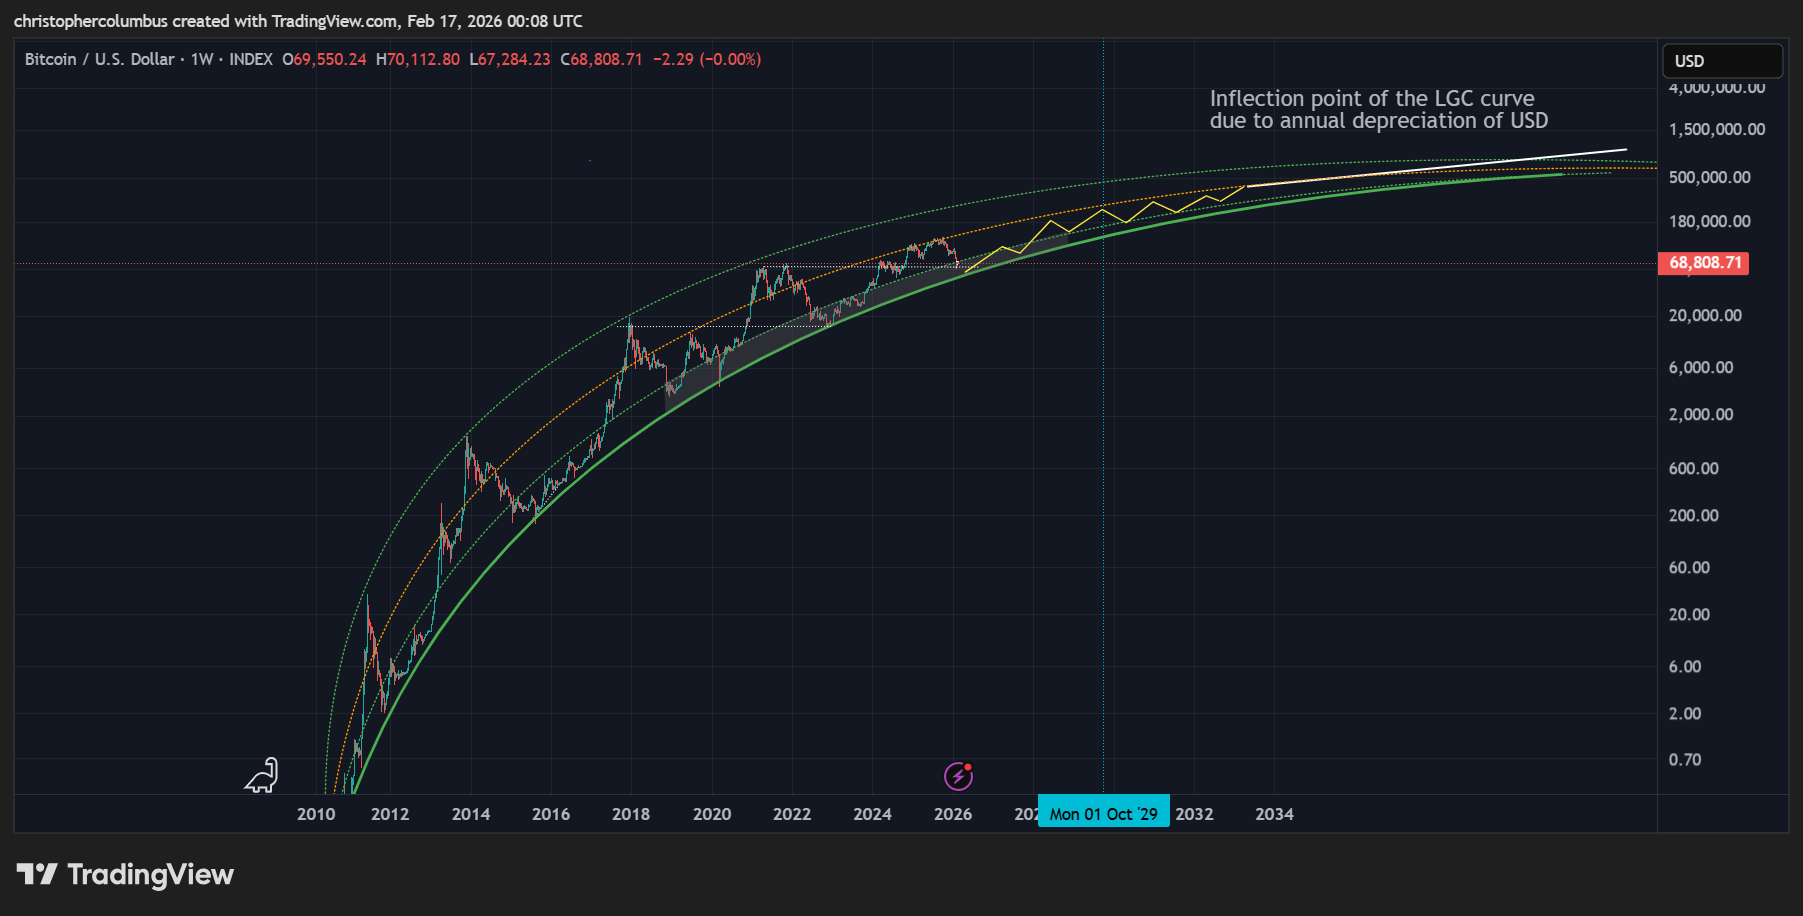
All things being equal, the expectation would be for price along LGC lines to plateau against USD below one million. The problem however is that the debt-based pricing mechanism of USD is itself depreciating year on year at a steady rate. This would see an inflection point in the growth curve at some point. Where previously it has effectively reflected exponentially moving prices in parabolic markets, and now even in strong technical markets, at some point when Bitcoin becomes effectively capitalized and less volatile, it will still reflect the annual depreciation of USD. This is what the white line represents, which would take price beyond one million in the not-too-distant future. This line was arrived at in an article three years back - Modeling the Long Game - How can the LGC in BTC/ USD Plateau while USD Hyper-Inflates? - in order to account for inflationary pressures in USD.
An inflection point is the point of a curve at which a change in the direction of curvature occurs. An inflection point in the LGC as priced in USD must occur when we see a shift from exponential rises in price, that come with a process of rapid capitalization, to a more stabilized price, where price increases would be more normative - as say, for example, the increase of gold against USD.
This inflection point would come when BTC is near capitalized, and where the curvature of the LGC, which measures the rate of Bitcoin’s appreciation against USD, would be similar to the long-term rate of gold’s appreciation against USD - 10% compounded per annum. The chart that follows is the mapping of this inflection point, where the LGC in USD would be superseded due to USD’s macro depreciation.
Until next time,
Stay [relatively] safe out there,
Dave the Wave.