
The Tipping Point from the Technical Perspective
Dear Readers,

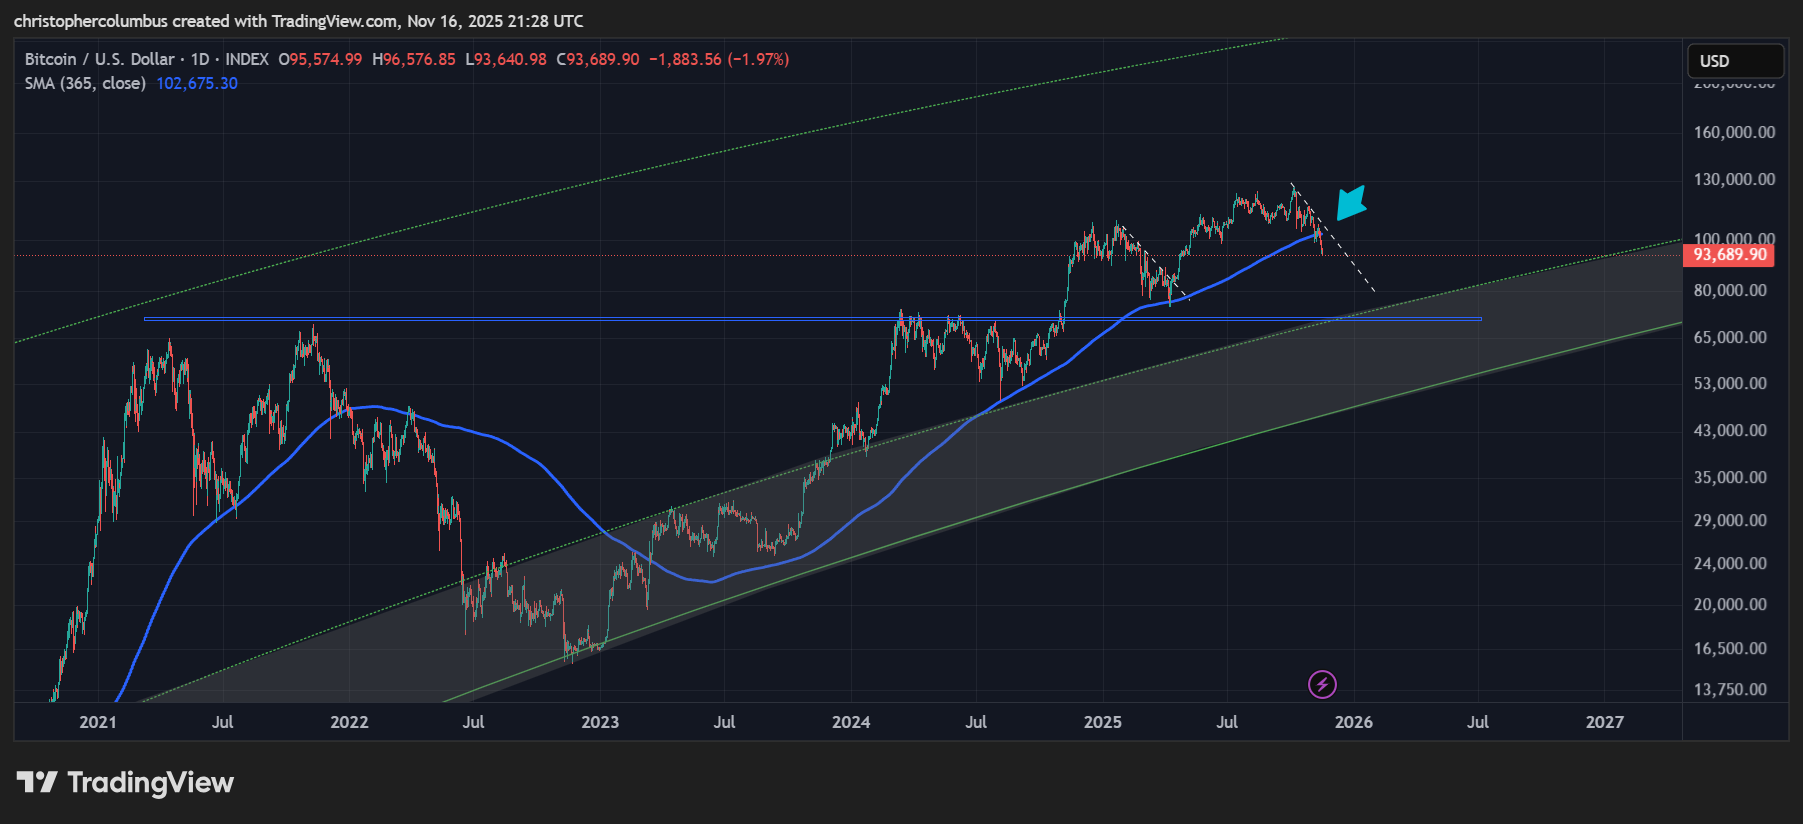
From recent developments in price, I think it fair to say that, in the shorter to medium-term, the tipping point from a bullish outlook to a bearish one has been reached. This outlook I’ve described as a process with various levels to be met as per the ‘DEFCON System’ in a few recent articles. It should also be a process as per a spectrum, where though one might be bearish/ risk averse in the medium term, they don’t become overly so. And for the following reasons: price can always snap back to the upside at anytime; and even if it recovers at a later date, BTC is still in a secular bull market as per the logarithmic growth curve [that has held true since 2018].
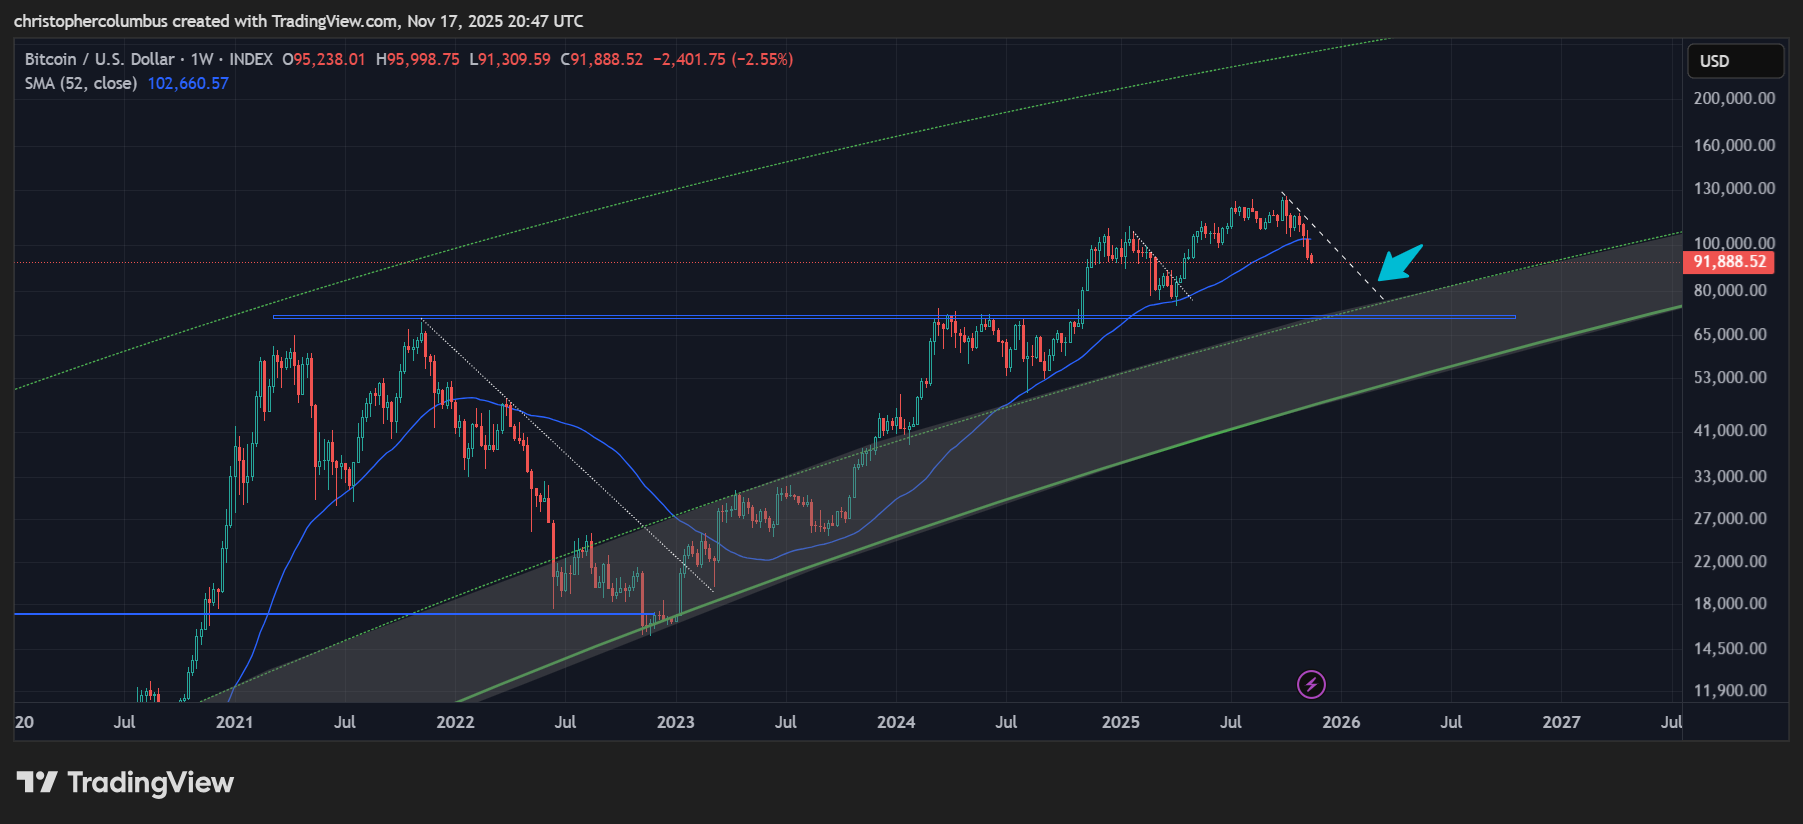
The primary factor for the tipping point into a more risk averse outlook [even while risk should always have been managed one way or the other] is the break of the 1 year moving average yet again that I have viewed as the line in the sand. Previously, over the course of this multi-year bull run, this has acted for support. One mitigating factor to keep in mind here against this, in order not to become too bearish, is the incredibly technical and ordered nature of the price action this time around - if price has become increasingly stable in a maturing market, then at some point that moving average should come to function as more of a mean of price as opposed to the traditional support of the past. That said, price has now to ‘prove itself’ in a downward trend in the more immediate term.
Fib Level Corrections of the Multi-Year Moves
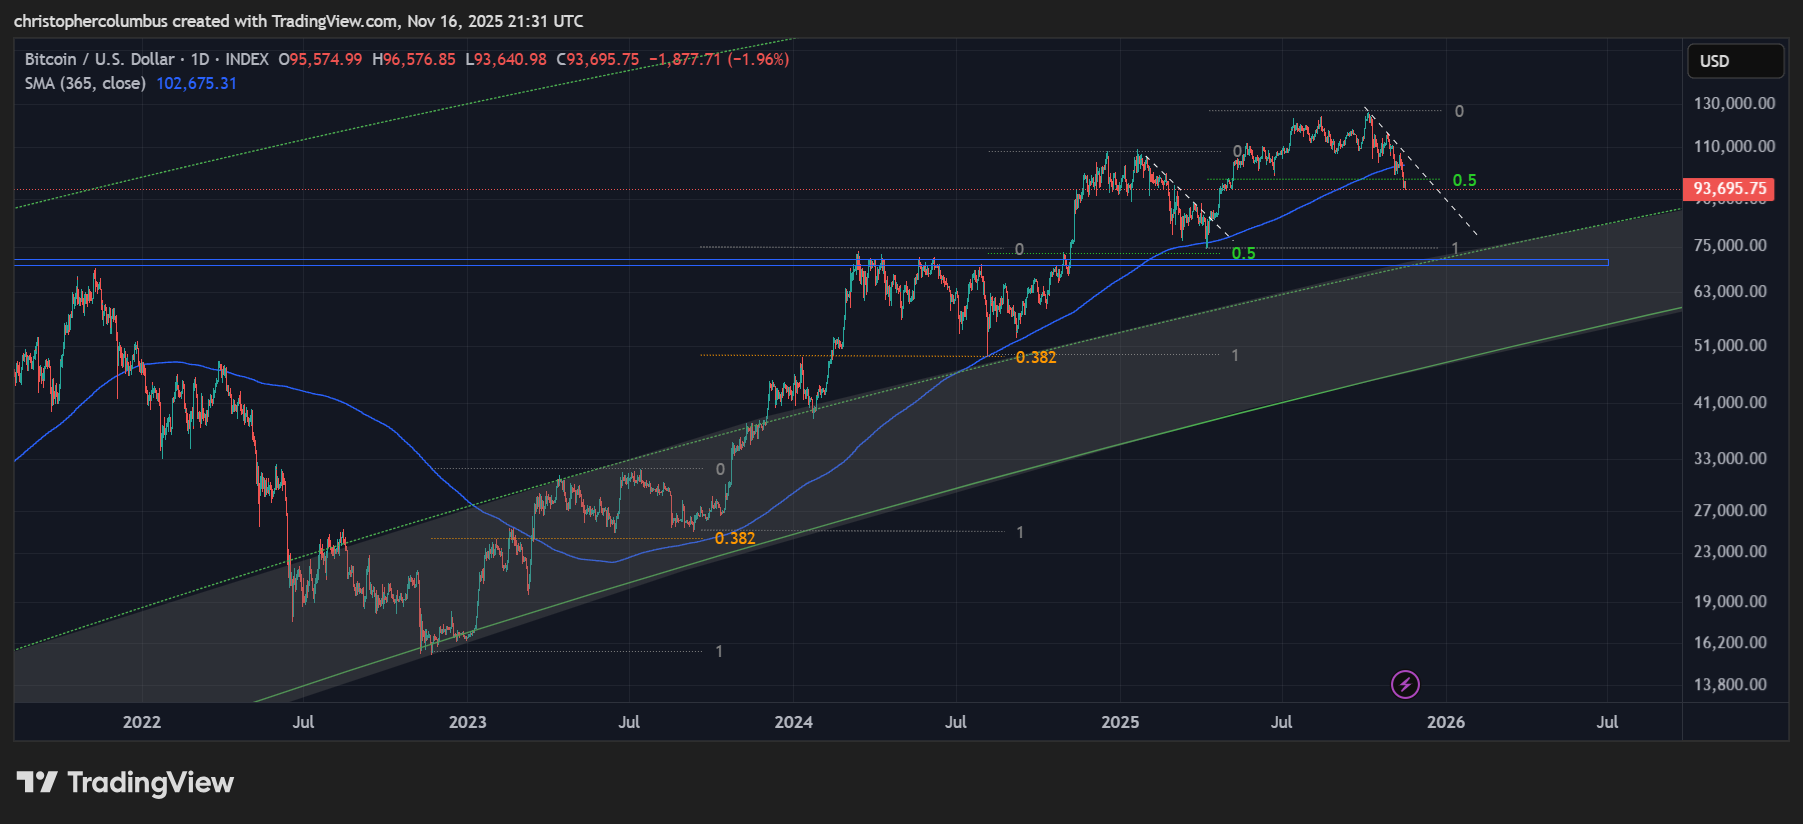
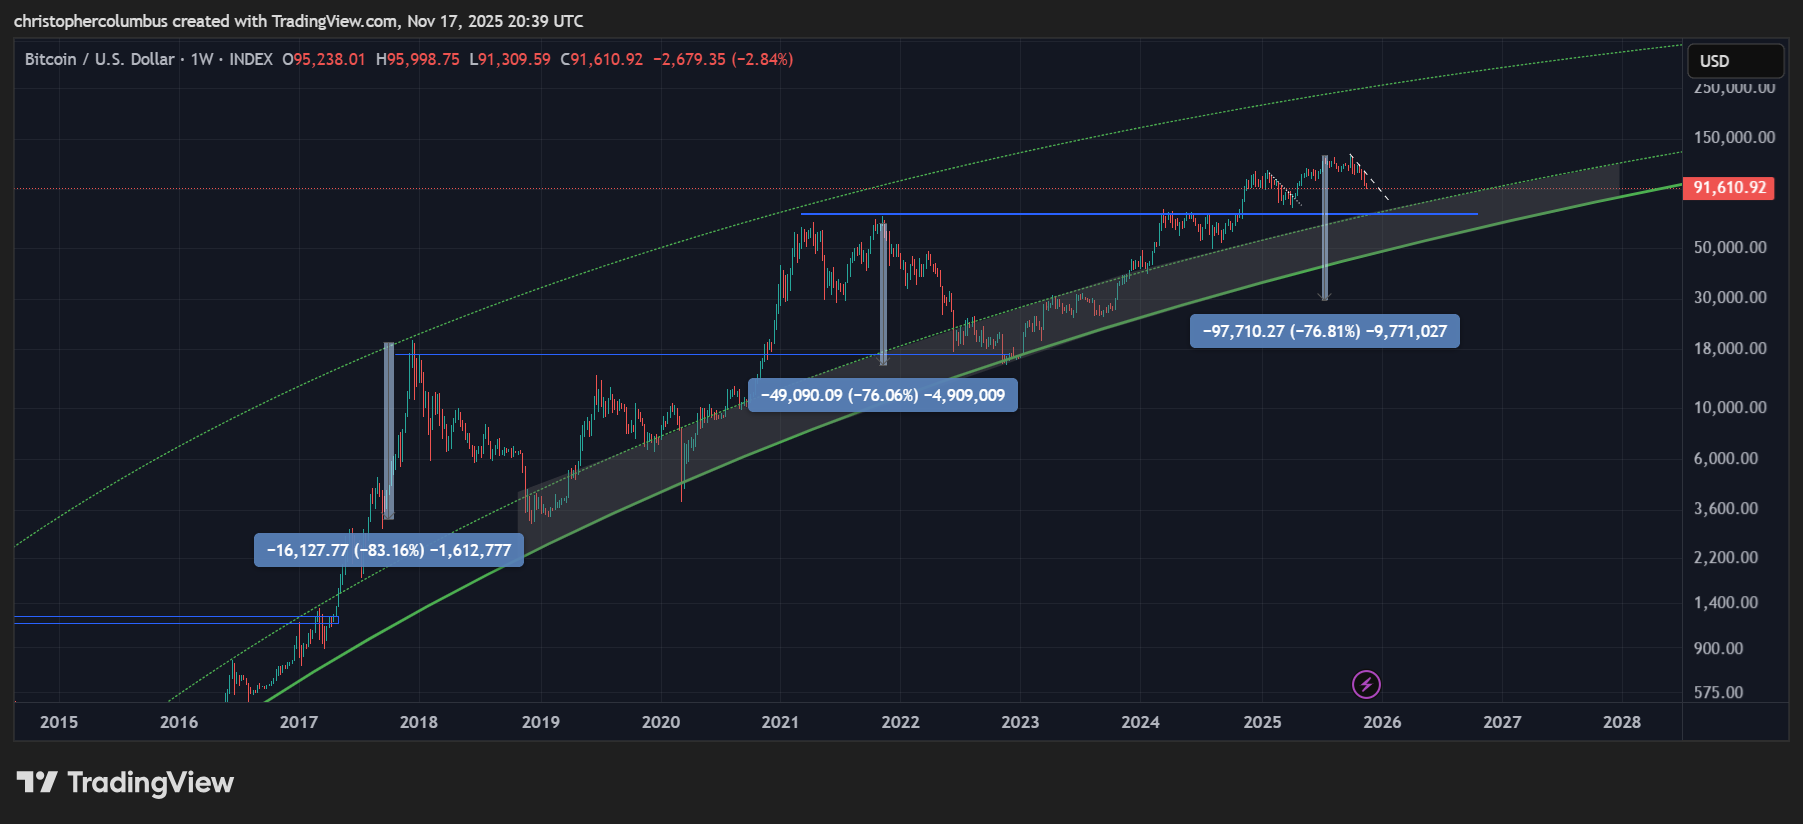
The fib levels here, on the logarithmic function, measure the real/ relative corrections of the moves up. As you can see, where the first two involved 38% corrections, the later two are increasing in size [ 50% and now over 50%] even as those moves up reduced in size. This lack of a parabolic move, and an increasingly stablized price even as prices are elevated, is something quite new to the market [though the double top of the prvious ‘cycle’ was perhaps a sign]. The silver lining on the cloud here is that just as the rise was not parabolic and more technical in nature, so too should the correction, i.e.; no complete precipitous decline or crash as per previous tops [if this was indeed the top].
Technical Support in a Declining Market
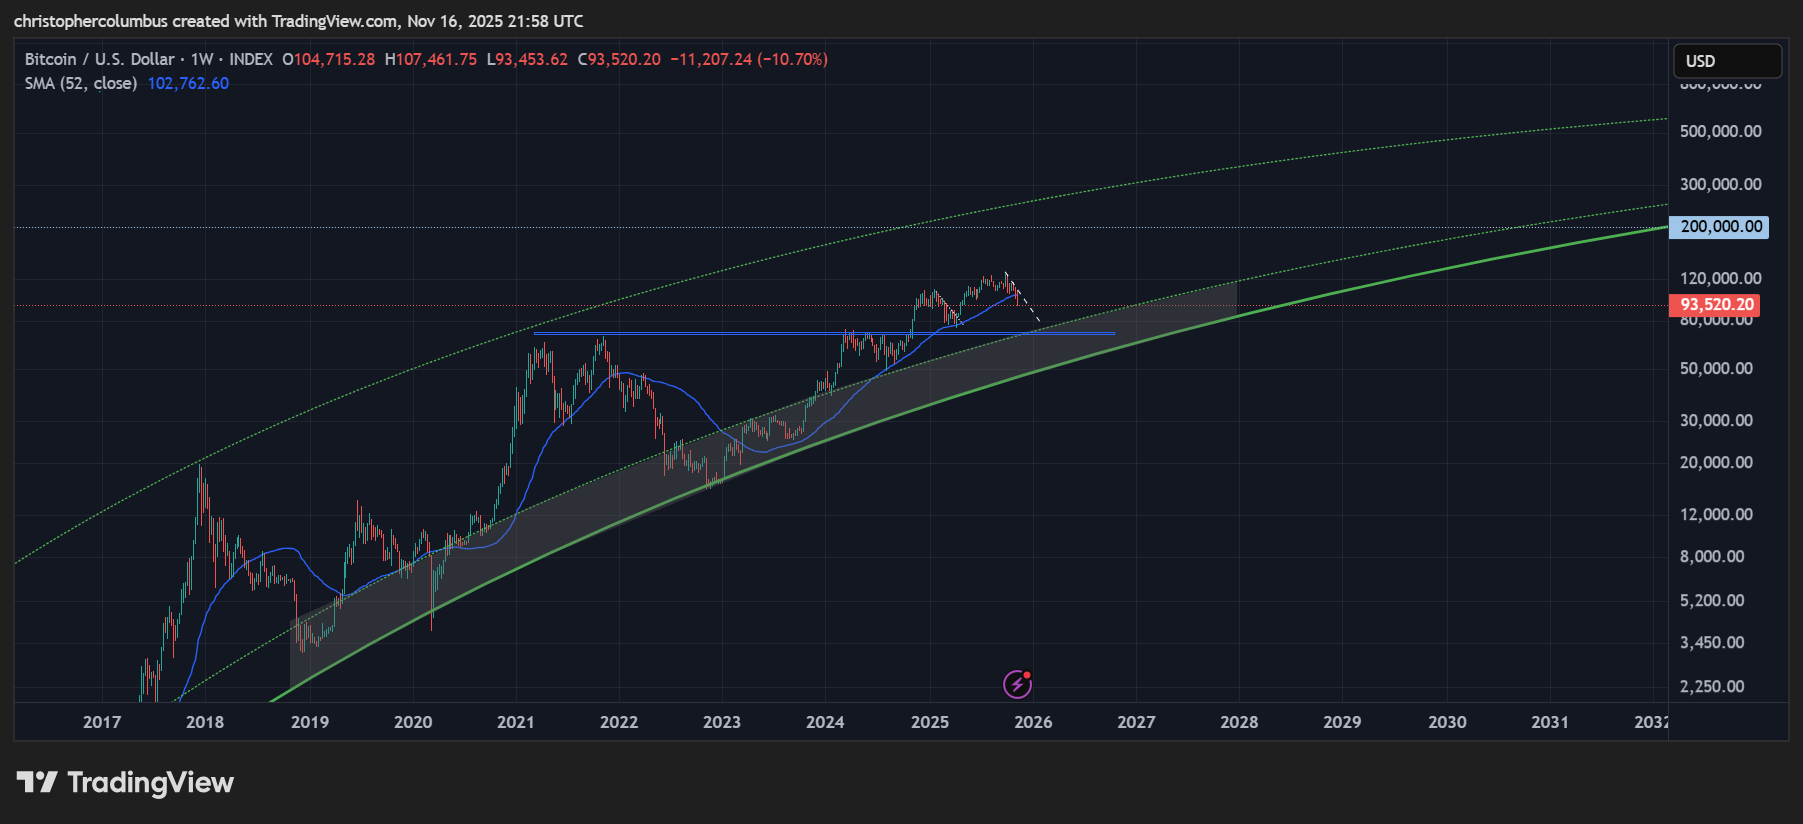
Given the outlook of a continued secular bull market as per the model of the logarithmic growth curve, the question now becomes where support for price is likely to be found. The technicals can be combined with the back stop of the LGC base buying zone to provide a zone where renewed buying should come in to build that base in price.
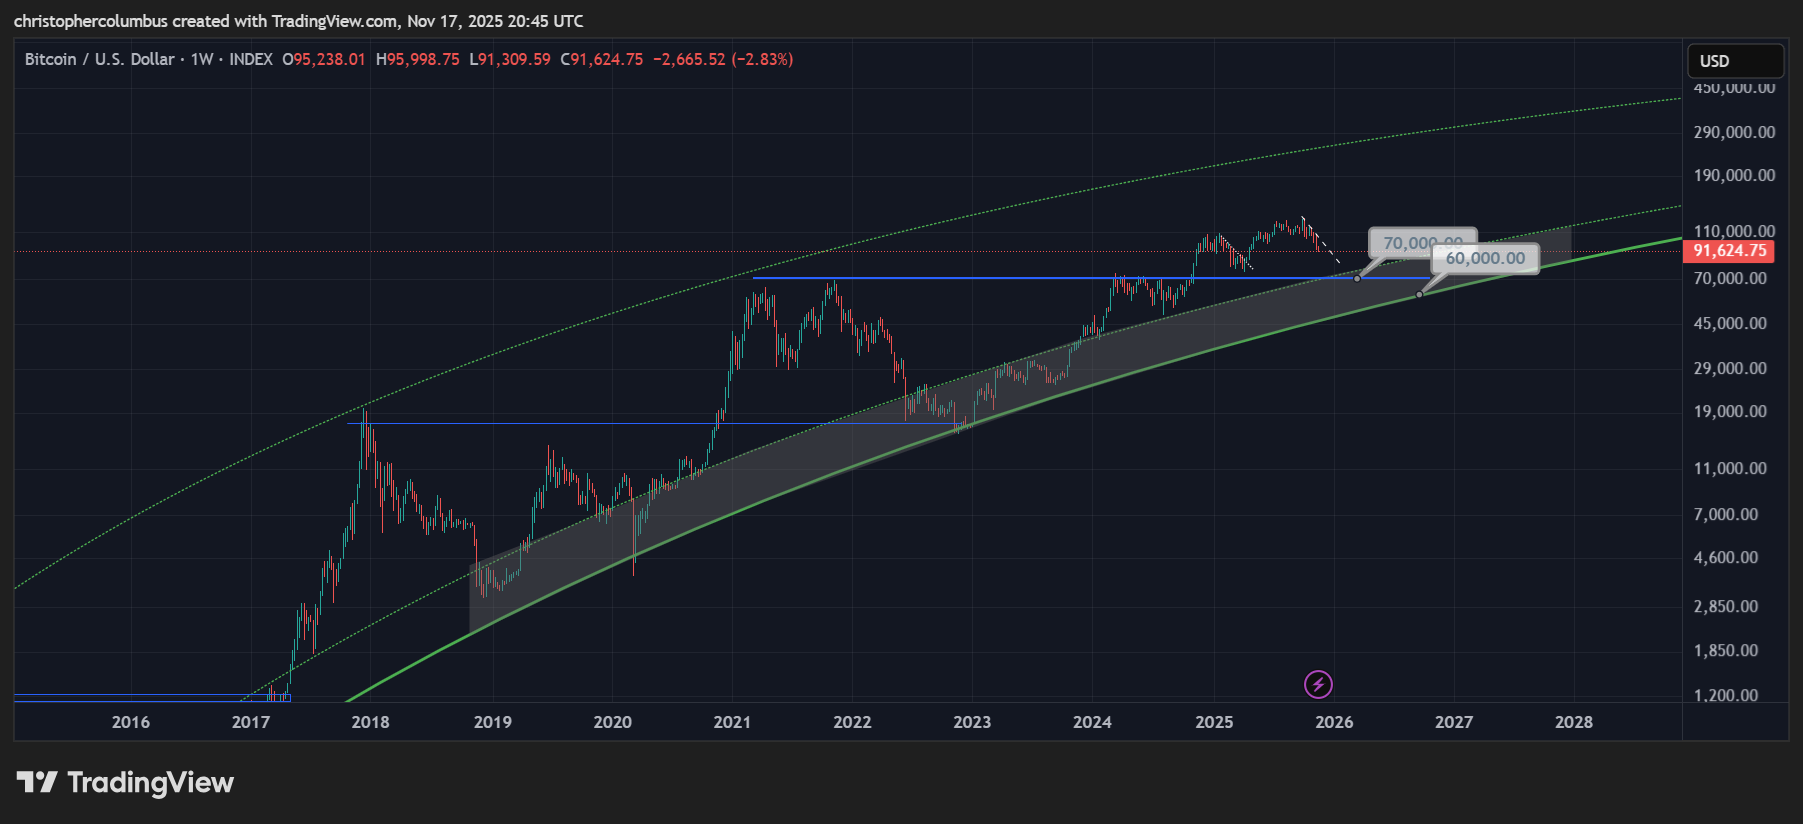
First of, in LGC terms, BTC price is fine - though it has only run halfway through to the top of the channel, it is still solidly midway in that channel. If it continues to correct, the LGC buyzone is not far off to meet it. The top of the buyzone is 70K and that coincides with a significant technical level of multi-year resistance come support. Factor in a more modest technical correction, as opposed to a post parabolic one, and the investor that bought the buyzone at lower prices can remain confident.
Looking further out, and factoring in the the base of the LGC curve being more significant than the top [that related to parabolic markets], a 200K price is still likely going forward… but in the next multi-year bull market, and from there higher as price discovery and the capitalization of an alternative currency works itself out.
Of course, this is not great news at all for those that were looking to trade BTC [or the '4 year cycle]. It is however Ok for those investors with more modest expectations in price development… though even then more time may be involved for those higher prices.
Lessening macro volatility is the story here. And volatility was that opportunity that we were looking for in the shorter-term. The expectation of major alt coins outperforming the volatility of BTC over the multi-year cycle has not really played out. What did play out was an interim volatility in alt coins, to both sides. It was the shorter-term trades, the swing trades and the double ups on the more volatile coins that paid off… or covered speculative losses in those longer-term trades. But back to the BTC chart and the longer-term.
The Unparabolic Market - a ‘Mixed Blessing’
Back in the day, there was much talk about eventual price discovery. And this has to be a good thing for a currency in the process of capitalization as I believe Bitcoin is. And it is this process, of price discovery, that the LGC curve represents.
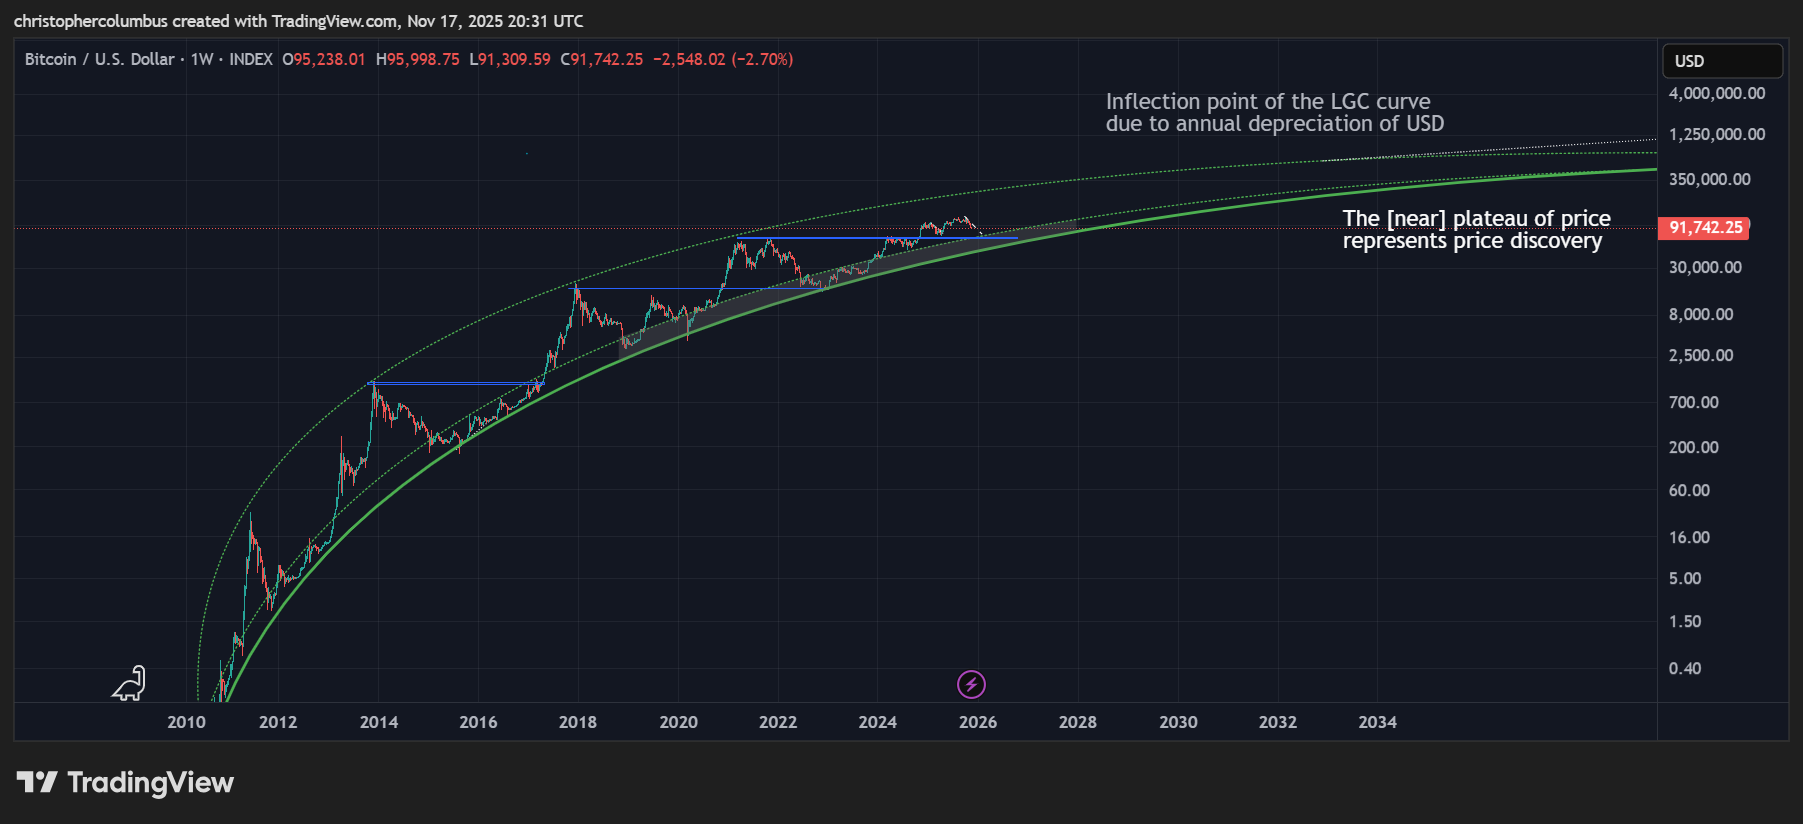
Taking the rate of annual inflation into account at the later plateau [as opposed to the earlier parabolic phases], price discovery should be at least a million USD, and from there, once capitalized, would function as an inflation hedge - digital gold.
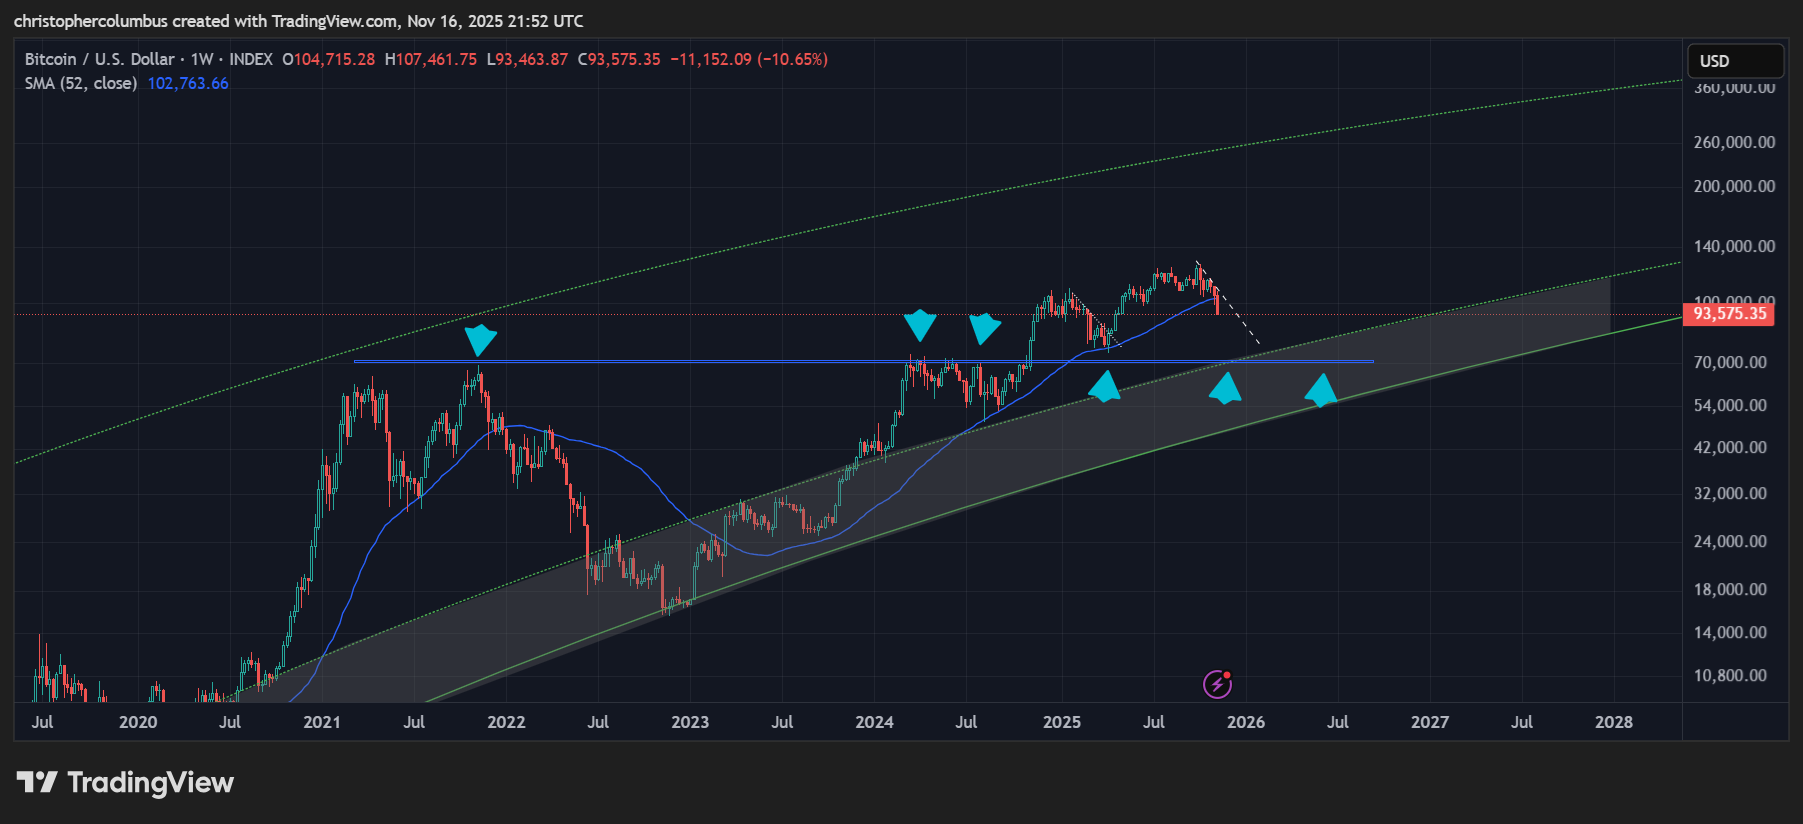
Though the increasing price stability that comes with price is frustrating for the trader who is looking to trade the macro volatility [of say the 4 year cycle], the positive of this is that volatility to the downside should also be reduced. A 76% precipitous decline to 30K over the course of the year, as the following chart illustrates, is very unlikely in my opinion.
Much more likely is a more modest consolidation in price, to reflect the modest rise, whereby the macro chart comes to align with the technicals… not to mention the LGC buyzone/ base at around the 70K mark [the bottom of the LGC buyzone itself would be around 60K] -
There is now also a clear line of downward diagonal resistance formed, a break of which would be a risk-managed buy or re-entry. Keep in mind that though one eye should be kept on the ‘4 year cycle’, given the history, a full year of correction should not be simply assumed - a maturing technical market will at some point break it, where Bitcoin will not be bought not because of the mechanics of scarcity [halving] but because of scarcity per se. From the macro perspective, one could think of the parabolic action as frontrunning that buying of scarcity.
So in sum, though the current turn in the market is of concern for Bitcoin traders, and those that were looking to trade say the 4 year cycle, there should be little concern for the longer-term investor that has bought Bitcoin at opportune moments, say when price was in the buyzone of the LGC. Going forward, with a longer time horizon, the investor can be confident of a continued rise and captialization along those lines.
Until next time,
Stay [relatively] safe out there,
Dave the Wave.